Abstract
Background: Natural disasters have severe impacts on the health and well-being of affected households. However, we find evidence that official damage cost assessments for floods and other natural disasters in Vietnam, where households have little or no insurance, clearly underestimate the total economic damage costs of these events as they do not include the welfare loss from mortality, morbidity and reduced well-being experienced by the households affected by the floods. This should send a message to the local communities and national authorities that higher investments in flood alleviation, reduction and adaptive measures can be justified since the social benefits of these measures in terms of avoided damage costs are higher than previously thought.
Methods: We pioneer the use of the contingent valuation (CV) approach of willingness-to-contribute (WTC) labour to a flood prevention program, as a measure of the welfare loss experienced by household due to a flooding event. In a face-to-face household survey of 706 households in the Quang Nam province in Central Vietnam, we applied this approach together with reported direct physical damage in order to shed light of the welfare loss experienced by the households. We asked about households’ WTC labour and multiplied their WTC person-days of labour by an estimate for their opportunity cost of time in order to estimate the welfare loss to households from the 2007 floods.
Results: The results showed that this contingent valuation (CV) approach of asking about willingness-to-pay in-kind avoided the main problems associated with applying CV in developing countries.
Conclusion: Thus, the CV approach of WTC labour instead of money is promising in terms of capturing the total welfare loss of natural disasters to households, and promising in terms of further application in other developing countries and for other types of natural disasters.
Located on the Indochina Peninsula in Southeast Asia, Vietnam is considered to be one of the countries most prone to natural disasters Citation1. It has a typical tropical climate affected by the Asian monsoons, mainly the winter and summer monsoons. On average, Vietnam has almost 2000 hours of sunshine per year, about 100 days of rain with a volume of about 2000 mm/year, humidity of around 85%, and an average temperature of 24°C. Vietnam is usually also affected by six or seven storms and tropical depressions annually, mainly in the north and central regions Citation2. This climate pattern has had negative impacts on socioeconomic development, especially on poor, local communities. In the context of climate change with an expected increase in the frequency and severity of disasters, the country is likely to suffer even more from the many types of natural disasters it now experiences. These include floods, storms, tropical depressions, storm surges, inundations, whirlwinds, flash floods, river bank and coastline erosion, drought, landslides, and forest fires Citation3. Among these natural disasters, floods are the most threatening, followed by typhoons and then droughts as major natural disaster risks Citation4. All theses natural disasters have severe impact on the health and well-being of the affected households.
In order to measure the loss in well-being from a flood event, we conducted a large-scale survey in July 2009 in the Quang Nam province in Central Vietnam asking 706 households to state their preferences for a flood alleviation scheme that would avoid the welfare loss from a future flood. We used the stated preference method of contingent valuation (CV) to ask households for their willingness-to-pay (WTP) in terms of contributing labour to avoid a future flood similar to the one they had experienced in October–November 2007. Their WTP can then be considered a monetary measure of their aggregated loss in well-being, i.e. welfare loss from this flooding event. Detailed data on the physical damage like loss of their house, crops and livestock were also recorded during the survey. The socioeconomic characteristics of the households, and the social and health impacts they had experienced, were also recorded. The time lag of less than 2 years from the last flood event occurred to the time of the interview could cause recall bias. Our impression during the interviews was, however, that people had this last flood, which was rather extreme for this area, in fresh memory and had no problem recalling the impacts. Thus, the recall bias seems small, and we do not expect this to influence their reported impacts nor WTP.
CV studies of flood risks and flood risk reductions are rare Citation5, especially in developing countries. Brouwer et al. Citation6 estimated WTP for a flood alleviation scheme in Bangladesh and found a number of problems with the application of CV in this developing country context. Half of their almost 700 respondents were unable to pay in financial terms. However, they found that half of these respondents with zero WTP were willing to contribute in-kind, mainly by supplying household labour for the construction of the embankment. This result indicates that WTP for these respondents was in fact positive and that the WTP approach would greatly underestimate their true WTP to avoid the loss in well-being. Therefore, in this study, we pioneer the use of the willingness-to-contribute (WTC) labour approach to estimating welfare loss from flooding. By eliciting the maximum number of person-days each household could contribute, and assigning an economic value to each person-day based on the opportunity cost of time for these households, we expected to obtain a more correct estimate of the total welfare loss of flooding to these households.
The main objectives of the paper were to test the WTC approach for assessing the total welfare loss of a flooding event in a developing country in terms of (i) obtaining a low number of zero answers, especially protest zeros (i.e. those who have a positive WTP/WTC but state zero because they protest some aspects of the scenario they are asked to value); (ii) testing the construct validity of the WTC function in terms of whether WTC labour increases with household income, the economic value of the physical damage the household experienced, the number of floods experienced, and whether their village was located in a flooded versus a less-flooded area (meaning their houses were not inundated); and (iii) comparing the economic value of the households’ WTC labour with the self-reported economic value of their physical loss.
Respondents were asked to consider both their physical loss and loss in terms of health and well-being when stating how much WTC labour they would commit to a project to prevent a flood similar to the one that they had experienced in 2007. We would expect WTC to exceed the economic value of the physical damages they sustained, because it captures the loss in health and well-being. For the reported physical damage, we also looked at the difference in economic damage between (i) households that were very poor (well below the official poverty line) versus those that were not; (ii) households that fully depended on natural resources versus those that did not; (iii) households in a flooded versus a less-flooded area; and (iv) whether respondents reported having acted upon early warning messages or not.
This paper is organized as follows. The next section describes the study site and the floods of 2007, followed by a description of the sampling procedure and the CV survey, including the WTC-related questions. Next come a report and a discussion of the results of the CV survey, followed by a comparison of the CV results to the physical damage costs respondents reported, and finally some concluding remarks.
The study site
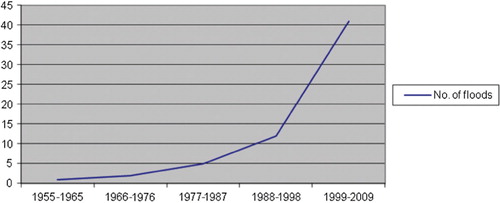
Vietnam's geographic location and topographical conditions generate particular climate characteristics that result in severe and diversified natural disasters but the greatest threat is flooding. The frequency of floods in Vietnam has increased rapidly during the last 50 years Citation7; see .
Fig. 1. Frequency of floods per decade in Vietnam 1955–2009. (Source: CRED-EMDAT, 2010 (7)).
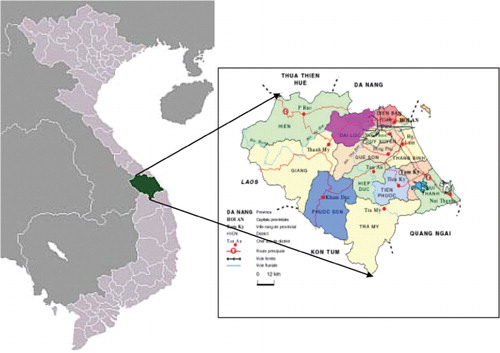
Located in the heart of Vietnam, the Quang Nam province is about 860 km to the north of the city of Ho Chi Minh and 865 km south of the country's capital, Hanoi (). The province is at the intersection of the two geographical regions of North and South Vietnam, which are characterized by a slope topography from west to east with many mountain ranges, short rivers, deltas and coastal areas that create a diversified ecosystem. However, it is also one of the most highly disaster-prone regions in Vietnam. The most frequent and severe natural disaster in Quang Nam is annual re-occurring flooding, resulting from heavy rainfall during the months of September through November.
Fig. 2. Map of Quang Nam Province (Source: google.nl/image)
The year 2007 was recognized as ‘the year of flooding’ in Quang Nam Citation8. Because of the impacts of storms nos. 5 & 6 in the North provinces and monsoons, heavy rain occurred throughout the province with rainfall averaging 2000 mm (and in some districts, rainfall reached almost 3000 mm) from October 1 to December 7, 2007. In 2 months, there were nine flooding events in the Quang Nam province, including three big floods that occurred over a 20-day period (from October 15 to November 5, 2007). Consequently, many communities were inundated, with the water rising to 1.5–1.7 m, i.e. about 0.5–1.5 m higher than the water levels of a historical flood in 1999 Citation9. This 2007 flooding event caused many serious impacts as local communities had not recovered from previous floods. Thus, the 2007 flood was much larger than the annual floods and can be viewed as a 10-year flood.
The floods caused serious health problems for the local people, particularly for the elderly and disabled family members, women, and children living in poor communities with limited food stocks, lack of drinking water sources, and poor sanitation. Epidemic diseases such as marsh fever, malaria, dengue fever, and diarrhoea, among many others also appeared when the floods occurred. In poor communities, sanitation facilities and public health care systems were destroyed.
These floods killed 67 people, injured 339, and caused total physical damage costs estimated at 2000 billion VND (equivalent to about 100 million US$) in the Quang Nam province. Local authorities had to evacuate about 70,000 people from inundated areas to safety in public buildings Citation8. A total of 200,000 people needed urgent aid in terms of foods and water, and there were devastating impacts on local infrastructure. Floods isolated villages by disrupting community roads, preventing access to services, and suspending business activities. The 2007 floods also prevented children from going to school and disrupted information and communication systems. Sea dykes, roads connecting villages, and the main roads in coastal communities in Quang Nam were also heavily degraded.
Study design
To assess the integrated health, social, and economic impacts of the 2007 extreme floods on local communities, we conducted a large-scale survey in two districts, one that was heavily flooded and one that was less flooded (defined as houses not being inundated). The Duy Xuyen district was randomly selected from the list of heavily flooded districts (which also included Dien Ban, Dai Loc, Hoi An, and Tam Ky). The Thang Binh district was randomly selected from the list of less-flooded areas (which also included Hiep Duc, Tien Phuoc, Nui Thanh, and Phu Ninh) ().
Sampling procedure and survey structure
Local enumerators conducted face-to-face interviews with respondents from a total of 706 households in July 2009. A multi-stage cluster sampling technique was applied to randomly choose the two districts, villages within the selected districts, and households within the selected villages.
The Duy Xuyen district, which was heavily affected by the 2007 floods, consisted of 92 villages with 26,236 households (and a total population of 131,668 people). The less-flooded area, Thang Binh district, consisted of 131 villages with 47,137 households (and a total population of 192,550 people) Citation9. The list of villages and total number of households in each village were entered into Excel, and then the ‘probability proportionate to size’ method was used to select 25 villages in the flooded district and eight villages in the less-flooded districts. The researchers then collected the list of households for each of the selected villages from the heads of the villages, and 23 households were randomly selected from each village. These lists of households were distributed to the enumerators for household interviews. If a household could not be interviewed after three visits, the survey supervisor selected a new household for replacement. Local people, most of them heads of villages, were employed as local guides for enumerators to identify the selected households.
The survey questionnaire used to assess health, social and economic impacts contained four main sections: (i) socioeconomic characteristics of the household; (ii) the health impact assessment; (iii) the social impact assessment; and (iv) the economic damage assessment. Section (iv), the focus of this paper, consisted of four main parts: physical damages assessment, household income and expenditures, migration and displacement, and WTC labour to a flood alleviation program.
The WTC labour questions
Contingent valuation (CV) studies in the field of flood risk research have usually asked respondents whether they are WTP money for a particular prevention program rather than go without it [e.g. Citation6 Citation10 Citation11]. A limitation of using monetary measures in these valuation studies, especially studies conducted in developing countries, is a high number of zero bids resulting from severe financial constraints [e.g. Citation6 Citation12]. Therefore, in this study, we sought to test WTP in-kind. We asked households whether they would be willing to contribute labour to a program that would prevent a flood event similar to the one they had experienced in 2007. Thus, their WTC could be used as a measure of the welfare loss to the households from the 2007 flood. More specifically, after respondents had listed the physical damages to their houses, crops, livestock, etc. from the 2007 floods, they were presented with two WTC questions.
First, respondents were asked if they were willing to contribute labour or not to a flood prevention program that would completely avoid the damages they had experienced in 2007 floods. The first WTC question read:
Suppose the government is now considering implementing a flood prevention plan, which in future years will completely avoid the damages you have experienced in the 2007 flood. The measure to avoid flooding will be financed by the government, but the local population will have to provide labour for these measures to be implemented. Thinking about the effects of flooding on the health and well-being of your household, and the damages to your home, agricultural production, fish farm, livestock, and other costs that the 2007 flood has caused your household, would your household be willing to contribute labour to that program?
1=Yes 2=No 3=Don't know
If the answer to the above question was ‘yes’, what is the highest number of person-days your household would be willing to contribute per year?
________ no. of person-days per year
Results and discussion
General respondent characteristics
summarizes the general demographic and socioeconomic characteristics of the 706 households in our sample. Most of the respondents (75%) were heads of their household, and about the same percentage of the respondents were men. The average age of respondents was 51 years, and the education level was generally low (20% of the respondents had never attended school, and 38% did not complete primary school).
Table 1. Characteristics of the respondents and their household (N=706 households)
Results from the CV survey
shows the results from the first WTC question.
Table 2. Results from WTC question 1: ‘The government is now considering implementing a flood prevention plan, and the plan is financed by government. Would you be willing to contribute labour to that program?’ (N=706)
Eighty-seven percent of the households that answered this question were willing to contribute labour to a flood alleviation program that would avoid the damages of a flood similar to the one in 2007. The small percentage that answered ‘No’ to contributing (i.e. 10; or 12.5% if we interpret the ‘don't knows’ and missing responses as ‘No’) clearly shows that payment in-kind (in terms of labour contribution) avoids the cash constraints observed in similar CV studies in developing countries that have asked for WTP in monetary terms (e.g. Brouwer et al. Citation6, for flooding in Bangladesh).
To differentiate between protest zeros and real zeros, those who said ‘No’ to contributing labour (71 respondents) and those who said ‘Don't know’ or did not answer the question (18 respondents), which implies a zero WTP/WTC, were asked to state the most important reason for not contributing. Only reason No. 3 in (‘I do not believe that the government will implement this plan’), which 1% stated as their reason for their zero response, can be viewed as a protest zero answer. Thus, 99% of the zero answers could be viewed as ‘real zeros’, indicating that the CV scenario worked well. Note, however, that it is uncertain whether any of the 18 respondents who did not provide a reason were protesters or not. To avoid overestimating WTC, we will assume that all who said ‘No’ to contributing have a real zero WTC/WTP.
Table 3. The most important reason why respondents were not willing-to-contribute (WTC) labour to the flood protection program (N=89)
The main reasons for ‘No’ responses are ‘I cannot afford to participate’ (i.e. budget constraints), and the category ‘other reasons’ which includes responses like old age, lack of labour, weak health, no time, and small children. These responses indicate that even if people could be willing to pay or contribute labour, their ability to pay or work prohibit them from expressing their preferences if they had average income and ability to work. This highlights the underlying assumption in welfare economics and cost-benefit analysis that the elicited values are based on the assumption of an even distribution of wealth, both in terms of income and health (permitting people to work). Even if asking WTC labour instead of WTP avoids this underlying assumption in the case of skewed income distribution, poor health and or old age could still limit people from stating their ‘true’ preferences in labour terms.
In the second WTC question, respondents who were willing to contribute were asked to state the highest number of person-days their household would be willing to contribute annually. The results showed that on average, these households were willing to contribute 7.73 person-days per year (with a minimum of 1 day and a maximum of 48; Standard deviation=5.59).
These households were then asked to state the most important reason why they were willing to contribute labour. shows that only about one third of the households would do it for the benefit of their own household, while about half would do so for altruistic reasons. However, because respondents were only stating their most important reason, we believe that this latter group would do so for their own household in addition to the altruistic motive.
Table 4. The most important reason why respondents would be willing to contribute (WTC) labour to the flood protection program (N=617)
The open-ended WTC question asked respondents about the highest number of person-days they would contribute rather than go without the scenario. Since respondents lack experience in answering this type of question, it could be subject to a variety of ambiguous responses like stating ‘zero’ to protest the CV scenario or stating a very high amount if they think it is unlikely that they would ever pay in-kind or in monetary terms Citation15. However, this CV survey asking for WTC labour, does not seem to be affected neither by protest nor strategic behaviour. Also, it is not plagued by hypothetical bias, as flood protection schemes seemed to be accepted as a plausible program to avoid future floods like the one experienced in 2007.
To calculate the mean value of households’ WTC their labour to a flood protection program, we used equation Citation1 below:1 where WTP
i
is household i's WTC labour (in number of person-days) to a flood prevention program; and T is the total number of households that participated in the contingent market (i.e. 706 households). Thus, the average number of person-days for the overall sample is 617 households×7.73 person-days and 89 households×0 person-days=6.73 person-days per household per year.
To test the construct validity of the WTP/WTC function and find the determinants of WTP/WTC, we estimated the model in equation Citation2 below.2 where z
i
is a vector of individual covariates, including income, and the random element is ɛ
i
.
The WTC function is calculated using the following formula below (equation 3).
The expected value of WTP E(y) is the sum of components for uncensored and censored cases.3 where
Pr(Uncensored) is the probability of an observation not being censored,
Pr(Censored) is the probability of an observation being censored,
E(y|y>τ) is the expected value of WTP greater than τ, and
E(y|y=τ y ) is the expected value of WTP equal to τ
A bid curve traces the effects of household characteristics on their WTP for the flood prevention program. Some respondents refused to pay any amount of money for the program. This does not mean that they do not desire flood prevention. In fact, they may think that the program is value for money, but they are unwilling to pay because they assume their money will be wasted or that other people should pay. This is a case of censored outcome. The outcome is censored because we cannot observe how much the flood prevention program is worth to a respondent who does not want to pay due to the above ‘protest’ reasons. The Tobit censored regression model, was employed in this case.
In the canonical censored regression model, the observed data y is given by:4 where
is the latent variable that is observed for values greater than τ and is censored for value less than or equal to τ.
We estimated this as a censored model (i.e. a Tobit model) because WTP i ≥0. z i (in equation 2) may include (i) demographic characteristics of the respondents (gender, age, education, and household income); (ii) flood risk attitudes towards disaster preparedness (flood experience and flood protection); (iii) labour availability as an important constraint of WTC; (iv) the exogenous flood risk exposure measured through level of flood (flooded villages vs. less-flooded ones); and (v) disutility from floods measured through self-reported physical damage costs (see next section for these results).
reports the results of the Tobit model and shows that household income was, as expected, a significant determinant of the WTC. Households with higher income had a higher WTC, all other things being equal. Other demographic and socioeconomic characteristics like age, gender, and education had no significant effect on stated WTC. Flood experience had a significant positive effect on WTC, as expected. However, avertive behaviour in terms of whether the household acted upon early warning messages or not did not significantly affect WTC. The economic value of the direct physical damage the household experienced during the 2007 floods also had no significant effect on stated WTC. This finding is contrary to what we expected. Household labour availability had a significant positive effect on WTC, as expected. Household having more labour available, had higher WTC; again all other things being equal. Households that lived in the flooded villages had significantly higher WTC labour to the flood prevention program than the less-flooded villages; also as expected. Overall, most determinants of WTC came out as expected Thus, the model showed a high degree of construct validity, confirming that the in-kind payment vehicle of WTC worked very well in this context.
Table 5. Tobit regressions of willingness-to-contribute (WTC) labour for flood protection programs. *, **, and *** means significantly different from zero at the 10, 5, and 1% levels, respectively
Economic value of direct physical damages caused by the 2007 floods
Prior to the WTP/WTC questions, households were asked to report the damages they had experienced from the 2007 floods. A total of 88% of the surveyed 706 households had experienced flooding. shows the economic value of the damages and the distribution of damages on different types of assets. The average flood damage costs per household were VND 3.8 million (about 200 US$). This amount is substantial, as it corresponds to approximately 20% of the average annual household income. The minimum damage costs were zero and the maximum VND 83.7 million (about 4,400 US$). Almost half of the economic damage costs were caused by crop and livestock loss (48%), followed by damage to residential houses and amenities (39%).
Table 6. Economic damage cost (in VND) per household due to the 2007 floods
To assess factors that affect flood damage, we formulated the following hypotheses following Brouwer et al. Citation16: (i) the very poor suffer most from being exposed to flood; (ii) households with livelihoods largely depending on natural resources experience more severe damages; and (iii) households located in flooded areas have greater damage than those located in less-flooded areas.
We tested the first hypothesis by comparing the economic flood damage of the very poor (defined as monthly household income of less than 7,000 VND), the income distribution, and the relationship between flood damage expressed in percentage of household income and income distribution. The second hypothesis was tested by looking at the relationship between flood damage and the percentage of household income coming from agricultural activities. We tested the third hypothesis by exploring the relationship between flood damage and the level of flooding.
The very poor had significantly lower economic damage resulting from the 2007 floods (mean±SD: 3,689,750±5,223,597 vs. 5,090,586±9,007,653; P=0.093), but they were more vulnerable because the flood damage made up a significantly larger portion of their annual household income (27.62%±26.48 vs. 14.06%±19.73; P<0.0001). This result is consistent with the CV survey on flooding in Bangladesh Citation16.
As expected, the economic damage to households that fully depended on natural resources like agriculture were significantly higher (5,050,280±9,608,627) than for households that were not fully dependent on agricultural activities (3,320,856±6,144,137; P=0.007). The result is closely aligned with the result of Citation14, and suggests that households’ diversification in income sources is an effective coping strategy in the event of flooding. shows that main income sources of households in the study area are agriculture (56%), industry and service (6%), and other sources (38%). Results from key informant interviews and focus group discussions show that many local farmers are engaged in non-farm activities such as working part-time as construction workers or migrated to the big cities to work there during times of the year prone to flooding. The income from these jobs is less sensitive to weather and climate.
Damage costs of households located in flooded areas were not significantly different from damage costs in less-flooded areas. This finding may be due to the fact, among other things, that this flood was not an average annual flood but an extreme event in the study area.
Also, the total damage costs of the group of households that acted upon an early warning message for the 2007 floods (4,469,055 VND) was not significantly different from the damage costs of the group of households that did not (1,606,923 VND; P=0.212). This suggests that public early warning systems do not reduce direct economic damages, but they might still reduce the number of lives lost. This also suggests that traditional coping mechanisms are not effective in the context of extreme disasters. From key informant interviews it appears that in the past floodwater quickly drained away through the network of rivers and canals. However, in recent years, the expansion of road network and other infrastructure investments have lead to higher flood levels. In addition, the increasing degradation of natural environment, and the conversion of agricultural land to urban areas have made the impact of flood more serious and lasting longer in lowland areas. Local people lack the experience to deal with these new risks, and as a result extreme loss and damage occur.
Comparing WTC labour and reported physical damage costs
We have two independent measures of estimating total economic damage costs per household from the 2007 floods: (i) their reported economic damage costs, and (ii) their reported WTC labour to avoid a similar type flood in the future (i.e. in the next 10 years, as the 2007 floods can be considered a 10-year flood). We would expect the WTC measure to yield a higher value because the respondents were asked to consider both their physical damages and their losses in health and well-being when stating their WTC labour to the flood alleviation project.
To convert the WTC labour to a monetary measure, we need an estimate of their opportunity cost of labour time; i.e. what the household would be able to earn if they did not contribute labour to the flood alleviation project. Households in our sample were on average willing to contribute 6.73 person-days per year (this average includes those who were not willing to contribute labour). The WTC question does not state the number of years it is necessary to contribute labour, but if we consider this a 10-year flood and assume the households were willing to contribute this amount of labour annually over 10 years (which is plausible because the previous large flood in the area was almost 10 years ago, in 1999), this amounts to 67.3 person-days per household over a 10-year period (for simplicity assuming a discount rate of zero as we do not know how households discount labour contribution over time). In this area, the average wage rate for hired agricultural labour is about 50,000 VND per person-days and about 100,000 VND for non-farm work. For most households, farm work would be their alternative, and the mean opportunity cost of time would thus probably be closer to 50,000 than 100,000 VND per person-day. Because some people would have an opportunity cost of their time closer to zero because there is no work to find or work to do on their own farm, 50,000 VND/person-day is probably a realistic estimate for the opportunity cost of time. However, there is uncertainty about what the correct mean opportunity cost of labour is for the overall population affected by the floods.
Multiplying this value by the number of person-days gives a mean economic damage cost per household of the 2007 floods equal to 3,365,000 VND. This can be compared to their reported mean economic damage costs from direct physical damage, which was 3,816,105 VND/household (see ). Even though the WTC approach did not yield higher damage costs as expected, the estimates are above the same magnitude, indicating an economic damage cost of about 200 US$/household from the 2007 floods. The reason the WTC approach did not provide a higher estimate is probably that people were thinking mostly of their direct physical damage costs, which they reported just prior to the WTC question. Thus, they did probably not include their losses in health and well-being. Another reason could be that we have used a too low opportunity cost of labour. If we had used the non-farm wage rate, our damage estimate would be double, and clearly exceed the physical damage costs. Also, peoples’ constraints with regards to available labour could have limited some of the respondents. People could also have found it difficult to assess their loss in health and well-being from the floods and did not include it in their WTC estimate for that reason. Thus, if we use our first total WTC estimate, the loss in health and well-being is probably not included. Health impacts from floods should then be added by valuing separately the recorded number of cases of injuries and flood-related illnesses combined with monetary estimates of these impacts. We do not expect people to include the economic value of lives lost in their WTC estimate; as we have not asked explicitly them to do this and these costs are too large for people to express in terms of labour provided. The mortality costs could be added by multiplying the recorded number of deaths with an estimate for the value of a statistical life for Vietnam (VSL) which could easily be in the order of 1 million US $ or more per prevented fatality, e.g. Citation17 for a global review of stated preference studies of (VSL). Adding morbidity and mortality cost separately, of course, depends on the availability of economic values for such mortality and morbidity impacts in Vietnam. If such estimates do not exist, another possibility is transfer of values from studies in other countries in the area using benefit transfer techniques; e.g. Citation18, Citation19.
Conclusion
Two independent measures of economic damage costs of the 2007 floods in Quang Nam province in Vietnam showed the same estimate of approximately 200 US$ per household, which constitutes 20% of the average household income in the area. Econometric models and hypothesis testing of the two measures, WTC labour and reported direct physical damage, confirm the validity of both approaches.
To obtain an order of magnitude estimate of the overall physical damage costs to all households in the Quang Nam province, we multiplied the average damage costs per household of 200 US$ by the number of flooded households in the area. According to provincial damage reports (9), roughly 75% of the 1.4 million people (about 347,570 households, based on our mean number of household members equal to 4.08; see ) in the province were affected by the floods directly through inundation of their dwellings and/or agricultural areas or through related events such as flash floods or landslides. The direct physical damage to all affected households in the Quang Nam province, which would be 350,000×0.75=262,500 households, was thus 53 million US$. We also have to assume that the sample is representative for all households in the province in terms of the proportion of flooded versus less-flooded households, their socioeconomic characteristics, and all other factors affecting their WTC labour and physical damages experienced. This assumption is plausible given our sampling procedure and large sample size of 706 households.
This damage cost estimate is about half the official physical damage cost estimate of 100 million US$ (9). It is important to note that the damage cost estimated by the local government includes both public infrastructure damages and damage to households. The official damage estimates tend to focus on public damages such as public buildings, roads, irrigation systems, communication systems, electricity systems, and schools. Damages to households usually constitute a smaller part and include damages to private houses, assets, and agriculture. The damage estimate from our study does not, however, include damaged public infrastructure. Because we lack information about how large a portion of the official estimate are damages to households, we cannot directly compare the two findings. However, if we assume a distribution of public versus private household costs of the official estimate similar to the distribution found for the 2007 flood in Thua Thien in the Hue province, only 30% of the official damage estimate is due to household damages (Citation20). Thus, our study indicates that official damage estimates underestimate damage costs to households. Because the official damage estimate does not include the economic value of lost lives, injuries, and flood-related illnesses; and our study probably do not reflect this fully either, this underestimation is likely even greater than this comparative analysis suggests. Thus, existing official damage cost assessments for floods and other natural disasters in Vietnam, where households have little or no insurance, clearly underestimate the total economic damage costs of these events. This underestimation of damage costs could lead to underinvestment in measures to avert, reduce, or adapt to the impacts from natural disasters.
The study also confirms that poor households are more vulnerable to floods; as households with livelihoods depending on natural resources such as agriculture and fisheries are more affected by floods. Thus, generation of non-agricultural jobs to achieve livelihood diversification would reduce the physical damages and the vulnerability of poor households. This is likely to become more important as the increased frequency and magnitude of extreme events expected from climate change will put the traditional coping mechanisms under pressure.
Our economic analysis have shown that the social benefits in terms of avoided damage costs by alleviating the impacts of floods are larger than originally thought, and the benefits could increase over time due to climate change, Thus, the main policy recommendation to local communities and national authorities is that more resources should be spent on averting and adaptive measures to effectively cope with floods and other natural disasters.
Conflict of interest and funding
The authors have not received any funding or benefits from industry to conduct this study.
Acknowledgements
This paper is based on a case study conducted under the project MICRODIS (Integrated Health Social and Economic Impacts of Extreme Events: Evidence, Methods and Tools. Contract No. GOCE-CT-2007-036877). We would like to thank the European Commission and their 6th Framework Program for Research for funding the project. For their helpful comments and suggestions, we would also like to thank two anonymous referees, our partners at the MICRODIS project, and the participants of the Microdis Symposium ‘Health and Health System Impacts of Natural Disasters’ at the Institute of Public Health, Heidelberg, November 18–19, 2010.
Related Research Data
References
- Guha-Sapir D, Hargitt D, Hoyois P. Thirty years of natural disasters 1974–2003: the numbers. UCL Press, Louvain Catholic University. LouvainBelgium, 2000
- MoNRE (Ministry of Natural Resources and Environment). Vietnam: Initial National Communication, under the United Nations Framework Convention on Climate Change. Hanoi., Vietnam, 2003. Available from: http://unfccc.int/resource/docs/natc/vnmnc01.pdf.
- SRV. National strategy for natural disaster prevention, response and mitigation to 2020. HanoiVietnam: Socialist Republic of Vietnam. 2007.
- Tuan TH, The BD. Natural disasters in Vietnam: a synthesis from a socio-economic perspective. In: Guha-Sapir D, Santos I. The economic impact of natural disasters. Oxford: Oxford University Press. in press, pp. 179–198.
- Daun MC. Flood risk and contingent valuation willingness to pay studies: a methodological review and applied analysis, Technical Report, No. 6. Institute for Urban Environmental Risk Management, Marquette University. Milwaukee WI, 2000
- Brouwer R, Akter S, Bbrander L, Haque E. Economic valuation of flood risk exposure and reduction in a severely flood prone developing country. Environ Dev Econ. 2008; 14: 397–417. 10.3402/gha.v5i0.17609.
- CRED-EMDAT. Database of natural disasters in Vietnam. BrusselsBelgium: CRED-EMDAT, Université Catholique de Louvain. 2010.
- Quang Nam PC. Annual report on socio-economics of Quang Nam province (Bao cao Kinh te – xa hoi nam 2007 va Ke hoach thuc hien cac muc tieu nam 2008 cua UBND tinh Quang Nam). Quang Nam People Committee. 2008
- Quangnam Statistical Office. Quangnam Statistical Yearbook 2007. Statistical Publishing House. 2008.
- Clark DE, Novotny V, Grifin R, Booth D, Bartosova A, Daun MC, et al.. Willingness to pay for flood and ecological risk reduction in an urban watershed. Water Sci Technol. 2002; 45: 235–42.
- Zhai G. Public preference and willingness to pay for flood risk reduction. A better integrated management of disaster risks: toward resilient society to emerging disaster risks in mega-cities. Ikeda S, Fukuzono T, Sato TTERRAPUB. Tokyo, 2006; 57–87.
- Georgiou S, Whittington D, Pearce DW, Moran D. Economic values and the environment in the developing world. Edward Elgar. CheltenhamUK, 1997
- Brouwer R, Bateman IJ. The temporal stability and transferability of models of willingness to pay for flood control and wetland conservation. Water Resour Res. 2005; 41: W03017.10.3402/gha.v5i0.17609.
- Whittington D. Administering contingent valuation surveys in developing countries. World Dev. 1998; 26: 21–30. 10.3402/gha.v5i0.17609.
- Haab TC, McConnell KE. Valuing environmental and natural resources—the econometrics of non-market valuation. Edward Elgar Publishing. CheltenhamUK, 2002
- Brouwer R, Akter S, Brander L, Haque E. Socio-economic vulnerability and adaptation to environmental risk: a case study of climate change and flooding in Bangladesh. Risk Anal. 2007; 27: 313–26. 10.3402/gha.v5i0.17609.
- Lindhjem H, Navrud S, Braathen NA, Biausque V. Valuing lives saved from environment, transport and health policies. A meta analysis. Risk Anal. 2011; 31: 1381–1407. 10.3402/gha.v5i0.17609.
- Ready R, Navrud S. International benefits transfer: methods and validity tests. Ecol Econ. 2006; 60: 429–34. 10.3402/gha.v5i0.17609.
- Navrud S, Ready REnvironmental value transfer: issues and methods. DordrectThe Netherlands: Springer. 2007.
- Thua Thien Hue People Committee. Report on flood situation in Thua Thien Hue in 2007 (Bao cao Tinh hinh Lu lut o Thua Thien Hue nam 2007 cua UBND tinh Thua Thien Hue). Thua Thien Hue People Committee. 2007.