Abstract
Background : Many studies have established a link between weather (primarily temperature) and daily mortality in developed countries. However, little is known about this relationship in urban populations in sub-Saharan Africa.
Objectives : The objective of this study was to describe the relationship between daily weather and mortality in Nairobi, Kenya, and to evaluate this relationship with regard to cause of death, age, and sex.
Methods : We utilized mortality data from the Nairobi Urban Health and Demographic Surveillance System and applied time-series models to study the relationship between daily weather and mortality for a population of approximately 60,000 during the period 2003–2008. We used a distributed lag approach to model the delayed effect of weather on mortality, stratified by cause of death, age, and sex.
Results : Increasing temperatures (above 75th percentile) were significantly associated with mortality in children and non-communicable disease (NCD) deaths. We found all-cause mortality of shorter lag of same day and previous day to increase by 3.0% for a 1 degree decrease from the 25th percentile of 18°C (not statistically significant). Mortality among people aged 50+ and children aged below 5 years appeared most susceptible to cold compared to other age groups. Rainfall, in the lag period of 0–29 days, increased all-cause mortality in general, but was found strongest related to mortality among females. Low temperatures were associated with deaths due to acute infections, whereas rainfall was associated with all-cause pneumonia and NCD deaths.
Conclusions : Increases in mortality were associated with both hot and cold weather as well as rainfall in Nairobi, but the relationship differed with regard to age, sex, and cause of death. Our findings indicate that weather-related mortality is a public health concern for the population in the informal settlements of Nairobi, Kenya, especially if current trends in climate change continue.
Climate change arising from human activity has been acknowledged as both an environmental and public health concern. The World Meteorological Organization (WMO) estimates that globally averaged temperatures in 2011 were 0.40°C above the 1961–1990 annual average of 14°C. East Africa was the sixth-warmest region at 1.17°C above normal Citation1. There is growing evidence that an increase in temperature is associated with short-term increase in morbidity and mortality in several cities across the world Citation2–Citation6. However, a warmer climate could also correspond to decreases in cold-related mortality, although this has recently been questioned Citation7. To date, the extent to which cold-related mortality is a problem in East Africa has hardly been explored in the literature. The groups most vulnerable to increasing temperatures are older people and those with pre-existing conditions, such as cardiovascular and respiratory illnesses Citation3 Citation5. Some studies have also found that children aged below 5 years are vulnerable as well Citation8. The effect of rising temperatures is amplified in urban areas where ambient temperatures are compounded by the interaction between air pollution and temperature, the ‘urban heat island effect’ Citation3, and urban sprawl Citation9.
The developing world is rapidly urbanizing and estimates show that urban centers will house about 60% of the global population by 2030, with major growth occurring in developing countries. Because of rapid urbanization in periods of poor economic performance, slum settlements are set to increase and population estimates indicate that 41% of global urban population will reside in slums by year 2030 Citation10. Poor housing characterized by temporary structures is a common feature of slum settlements with most ill-equipped to deal with any adverse events associated with climate change. In addition, increasing urban poverty consigns slum residents to live on the edge with little or no resources to deal with climate-change-related events, including sudden onset of ill health brought on by extreme high or low temperatures Citation11 Citation12.
Most studies on temperature-related mortality have been conducted in temperate regions, but little is known about this relationship in developing countries, especially in sub-Saharan Africa. Most sub-Saharan countries lack reliable health outcome data to enable analysis of the impact of weather factors on health. Health Demographic Surveillance Systems (HDSS) provide an opportunity for analyzing the impact of weather on health by providing longitudinal mortality data that allow for time-series analysis. This study investigates:
the existence of a seasonal pattern in mortality in the Nairobi population,
the relationship between daily mortality and weather variables (temperature and rainfall), and
the association between weather and mortality by age, gender, and cause of death.
Overall, this study facilitates a better understanding of weather-related mortality patterns in sub-Saharan Africa and, to the best of our knowledge, the study is the first to explore the weather–mortality linkage for an urban population in Kenya.
Materials and methods
Study area and population
The study area covered two informal settlements of Korogocho and Viwandani in Nairobi, which are covered by the Nairobi Urban Health and Demographic Surveillance System (NUHDSS) run by the African Population and Health Research Center. The population under surveillance as on 31 December 2008 was 60,416 individuals from 24,875 households. The study area was characterized by overcrowding, poor sanitation, and poor access to basic health care services. The population in the NUHDSS was mostly youth drawn to the city by the job opportunities Citation13. The health of the population under surveillance was characterized by high prevalence of infectious diseases and an increasing burden of non-communicable diseases (NCDs). Among the under-five population, diarrheal diseases, perinatal causes, and pneumonia were the leading causes of mortality, whereas HIV and tuberculosis were the major causes of mortality among the population aged five and above Citation14.
Nairobi city is situated about 1,700 meters above sea level, giving the city a sub-tropical climate. The average daily minimum and maximum temperatures is 11°C and 26°C, respectively. In Nairobi, there are two rainy seasons in a year with the long rainy season from March to May and the short rainy season from October to December. The period from June to August is typically dry and cold, with daily minimum and maximum temperatures reaching 10°C and 21°C, respectively, whereas September, January, and February are hot and dry with daily maximum temperature of 24°C Citation15 Citation16.
Data
Daily mortality data for the study period 2003–2008 was obtained from routinely collected data by the NUHDSS. The analyses were carried out within four age groups: 0–4, 5–19, 20–49, and over 50 years. Age fifty was used as a lower threshold of old age in sub-Saharan Africa based on life expectancy and biomarkers of ageing and the social construction Citation17 Citation18. Ascertaining cause of death at NUHDSS was done through the verbal autopsy procedure, which is based on recollections of the deceased person's close relative/caregiver, with the most detailed and credible information regarding the circumstances leading to the death of the individual. Where a close relative or household member cannot be found either due to family relocation after the death or because the deceased lived alone, a credible neighbor is interviewed. Two physicians reviewed verbal autopsy records and when they both agreed on a probable cause of death, it was assigned. If they did not agree, a third physician convened a consensus meeting with the other two, where the disagreement was discussed and if two out of the three agreed on the cause of death, it was assigned. Otherwise, it was designated as indeterminate. Causes of death were classified according to the International Classification of Diseases, 10th Revision (ICD-10) using a modified and shortened code list Citation19. A detailed description of the process is given elsewhere Citation20. Cause of death was classified into five broad categories: HIV/AIDS related, including TB, (cancer, hypertension, diabetes, and other NCDs), pneumonia, acute infections (meningitis, measles, malaria, and other acute infections) and other natural deaths (perinatal, preterm, and undetermined). For the causes that were determined, HIV/AIDs and TB were the leading causes of mortality with 25.2% of all mortality. The cause of death profile, classified into five groups, is presented in . Mortality data were broken down to daily series for analysis.
Table 1. Cause of death profiles for the study period 2003–2008
Meteorological data on temperature and rainfall were obtained from the Meteorological Department of Kenya for the period of 2003–2008. The data were obtained from the Moi Airbase weather station, situated between the two study sites and about 3 km away from each site. Weather data included daily minimum and maximum temperatures and daily rainfall. Daily average temperatures were calculated from minimum and maximum temperatures. The weather data were complete, with no missing information for the study period.
Statistical methods
We used time-series data analysis adapting the Poisson regression model to quantify the relationship between temperature, rainfall, and daily mortality. This approach compared the daily observed and expected mortality based on time trends so as to analyze the deviations from the expected mortality related to variation in the exposure variables, in this case temperature and rainfall. Rainfall was adjusted for temperature effect and vice versa. We investigated the daily weather–mortality relationship allowing for variation in mortality over time by adjusting for season and trend.
To adjust for the influence of seasonal and long-term trends, we included both long and short ‘time’ indicators in the models. The long-term trend was modeled through a natural spline curve with 3 degrees of freedom (df) per year (18 df for 6 years). The annual seasonal variation was also modeled through natural cubic splines with 3 degrees of freedom. Therefore, the combined degrees of freedom for both season and trend added to 6 df per year. Sensitivity analysis was used to assess how the estimates changed for varying degrees of freedom per year Citation21 to show the sensitivity of results to this choice as described in literature. We examined the relationship between daily deaths and mean temperature to use as baseline analysis. We then assessed the delayed effect through refitting the models using daily mean temperature on the day of death and the previous 13 days using distributed lag models with lag terms 0–1 days, 2–6 days, and 7–13 days. The delayed effect of rainfall over 30 days was assessed considering lag terms of 0–6 days, 7–13 days, 0–13 days, and 14–29 days. Stratified data analysis was conducted with regard to age groups, gender, and cause of death.
Heat and cold temperature thresholds were estimated by visually inspecting the original graph of mean temperature and comparing with different percentiles. The final generalized additive model (GAM) model was given by:
where t refers to the day of the observation; (Y
t
) denotes the observed daily death counts on day t; s(.) denotes smooth function; df denotes degrees of freedom; x
i
denotes the mean temperature at lag 0–1, rainfall at lag 0–13, and rainfall at lag 14–29; and ‘time’ represents both trend and seasonal associations.
To quantify the associations between weather and mortality in different groups of the population, the aforementioned equation was fitted separately for each stratum category of age, gender, and cause. In addition to evaluating the confidence limits and size of coefficients, the relationship was measured by a factor of 1°C for temperature and 1 inch (25 mm) for rainfall. All data management was conducted in STATA version 11 and statistical analyses were conducted using the mgcv package in R2.14.2. Quasi-Poisson family was used instead of Poisson for adjustment of over-dispersion that may partly result because of many zero counts. Quasi-Poisson does not change the estimates for the coefficients, but adjusts the standard errors to account for over-dispersion.
Results
Description
The distribution of mortality by cause, sex, and age for the period of 2003 to 2008 is presented in . There were 2,512 non-accidental deaths during the study period (excluding deaths due to injuries). The proportion of deaths among children younger than five years was 33.7%, whereas older persons (50+ years) accounted for 13.9% of deaths. People aged between 5 and 19 accounted for about 5% of the deaths and because of this small proportion, it was combined with deaths among people aged between 20 and 49 (whose proportion was 47.2%).
Table 2. Distribution of mortality by age, gender, and cause of death
Summary statistics for weather variables over the study period indicate that the average daily mean temperature was 18.8°C (SD = 1.7). The average daily minimum temperature was 13.5°C and the average daily maximum temperature was 23.4°C. During this period, the lowest temperature experienced was 5.2°C and the maximum was 30.7°. The daily average temperature range was 10.3°C with the highest difference of 19.9°C. The highest amount of rainfall was 99.7 mm observed in the year 2007 and on rain-days the average amount of rainfall was 8.2 mm.
Seasonal variability of weather and mortality
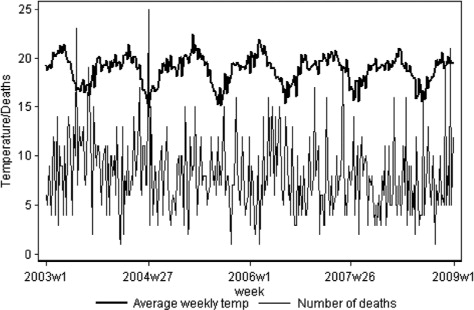
Seasonal variation in all-cause mortality and mean temperature for the period 2003–2008 is shown in . Overall, there are seasonal fluctuations in mortality, with the highest rates of death occurring during periods of relative cold, which coincides with high amounts of rainfall. In contrast to the broadly observed association between cold periods and mortality, no seasonal increase in mortality was clearly discernible from this graph during periods of highest temperature.
Fig. 1. Seasonal distribution of all-cause (weekly) mortality and temperature (°C).
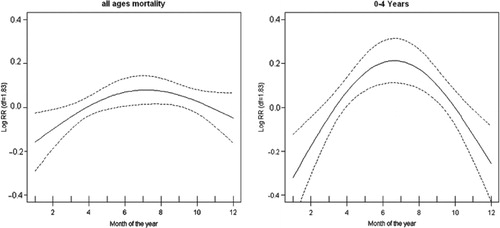
There was no strong seasonal pattern observed for mortality among the ages 5–49 and 50+ years except for under-five mortality. The two plots for seasonal mortality, all-age and under-five, are shown in . We observed a similar pattern for the two plots, but a strong seasonal pattern is observed for under-five mortality. This result implies that the seasonal pattern observed for all-age mortality was driven mainly by the under-five deaths. High mortality was observed during the month of June to July, the period corresponding to low temperatures. The plots show that mortality risk over the year rises from the lowest mortality risk by about 40% in the 0–4 age group and by about 20% for all ages. These estimates are obtained by exponentiation of the values of log relative risk shown in .
Fig. 2. Annual seasonal variation plots for all-age and under-five mortality. The vertical axes show the log (relative risk) and the horizontal axis show the month starting with January. Confidence intervals (95%) are shown as dotted lines.
Temperature and rainfall mortality plots
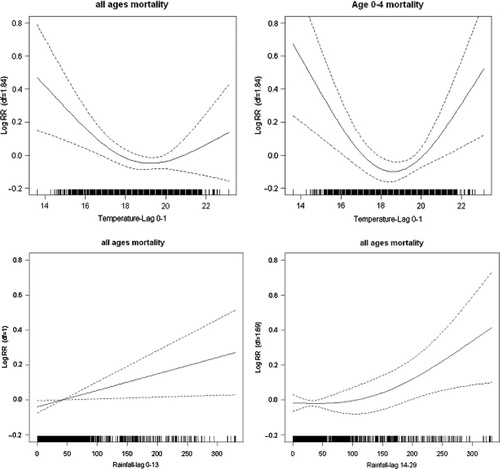
The graphs in show smoothed plots of log relative risk of mortality against the mean of the current and previous day's temperature. The graphs reveal non-linear temperature–mortality relationships. From the figure, it is evident that a threshold temperature exists somewhere between 18°C and 20°C for all-age mortality. These thresholds from the initial graphical inspection revealed cold and heat threshold corresponding to 25th and 75th percentiles, respectively. The actual daily average temperatures corresponding to 25th and 75th percentiles were 17.9°C and 20°C, respectively. These thresholds were used for all subsequent analysis for quantifying the relationship between temperature and mortality as linear functions. The pattern of temperature and mortality association exhibits J-shape for all-ages mortality and U-shape for under-five mortality. The negative association was observed for the temperature range below the 25th percentile threshold of 17.9°C, whereas a positive association existed for the temperature range above the 75th percentile threshold of 20°C. The slopes for under-five were steeper than for all mortality but both non-linear relationships were statistically significant at lag 0–1. This relationship implies that decrease or increase from the average daily temperature was associated with increase in mortality. The smooth function of the relationship between rainfall and mortality shows a linear increase, significant at lag of 0–13 days and 14–29 days for all-cause mortality. These associations are also illustrated in .
Fig. 3. Smooth functions of temperature for all and under-five mortality, and rainfall for all ages allowing lags of 0–13 days and 14–29 days. The vertical axes show the log (relative risk) and the horizontal axis show the scale of the explanatory variable. Confidence intervals (95%) are shown as dotted lines.
Quantification of weather–mortality relationships
shows the results of a quantified relationship varied by age, gender, and cause of death. The results show no significant relationship for high temperature on all mortality, but significant positive relationship for high temperatures is observed in deaths in the 0–4 age group and among people with NCD. Low temperatures were associated with mortality of varying magnitude by age, gender, and cause of death though none of the relationships was statistically significant. There was an increase of 13% in deaths due to acute infections associated with decrease in temperature but this was not statistically significant. Deaths among males and people aged 50+ were associated with low temperatures though these relationships were not statistically significant. It was also observed that rainfall was significantly associated with female NCDs and pneumonia deaths. Cumulatively, mortality increased by 3% for 1 inch (25 mm) increase in the amount of rainfall and this relationship was statistically significant. There was also an increase of 5% in female mortality for 1 inch (25 mm) increase in rainfall after 2 weeks and this increase was statistically significant. The relationship of rainfall to NCDs and pneumonia accumulated over 1 month was 12% and 24%, respectively, and this was statistically significant.
Table 3. Percentage change associated with 1°C decrease in temperature below 25th percentile, 1°C increase in temperature above 75th percentile and 25.4 mm (1 inch) increase in amount of rainfall
Sensitivity analysis
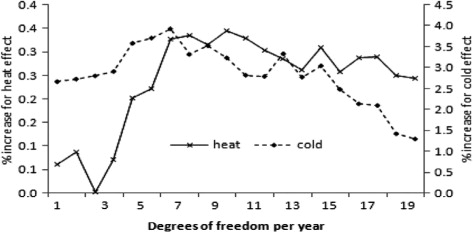
illustrates a sensitivity analysis of the percentage increase in mortality for a decrease or an increase in temperature of 1°C at lag 0–1 for both cold and heat effects with respect to the number of degrees of freedom assigned to the smooth function of time per year. The figure shows the change in the temperature-associated coefficient as the degree of freedom is varied. The different axes are used for cold and heat correlations because of the difference in the magnitude of the effect on the percentage change on mortality. When using natural splines, the estimates reach the maximum when degree of freedom is about six per year. This implies that a choice of degrees of freedom lower or higher than this optimal value will lead to over- or under-estimation of the effect of weather variables.
Fig. 4. Sensitivity analyses, with increasing degrees of freedom, of the percentage increase in mortality for an increase in temperature of 1°C at lag 0–1 days for both cold and heat effects. The left vertical axis shows the heat effect and right vertical axis shows cold effect in percentages.
Discussion
The aim of this study was to assess the relationship between daily weather and mortality in two informal settlements in Nairobi, Kenya. The findings show a relationship between both low and high temperature with mortality. The observed linear associations between temperatures below 25th percentile were not statistically significant. Increase in temperature above the 75th percentile showed statistically significant but moderate increases in mortality in children/infants and for NCDs. The lack of significance for the relationship between cold temperature and mortality may be due to low daily death counts resulting in high variability or due to the particular thresholds chosen since some of the non-linear curves were significant. The results also show strong statistically significant positive relationships between rainfall and mortality, with cumulative lagged effect over 30 days in the following groups: all ages, NCDs, and pneumonia.
The temperature-related mortality was observed with a short lag of the same day and the following day. The low temperature effect could be explained by the high elevation of the city, resulting in a sub-tropical (almost temperate) climate, which is cool almost all year round, with no temperature extremes reported so far. It is plausible therefore that a cold effect can be found in this kind of climate where temperature extremes on the cold scale have been reported, especially at nighttime, and housing lacks insulation or proper heating, with natural heating fuels being limited or relatively expensive. The low temperatures may be associated with use of various fuels to generate warmth increasing exposure to indoor pollution. Commonly used fuel types by the residents in the two study areas are kerosene and charcoal, which are the main sources of indoor air pollutants. This may be a probable explanation for the association of low temperatures with mortality. Our results are in line with previous findings assessing weather-related mortality. Other studies in temperate countries have reported increased mortality associated with cold waves Citation22 Citation23. Although the temperatures in Nairobi are not fully comparable to those in the studies above, a parallel can be drawn in the increased mortality observed during cold days. Studies of temperature-related mortality in Bangladesh observed an increase in all-cause deaths at low temperatures and no clear heat effects in both rural and urban areas Citation24 Citation25.
Earlier studies focused on the effect of short temperature extremes, such as heat waves Citation26. Temperature-related mortality typically demonstrates a J or U shaped response, in which mortality rates are highest at low and high temperatures. All-cause mortality is associated with a decrease in temperature from a cold threshold Citation27–Citation30, and in this study low-temperature-related mortality was higher than high-temperature-related mortality though it was not statistically significant. The effects of low temperatures on mortality can last for days, with the greatest association sometimes observed on the same day Citation31 as observed in this study. Infectious diseases such as pneumonia and influenza are more common in the winter season in temperate countries and contribute to the observed high rates of winter mortality Citation32–Citation34. In contrast, we found that pneumonia deaths increased with high temperatures and vice versa. There was no information about influenza in this area. Respiratory tract infections are more likely to occur during periods of low temperatures and low humidity Citation35.
We also observed an association between rainfall and mortality, particularly with pneumonia deaths. Previous work showed an association between rainfall and pediatric visits for acute gastrointestinal illness Citation36. In addressing climate change, it is better to understand the rainfall-associated illness or mortality. Establishing the impact of rainfall on health in the absence of any outbreaks is important in public health reporting, not to underestimate rainfall-associated mortality or illness. Further studies on impact of rainfall are warranted to better understand this association and potential mechanisms as well as establish different lag effects of rainfall.
Older populations are considered particularly vulnerable to extreme weather because a person's ability to thermo-regulate can become impaired with age. Underlying chronic diseases, such as diabetes, and medications can modify blood pressure, circulation, perspiration rates, and some mental capacities such as warmth perception, thus complicating people's ability to identify when they are experiencing extreme weather Citation37. Several reports have shown that excess weather-related mortality is higher in older people Citation22 Citation38 Citation39. Infants are also often identified as a population that is vulnerable to extreme heat conditions; however, information on heat and infant mortality is scarce, with no studies reporting on cause-specific temperature-related mortality in children Citation8. In an effort to address Millennium Development Goal (MDG) 4, it is important to confirm weather-related mortality among children to understand factors contributing to child mortality. The strong association observed between temperature and mortality among children aged 0–4 years show the need of further cause-specific analysis for this age group.
Gender has been found to be associated with temperature-related mortality. Some studies have shown that women are more sensitive to cold than men, with reports showing that women living in colder climates have a higher risk of cold-related death than their male counterparts Citation27 Citation40 Citation41. We found increased cold-related mortality among men although previous work shows contrasting results. However, this could be explained by the difference in the age, culture, and behavior of the population under study. A similar finding was observed in a study among older people Citation42 though a contradicting result was also observed in a different study among older people of a similar age group Citation43. Little modification of the cold effect by sex was observed in England and Wales Citation44. We further observed a significant relationship between increasing rainfall and mortality in women, but not in men. The reason for this relationship needs to be further assessed.
In spite of an overall trend toward increasing global temperatures, climate models forecast more variable weather. This will result in important weather-related health consequences for humans. Coupling archived climatologic data with health outcome data has aided researchers Citation45 in projecting mortality rates and in this study the NUHDSS provides this opportunity. Further epidemiologic studies that incorporate archived climatological and environmental data in modeling specific health outcomes in vulnerable populations would aid adaptation to climate-change-related health effects through preparedness strategies implemented at various scales Citation37. Although the world will get warmer in the future, the low temperature-related mortality is likely to remain an important concern Citation7.
This study has a number of limitations. The first limitation relates to the validity of the causes of death based on verbal autopsy. However, verbal autopsies are at present the best possible method for obtaining information on cause-specific deaths in many low- and middle-income countries Citation46 that lack vital registration systems and where most deaths occur outside the formal health care system. Another limitation with mortality data is the large percentage of deaths with unknown or ill-defined causes, making cause-specific mortality analysis difficult. Nevertheless, the data provide a great opportunity for all-cause mortality analysis. A further limitation is the lack of data on daily levels of air pollution, which would enable the control of its health impact while assessing weather-related mortality. Low death counts may be also a limitation, resulting in large variability that renders the observed differences as not significant, although this has no significant effect on the Poisson distribution of the model we used. The adjustment to standard errors is done through quasi-likelihood estimation. Despite these limitations, the study confirms that extremes of temperature affect mortality in the Nairobi Urban HDSS and highlights seasonal variations in mortality. Further investigations of weather-related mortality are warranted.
In conclusion, we found the highest susceptibility to heat among children younger than five years and an indication of cold-related mortality among the older people. Results from stratifying effect estimates by age were consistent with earlier results based on community-level and individual-level data Citation47–Citation49. Further investigation using individual-level data is needed to improve exposure estimates, especially for longer lag structures. These findings on the impact of weather on mortality have implications for policymakers and health protection for vulnerable urban populations to weather extremes. The identified susceptible subpopulations signify the need for targeted weather-mortality prevention efforts such as proper housing and clothing.
Conflict of interest and funding
The authors have not received any funding or benefits from industry or elsewhere to conduct this study.
Acknowledgments
This research was supported by the INDEPTH Network. We thank Joacim Rocklöv, Yazoumé Yé, Rainer Sauerborn, Sari Kovats, David Hondula, and Martin Bangha who facilitated at INDEPTH workshops in Nouna, Burkina Faso, and Accra, Ghana. This work would not have been done without climate data that were provided by the Meteorological Department of Kenya and mortality data collected under the longitudinal NUHDSS. This work was partly undertaken within the Umeå Centre for Global Health Research, with support from FAS, the Swedish Council for Working Life, and Social Research (grant no. 2006-1512). We acknowledge the contributions of Dr. Alex Ezeh and Dr. Eliya Zulu to the conceptualization of the NUHDSS.
Related Research Data
References
- World Meteorological Organization. WMO statement on the status of the global climate in 2011. Geneva: World Meteorological Organization. 2012.
- Semenza JC, McCullough JE, Flanders WD, McGeehin MA, Lumpkin JR. Excess hospital admissions during the July 1995 heat wave in Chicago. Am J Prev Med. 1999; 16: 269–77. 10.3402/gha.v5i0.19065.
- Basu R, Samet JM. Relation between elevated ambient temperature and mortality: a review of the epidemiologic evidence. Epidemiol Rev. 2002; 24: 190–202. 10.3402/gha.v5i0.19065.
- Knowlton K, Rotkin-Ellman M, King G, Margolis HG, Smith D, Solomon G, et al.. The 2006 California heat wave: impacts on hospitalizations and emergency department visits. Environ Health Perspect. 2008; 117: 61–7.
- Chung J-Y, Honda Y, Hong Y-C, Pan X-C, Guo Y-L, Kim H. Ambient temperature and mortality: an international study in four capital cities of East Asia. Sci Total Environ. 2009; 408: 390–6. 10.3402/gha.v5i0.19065.
- Nitschke M, Tucker GR, Hansen AL, Williams S, Zhang Y, Bi P. Impact of two recent extreme heat episodes on morbidity and mortality in Adelaide, South Australia: a case-series analysis. Environ Health. 2011; 10: 42.10.3402/gha.v5i0.19065.
- Kinney PL, Pascal M, Vautard R, Laaidi K, Kinney PL, Pascal M, et al.. La mortalité hivernale va-t-elle diminuer avec le changement climatique? [Winter mortality in a changing climate: will it go down?]. Bull Epidémiol Hebd. 2012; 12–13: 145–51.
- Basagana X, Sartini C, Barrera-Gomez J, Dadvand P, Cunillera J, Ostro B, et al.. Heat waves and cause-specific mortality at all ages. Epidemiology. 2011; 22: 765–72. 10.3402/gha.v5i0.19065.
- Frumpkin H. Urban sprawl and public health. Public Health Reports2002; 117; 201–17.
- UN-HABITAT. Meeting the urban challenges. UN-HABITAT. 2008. Available from:http://www.pophealthmetrics.com/content/6/1/1 [cited 26 May 2012]..
- WHO. (1995). The World Health Report 1995: bridging the gaps. Geneva: World Health Organization.
- McMichael AJ. The urban environment and health in a world of increasing globalization: issues for developing countries. Bull World Health Organ. 2000; 78: 1117–26.
- Zulu EM, Beguy D, Ezeh AC, Bocquier P, Madise NJ, Cleland J, et al.. Overview of migration, poverty and health dynamics in Nairobi City's slum settlements. J Urban Health. 2011; 88(Suppl 2):185–99. 10.3402/gha.v5i0.19065.
- Kyobutungi C, Ziraba AK, Ezeh A, Ye Y. The burden of disease profile of residents of Nairobi's slums: results from a demographic surveillance system. Popul Health Metr. 2008; 6: 1.10.3402/gha.v5i0.19065.
- ‘World Weather Information Service – Nairobi’. World Meteorological Organization (UN). Available from: http://www.worldweather.org/071/c00251.htm#climate [cited 21 May 2012]..
- Government of the Hong Kong Special Administrative Region. 2012‘Climatological Normals of Nairobi’. Hong Kong Observatory. Available from: http://www.hko.gov.hk/wxinfo/climat/world/eng/africa/ken_madg/nairobi_e.htm [cited 21 May 2012]..
- Kinsella K, Phillips DR. Global aging: the challenge of success. United Nations. New York, 2005
- Ferreira M, Kowal P. A minimum data set on ageing and older persons in Sub-Saharan Africa: process and outcome. African Popul Studies. 2006; 21: 19–36.
- WHO. International Classification of Diseases (ICD). 2010World Health Organization. Available from: http://www.who.int/classifications/help/icdfaq/en/index.html [cited 3 June 2012]..
- Oti SO, Kyobutungi C. Verbal autopsy interpretation: a comparative analysis of the InterVA model versus physician review in determining causes of death in the Nairobi DSS. Popul Health Metr. 2010; 8: 21.10.3402/gha.v5i0.19065.
- Peng RD, Dominici F, Louis TA. Model choice in time series studies of air pollution and mortality. J R Stat Soc. 2006; 169: 179–203. 10.3402/gha.v5i0.19065.
- Analitis A, Katsouyanni K, Biggeri A, Baccini M, Forsberg B, Bisanti L, et al.. Effects of cold weather on mortality: results from 15 European cities within the PHEWE project. Am J Epidemiol. 2008; 168: 1397–408. 10.3402/gha.v5i0.19065.
- Kysely J, Pokorna L, Kyncl J, Kriz B. Excess cardiovascular mortality associated with cold spells in the Czech Republic. BMC Public Health. 2009; 9: 19.10.3402/gha.v5i0.19065.
- Hashizume M, Wagatsuma Y, Hayashi T, Saha SK, Streatfield K, Yunus M. The effect of temperature on mortality in rural Bangladesh – a population-based time-series study. Int J Epidemiol. 2009; 38: 1689–97. 10.3402/gha.v5i0.19065.
- Burkart K, Khan MH, Krämer A, Breitner S, Schneider A, Endlicher WR. Seasonal variations of all-cause and cause-specific mortality by age, gender, and socioeconomic condition in urban and rural areas of Bangladesh. Int J Equity Health. 2011;10: 32. Available from: http://www.equityhealthj.com/content/10/1/32 [cited 26 June 2012].10.3402/gha.v5i0.19065.
- Kynast-Wolf G, Preuss M, Sie A, Kouyate B, Becher H. Seasonal patterns of cardiovascular disease mortality of adults in Burkina Faso, West Africa. Trop Med Int Health. 2010; 15: 1082–9.
- The Eurowinter Group. Cold exposure and winter mortality from ischaemic heart disease, cerebrovascular disease, respiratory disease, and all causes in warm and cold regions of Europe. The Eurowinter Group. Lancet. 1997; 349: 1341–6.
- Donaldson GC, Keatinge WR. Cold related mortality in England and Wales; influence of social class in working and retired age groups. J Epidemiol Community Health. 2003; 57: 790–1. 10.3402/gha.v5i0.19065.
- Diaz J, Garcia R, Lopez C, Linares C, Tobias A, Prieto L. Mortality impact of extreme winter temperatures. Int J Biometeorol. 2005; 49: 179–83. 10.3402/gha.v5i0.19065.
- McMichael AJ, Wilkinson P, Kovats RS, Pattenden S, Hajat S, Armstrong B, et al.. International study of temperature, heat and urban mortality: the ‘ISOTHURM’ project. Int J Epidemiol. 2008; 37: 1121–31. 10.3402/gha.v5i0.19065.
- Braga AL, Zanobetti A, Schwartz J. The time course of weather-related deaths. Epidemiology. 2001; 12: 662–7. 10.3402/gha.v5i0.19065.
- Kunst AE, Looman CW, Mackenbach JP. Outdoor air temperature and mortality in The Netherlands: a time-series analysis. Am J Epidemiol. 1993; 137: 331–41.
- Langford IH, Bentham G. The potential effects of climate change on winter mortality in England and Wales. Int J Biometeorol. 1995; 38: 141–7. 10.3402/gha.v5i0.19065.
- Martens WJ. Climate change, thermal stress and mortality changes. Soc Sci Med. 1998; 46: 331–44. 10.3402/gha.v5i0.19065.
- Makinen TM, Juvonen R, Jokelainen J, Harju TH, Peitso A, Bloigu A, et al.. Cold temperature and low humidity are associated with increased occurrence of respiratory tract infections. Respir Med. 2009; 103: 456–62. 10.3402/gha.v5i0.19065.
- Drayna P, McLellan SL, Simpson P, Li S-H, Gorelick MH. Association between rainfall and pediatric emergency department visits for acute gastrointestinal illness. Environ Health Perspect. 2010; 118: 1439–43. 10.3402/gha.v5i0.19065.
- Conlon KC, Rajkovich NB, White-Newsome JL, Larsen L, O'Neill MS. Preventing cold-related morbidity and mortality in a changing climate. Maturitas. 2011; 69: 197–202. 10.3402/gha.v5i0.19065.
- Curriero FC, Heiner KS, Samet JM, Zeger SL, Strug L, Patz JA. Temperature and mortality in 11 cities of the eastern United States. Am J Epidemiol. 2002; 155: 80–7. 10.3402/gha.v5i0.19065.
- Monacelli F, Aramini I, Odetti P. For debate: the August sun and the December snow. J Am Med Dir Assoc. 2010; 11: 449–52. 10.3402/gha.v5i0.19065.
- Wilkinson P, Pattenden S, Armstrong B, Fletcher A, Kovats RS, Mangtani P, et al.. Vulnerability to winter mortality in elderly people in Britain: population based study. BMJ (Clinical research ed.). 2004; 329: 647.10.3402/gha.v5i0.19065.
- Rudge J, Gilchrist R. Excess winter morbidity among older people at risk of cold homes: a population-based study in a London borough. J Pub Health. 2005; 27: 353–8. 10.3402/gha.v5i0.19065.
- Macey SM, Schneider DF. Deaths from excessive heat and excessive cold among the elderly. Gerontologist. 1993; 33: 497–500. 10.3402/gha.v5i0.19065.
- Wilkinson P, Landon M, Armstrong B, Stevenson S, Pattenden S, McKee M, et al.. Cold comfort: the social and environmental determinants of excess winter deaths in England, 1986–1996. Joseph Rowntree Foundation. York, 2001
- Hajat S, Kovats RS, Lachowycz K. Heat-related and cold-related deaths in England and Wales: who is at risk?. Occup Environ Med. 2007; 64: 93–100. 10.3402/gha.v5i0.19065.
- Morabito M, Crisci A, Vallorani R, Modesti PA, Gensini GF, Orlandini S. Innovative approaches helpful to enhance knowledge on weather-related stroke events over a wide geographical area and a large population. Stroke. 2011; 42: 593–600. 10.3402/gha.v5i0.19065.
- Quigley MA. Commentary: verbal autopsies – from smallscale studies to mortality surveillance systems. Int J Epidemiol Commun Health. 2005; 34: 1087–8.
- Kalkstein LS, Davis RE. Weather and human mortality: an evaluation of demographic and interregional responses in the United States. Ann Assoc Am Geogr. 1989; 79: 44–64. 10.3402/gha.v5i0.19065.
- Stafoggia M, Forastiere F, Agostini D, Biggeri A, Bisanti L, Cadum E, et al.. Vulnerability to heat-related mortality: a multicity, population-based, case-crossover analysis. Epidemiol. 2006; 17: 315–23. 10.3402/gha.v5i0.19065.
- Kaiser R, Le Tertre A, Schwartz J, Gotway CA, Daley WR, Rubin CH. The effect of the 1995 heat wave in Chicago on all-cause and cause-specific mortality. Am J Public Health. 2007; 97: S58–62. 10.3402/gha.v5i0.19065.