Abstract
Background : Weather and climate changes are associated with a number of immediate and long-term impacts on human health that occur directly or indirectly, through mediating variables. Few studies to date have established the empirical relationship between monthly weather and mortality in sub-Saharan Africa.
Objectives : The objectives of this study were to assess the association between monthly weather (temperature and rainfall) on all-cause mortality by age in Rufiji, Tanzania, and to determine the differential susceptibility by age groups.
Methods : We used mortality data from Rufiji Health and Demographic Surveillance System (RHDSS) for the period 1999 to 2010. Time-series Poisson regression models were used to estimate the association between monthly weather and mortality adjusted for long-term trends. We used a distributed lag model to estimate the delayed association of monthly weather on mortality. We stratified the analyses per age group to assess susceptibility.
Results : In general, rainfall was found to have a stronger association in the age group 0–4 years (RR=1.001, 95% CI=0.961–1.041) in both short and long lag times, with an overall increase of 1.4% in mortality risk for a 10 mm rise in rainfall. On the other hand, monthly average temperature had a stronger association with death in all ages while mortality increased with falling monthly temperature. The association per age group was estimated as: age group 0–4 (RR=0.934, 95% CI=0.894–0.974), age group 5–59 (RR=0.956, 95% CI=0.928–0.985) and age group over 60 (RR=0.946, 95% CI=0.912–0.979). The age group 5–59 experienced more delayed lag associations. This suggests that children and older adults are most sensitive to weather related mortality.
Conclusion : These results suggest that an early alert system based on monthly weather information may be useful for disease control management, to reduce and prevent fatal effects related to weather and monthly weather.
Weather and climate changes are likely to have adverse effects on human health, particularly among the most vulnerable populations Citation1. Their effects can be both direct, through extreme events and changes in the disease environment, and indirect through their impact on the economic livelihood of the population Citation1 Citation2. The World Health Organization (WHO) estimated that the warming and rainfall trends due to anthropogenic climate change of the past 30 years already claim over 150,000 lives annually Citation3. In most cases the poorer regions are highly vulnerable Citation4. Of the 14 million deaths that occurred in Southeast Asia annually, 40% are attributable to communicable diseases Citation5. Increased average temperatures could prolong peak periods for vector-borne diseases Citation6 and extreme weather events such as cyclones and floods can create ideal conditions for the spread of vector-borne and diarrheal diseases such as cholera Citation7. Malaria is the most important vector-borne disease related to climate change in the world; it is also a preventable disease. About 40% of the world's population is at risk of contracting malaria, and roughly 75% of cases occur in Africa, with the remainder occurring in Southeast Asia, the western Pacific, and the Americas Citation8. In sub-Saharan Africa, malaria remains the most common parasitic disease and is the main cause of morbidity and mortality among children less than 5 years of age, elderly people, and among pregnant women Citation9. The estimates provided by Murray and Lopez (1996) suggested that malaria caused about 15% of deaths of children under the age of 5 years in sub-Saharan Africa in 1990. However, children are highly affected by weather and climate by virtue of their early stages of development, while a study done in Kenya in 2008, revealed that climate change has emerged as a new driver of malnutrition and increasing the child mortality rate by 5–20 times Citation10.
Tanzania is the largest country in East Africa, covering an area of 945,200 km2, 60,000 km2 of which is inland water Citation11. Tanzania lies close to the equator on the east coast of Africa between latitude 1°S and 12°S and longitude 30°E and 40°E. By being close to the equator, the climate variations in temperature are not very extreme Citation11. Changes in temperature and rainfall resulting in changes in soil moisture, increase in sea level, and more extreme weather events, such as floods and droughts, are among the most known impacts of global climate change in the region Citation12 Citation13. The major impacts of climate change are expected to include severe floods, frequent and prolonged droughts, rising sea levels, crop failure, loss of livestock, lower water availability and quality, and an increase in vector and water-borne diseases Citation14 Citation15. However, heavy rains, flood, drought, and landslides in Tanzania have already resulted into internal displacement, food shortages, and increased disease transmissions. Drought itself has significantly contributed to malnutrition due to lack of adequate food, increased infectious disease transmission, and scarcity of clean and safe water Citation16. Landslides, droughts, and floods are becoming common in Tanzania. In recent years (2009–2011), heavy rains accompanied with strong winds have left thousands of people displaced and without food in Muleba, Kilosa, Same, and Dar es Salaam Citation17. Weather and climate change can affect human health and well-being through a variety of mechanisms Citation14 Citation15 Citation18. The risk of emerging diseases may increase due to changes and survival of pathogens in the environment, changes in migration pathways, carriers and vectors, and changes in the natural ecosystems Citation18. Infectious agents are in a state of perpetual adaptation to their new host(s) or vectors which can lead to the emergence of ‘new’ disease(s) or the spread of known diseases in previously unaffected areas. Malaria is by far the most important vector-borne disease causing high morbidity and mortality in Tanzania Citation19. The endemicity and pattern of malaria transmission is focal and varies from place to place depending on many factors including weather and topography. Modeling malaria endemicity in Tanzania using outpatient cases (2004–2008) in relation to mean temperature and mean rainfall has shown that almost the whole of Tanzania is endemic for malaria, although with some spatial variation between areas. Mean rainfall accounts for 72% of the variation in malaria, while mean maximum temperature accounts for 14.1% and mean minimum temperature 13.1% Citation19.
The main objective of this paper is to show a detailed analysis of the association between changes of monthly weather (temperature and rainfall) on all-cause mortality by age groups, using the data from Rufiji Health and Demographic Surveillance System (RHDSS) and metrological data of rainfall and temperature for the period of 1999–2010.
Methods
Study area
The RHDSS is located in eastern Tanzania 7.47° to 8.03° south latitude and 38.62° to 39.17° east longitude (). The RHDSS is in the Rufiji district of Tanzania about 178 km south of Dar es Salaam. The district is among the six districts in the Coastal Region of Tanzania. The RHDSS constitutes 31 villages covering an area of 1813 km2 Citation20 Citation21.
Fig. 1. Location of Rufiji HDSS.
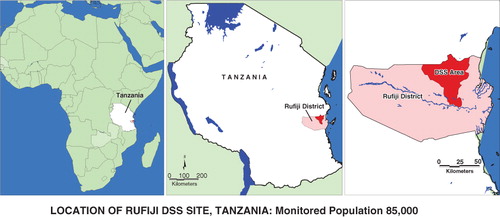
Rufiji has a mean altitude of <500 meters above sea level. Tropical forests and grassland dominated the vegetation cover of Rufiji. The weather is hot all over the year and with rainy seasons: short rains (October–December) and long rains (February–May). The average annual rainfall in the district is between 800 and 1,000 mm Citation21. The population size of the Rufiji District is about 203,102 of which more than 85,000 (about 42% of the district population) are covered by the surveillance system Citation22. The mean household size for the whole district is about five people per house Citation22. The district is largely rural and the population is clustered in small townships in the district Citation21.
RHDSS has a total of 18 health facilities. These include one hospital, two health centers, and 15 dispensaries. However, there are a proportion of people who receive health services from traditional healers and traditional birth attendants. The major causes of mortality include acute febrile illness such as malaria, AIDS, acute lower respiratory infections, tuberculosis, and perinatal causes. Immunization coverage ranges from 66% for measles in children that are 12–23 months of age to 85% for the Bacillus Calmette-Gue'rin (BCG; tuberculosis). About 89% of the population lives within 5 km of a formal health facility. All villages and health facilities in the district have been positioned by a global position system and mapped in a geographic information system database of the district health resources.
Data and study population
This study used longitudinal data collected in the RHDSS over an 11-year period from 1 January 1999 to 31 December 2010. A DSS is a longitudinal, population-based, health and vital events registration system that monitors demographic events such as births, deaths, pregnancies, migrations and socioeconomic status of a geographically well-defined setting of individuals, households, and residential units. In the RHDSS, every household is visited once in every 4 months in order to update previously recorded household information, which also includes registering new demographic events that may have occurred. Between household visits, community-based key informants report births and deaths as they occur, and when it does, a household is revisited in order to record such events.
Since the main focus of this study was to analyze the association of rainfall and temperature on all-cause mortality by age; all deaths that occurred and were recorded during the study period were of interest. Data on monthly rainfall (mm) and temperature (°C) were obtained from the Tanzania Meteorological Authority (TMA) head office in Dar es Salaam. TMA provides meteorological services, weather forecasts, climate services, and warnings including daily forecast information for each region in Tanzania Citation23.
Statistical analysis
Data management was done by using Intercooled Stata 11 Citation24 and analysis was performed using the MGCV package in R2.14.2 is a system for statistical computation and graphics. It consists of a language plus a run-time envirnment with graphics, a debugger, access tocertain system functions, and the ability to run programs sorted to script files Citation25. The MGCV package provides tools for generalized additive models (GAMs) and other generalized ridge regression Citation26. GAMs have been widely used in many time-series analyses and have been effectively applied in a variety of research areas Citation27. Data process was performed to generate the variables for time-series analysis as follows: all-causes mortality from the year 1999 to 2010; data on rainfall; and data for temperature were reported in mean, maximum and minimum. Age at death was grouped into three age groups: 0–4, 5–59, and over 60 years. A division was made between male and female. Season, time, and lags (lag 0–4) for both monthly rainfall and average monthly temperature were generated as well. Time-series Poisson regression models, using the MGCV package in this study, account for autocorrelation, seasonality, long-term trends, and lag effects that determine the best-fit model in relation to all-cause mortality attributed by monthly rainfall and monthly average temperature by age. The long-term trend was modeled through a natural cubic spline curve with 3 degrees of freedom per year of data. The degree of freedom for each smooth term in the model are chosen simultaneously as part of model fitting by minimizing the generalized cross-validation score of the whole model Citation26. The annual seasonal variation was modeled through natural cubic splines with 3 degrees of freedom also. Thus, the combined degree of freedom for both season and trend add up to 6 degrees of freedom per year. Four lags for rainfall and temperature were created in order to assess the delayed association of the previuos rainfall and temperature values on the current level of mortality. The GAM model used in this analysis was given by:
Where t refers to the month of the observation; (Y t ) denotes the observed monthly mortality counts on month t; s(.) denotes a smooth cubic spline function, xi denotes the monthly rainfall at lag 0–4 and monthly average temperature at lag 0–4, and ‘time’ represents both seasonal and trend pattern. We quantified the associations between the weather variables and mortality by strata of age, and the equation above was fitted for each age group.
Ethical approval
The ethical clearance for RHDSS was approved by local and national ethical committees.
Results
Description
represents the summary of all deaths recorded in the RHDSS aggregated per month from 1999 to 2010. A total of 10,116 deaths over the 11 years of observation (1999–2010) were recorded. The percentages of total deaths by age group were 30% for 0–4 years, 7% for 5–19 years, 23% for 20–59 years, and 40% for over 60 years. Since the proportion of age group 5–19 was very small we merged it with the age group 20–59 for further analysis. According to the RHDSS burden of disease profiles of 1999 to 2010, the large proportion of all-causes of deaths in the region were from communicable diseases. Malaria, HIV/AIDS, TB, and pneumonia are the leading cause of mortality for all age groups followed by a variety of neonatal and under-fives’ problems such as low birth weight and birth asphyxia.
Table 1. Summary of monthly mortality data, 1999–2010
Seasonal variability of weather and mortality
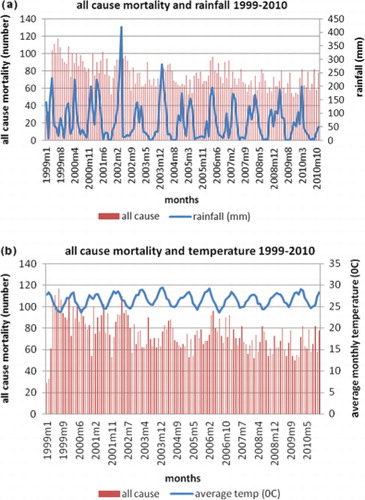
Since Rufiji has a tropical environment the monthly average temperature varied between 27.91°C and 34.4°C with a mean of 31.22°C. Monthly rainfall varied between 0 and 420.7 mm during the study period. a and 2b present the seasonal variations in all-cause mortality and rainfall and all-cause mortality and temperature variables, respectively, during the study period. Generally, there are seasonal fluctuations in mortality, with the highest peaks of deaths occurring during the periods of relative cold and high levels of rainfall.
Fig. 2. (a) Time series of all-cause mortality and rainfall; (b) Time series of all-cause mortality and temperature.
Seasonality of mortality
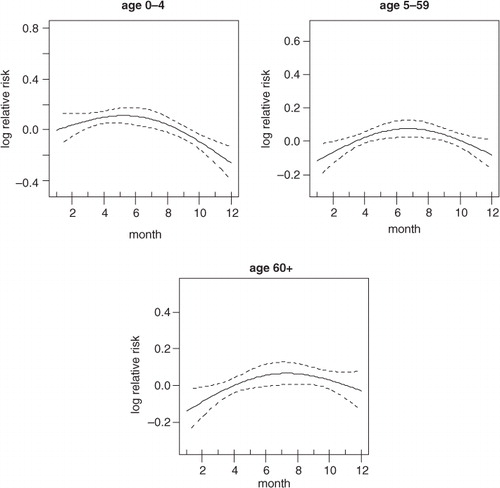
shows the strong crude seasonality and long-term trend of all-cause mortality. It shows that most of the deaths are concentrated in the middle of the year and also that there is a downward trend of mortality over time. The crude seasonality of all-cause mortality by specific age groups is shown in . A strong mortality pattern is observed in all age groups, that is, 0–4, 5–59, and over 60. High mortality is observed during March–May for the age group 0–4 and 5–59, the period that coincides with the long rain season. For the over 60 age group, mortality peaks during the months of June–September which corresponds with the dry and cold temperature period. shows the adjusted seasonality of all-cause mortality for monthly rainfall by age group. It shows that for all age groups (0–4, 5–59, and over 60), the mortality pattern peaks during the period of rain. The estimated curve of seasonality adjusted for weather shows a similar pattern in children under five, but a less clear seasonal pattern in the older age group indicating that weather variables explain part of the seasonal pattern for these age groups.
Fig. 3. Seasonality (left) and time trends (right) in all-cause mortality over the study period.
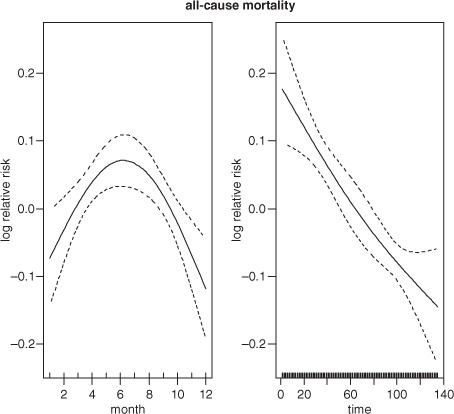
Fig. 4. Seasonality of all-cause mortality by age group.
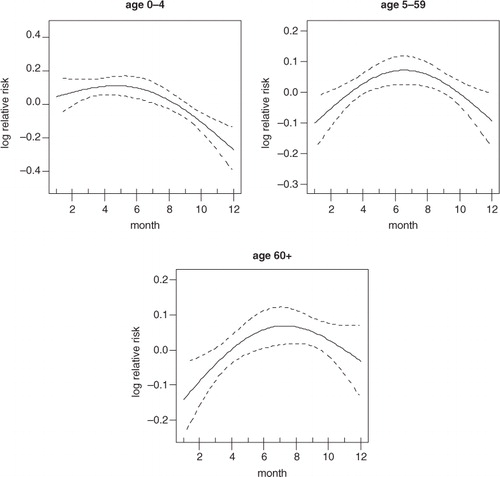
Fig. 5. Seasonality of all-cause mortality by age group adjusted for rainfall.
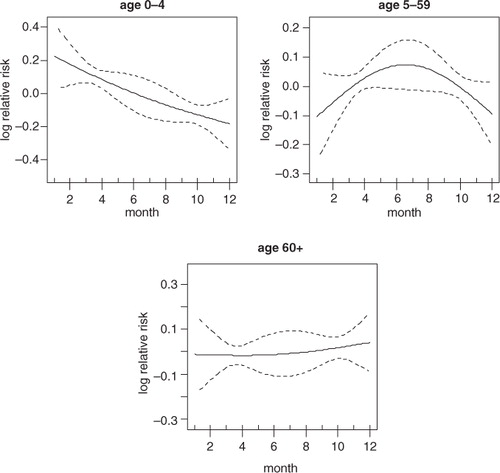
The adjusted seasonality of all cause mortality for monthly temperature by age group are presented in . The patterns show that mortality in all age groups peaked up at the mid of the year. This correspond with the time when the temperature is relatively lower compared to other periods of the year in Rufiji.
Fig. 6. Seasonality of all-cause mortality by age group adjusted for temperature.
Temperature and rainfall mortality plots
In , the graphs show smoothed plots of logged relative risk of mortality against monthly rainfall. It shows a positive linear rainfall-mortality relationship in all age groups. Based on the plots, only the slope of age group 0–4 is statistically significant (RR=1.001, 95% CI=0.961–1.041) whereby an increase of 10 mm of rainfall will increase mortality in the age group 0–4 by 1.4% (). Correspondingly, if the monthly rainfall rises to 400 mm, it will correspond with a 72% increase in under-five mortality.
Fig. 7. The influence of rainfall on mortality by age group.
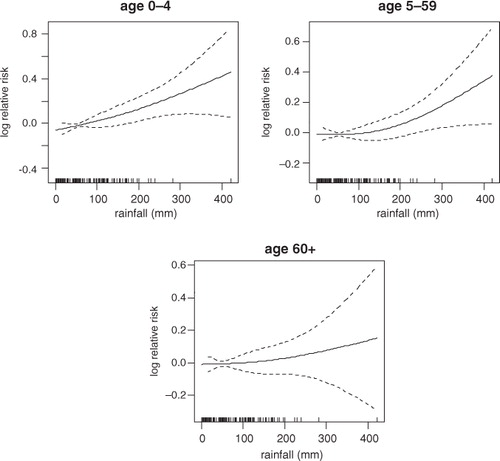
Table 2. Correlations between all-cause mortality and climate variables in RHDSS
shows linear plots of logged relative risk of mortality against the monthly average temperature. The graph reveals linear temperature-mortality relationships over lags. In , the threshold temperature exists somewhere between 26°C and 27°C for all age groups. Negative associations were observed for the temperature range below the thresholds. The monthly average temperature was significantly associated with all-cause mortality in all age groups (). If the monthly average temperature will decrease up to 24°C from the threshold, mortality will increase by 80.7%, 65.7% and 74% in age groups 0–4, 5–59, and over 60, respectively. The linear function of monthly rainfall effects on all-cause mortality shows a linear increase significant at lag of 0, 1, 2, and 3 in age group 0–4 (), while the effects of monthly average temperature on all-cause mortality is significant at lag of 2 in age group 5–59. There are no strong lag effects in the association of climatic variables (monthly rainfall and average temperature) on mortality in the age group 60 years and above ().
Fig. 8. The influence of temperature on mortality by age group.
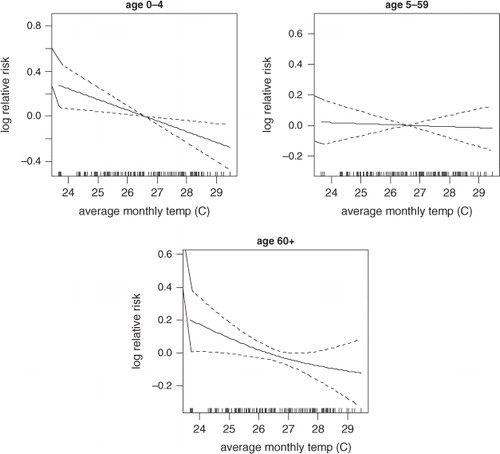
Table 3. Lag correlations between all-cause mortality and climate variables in Rufiji DSS, 1999–2010
Discussion
The main focus of this study was to investigate the influence of rainfall and temperature on all-cause mortality patterns in Rufiji, Tanzania. The findings show, in particular, an association between rainfall and mortality in children. This finding was similar to that observed by other studies Citation17. The observed rainfall association can be substantiated by the location of Rufiji where it experiences a tropical climate with a long rainy season from February to May and short a rainy season from October to December. This pattern is consistent with deaths caused by malaria, which also peak in the long and short rains, and is the single largest disease component contributing to the burden of disease in all ages in Rufiji Citation28. The findings of this study are similar to previous assessments of weather related mortality Citation29–Citation31. Recent studies conducted in Africa revealed that the outbreak of cholera and malaria support the causal link between monthly weather and health Citation32. Rainfall anomalies are widely considered to be a major driver of inter-annual variability of malaria incidence in Africa. About 90% of the deaths occurred in sub-Saharan Africa are believed to be due to malaria Citation12. Studies show that rainfall excess is correlated with changes in malaria incidence in certain eco-epidemiologic settings, apparently as a result of its impact on the population dynamics of the Anopheles spp. mosquito vector Citation29 Citation33. Weather shocks raise exposure to malaria as shown by the significant rise in the incidences of infant death Citation34. This is similar to our findings where rainfall is significantly associated with mortality in under-fives. The effect of rainfall on mortality can last for days, with the greatest association sometimes observed in the same month Citation30, which is similar to results in this study.
The association between ambient temperature and daily mortality has been well documented in the developed countries of the Northern Hemisphere Citation35. This study shows a relationship between both hot and cold temperature associations on mortality, although cold temperatures had a stronger association with mortality. Generally, Rufiji did not experience any extreme cold events that could directly cause mortality like that in the Northern Hemisphere countries. However, Rufiji's population is accustomed to a tropical climate and, like any other population, is exposed to cold temperatures relative to its average climate. This often occurs during the rainy season (which is consistent with the high malaria transmission season). Also it has been suggested that increased mortality is connected with cold weather because of elevated occurrences of influenza and other respiratory infections Citation36. Other studies show that housing factors and the substantial numbers of elderly living in ‘fuel’ poverty may influence the risk of excess winter deaths Citation31 Citation37, which is similar to results in this study. Inadequate indoor heating and outdoor clothing are likely to be important factors, therefore, in the observed associations with social deprivation. The effect of cold temperatures on mortality can be observed in the same month and can continue to last for months, as also observed in our investigation.
In conclusion, monthly weather showed a strong association on all-cause mortality. Younger age groups and the elderly population are more susceptible to the influence of monthly weather. Results of the present study show similarities with some previous findings, but also contradict other findings. The conflicting findings are mainly attributable to the multiple weather variables included in a range of studies, and to the different underlying disease burdens in studies from developed settings. This study highlights that the influence of monthly weather on all-cause mortality/morbidity is not well understood, and needs to be further studied in order to better comprehend causal mechanisms and to develop preventive actions.
This study has some limitations. For example, the analyses are based on all-cause mortality, but since the causes of death are driven by different mechanisms they also respond differently to monthly weather.
Finally, with a better understanding of health responses to weather conditions then better health services and policies could be formulated, such as stressful weather episode warnings to susceptible populations and the proper allocation of limited resources.
Conflict of interest and funding
The authors declare that they have no competing interests.
Authors’ contributions
SM wrote the manuscript first draft, AS and MS revised the paper and contributed to the discussion. SM, AS, and MS analyzed data, revised the manuscript, and contributed to the discussion. HM participated in designing the study and critically reviewed the manuscript drafts. All authors read and approved the final manuscript.
Acknowledgements
The authors would like to thank the Ministry of Health and Social Welfare, Ifakara Health Institute, INDEPTH Network, Rockefeller Foundation, and the President's Malaria Initiative for funding the RHDSS. The authors also thank the INDEPTH Network and Dr. Joacim Rocklöv from Umeå University for facilitating the publication of this paper. We thank the RHDSS staff for granting the authors access to data. The authors are most grateful to the villagers who shared their personal information over the years, and thanks also goes to the Tanzania Meteorological Authority for sharing their meteorological data with us. This research was supported by the INDEPTH Network. We thank Joacim Rocklöv, Yazoume Ye, Rainer Sauerborn, Sari Kovats, David Hondula, and Martin Bangha who facilitated at INDEPTH workshops in Nouna, Burkina Faso and Accra, Ghana.
Related Research Data
References
- Intergovernmental Panel on Climate Change (IPCC). Climate change impacts, adaptation and vulnerability, contribution of the working group II to the fourth assessment report of IPCC. Cambridge: Cambridge University press. 2007.
- Confalonieri U, Menne B, Akhtar R, Ebi KL, Hauengue M, et al.Human health. Climate change 2007: impacts, adaptation and vulnerability. Contribution of Working Group II to the Fourth Assessment Report of the Intergovernmental Panel on Climate Change. Parry ML, et al..Cambridge University Press. CambridgeUK, 2007
- Patz JA, Campbell-Lendrum D, Holloway T, Foley JA. Impact of regional climate change on human health. Nature. 2005; 438: 310–7. 10.3402/gha.v5i0.19068.
- McMichael A, Haines A. Global climate change: the potential effects on health. BMJ. 1997; 315: 805–9. 10.3402/gha.v5i0.19068.
- Kumaresan J, Sathiakumar N. Climate change and its potential impact on health: a call for integrated action. Bull World Health Organ. 2010; 88: 163.10.3402/gha.v5i0.19068.
- Stern N. The economics of climate change: the Stern review. Cambridge University Press. CambridgeUK, 2007
- Narain JP. Climate change brings natural disasters and disease. Science and Development Network. London, 2009
- Snow RW, Guerra CA, Noor AN, Myint HY, Hay SI. The global distribution of clinical episodes of plasmodium falciparum malaria. Nature. 2005; 434: 214–7. 10.3402/gha.v5i0.19068.
- WHO. (2004). Malaria epidemics: forecasting, prevention, early warning and control – from policy to practice. Report of an informal consultation, Leysin, Switzerland, 8–10December2003. Geneva: World Health Organization., 52. p.
- Gordon O, Jaspat A, Charles S. 2010. Analysis of climate change and variability risks in the smallholder sector: case studies of the Laikipia and Narok districts representing major agro ecological zones in Kenya Department of Resource Surveys and Remote Sensing (DRSRS) in collaboration with the Food and Agriculture Organization of the United Nations. , Rome. Available from: http://www.fao.org/docrep/013/i1785e/i1785e00.pdf.
- Ceven Shemsanga, et al.. The Cost of Climate Change in Tanzania: Impacts and Adaptation. 6 J. Am. Sci. 2010; 3: 182–96.
- Intergovernmental panel on climate change (IPCC). Climate change impacts, adaptation and vulnerability, contribution of the working group II to the third assessment report of IPCC. Cambridge: Cambridge University press. 2001.
- WHO. (2009). Protecting health from climate change. Connecting science, policy and people. Geneva: World Health Organization.
- Githeko AK, Lindsay SW, Confalonieri UE, Patz JA. Climate change and vector-borne diseases: a regional analysis. Bull World Health Organ. 2000; 78: 1136–47.
- Patz JA, Campbell-Lendrum D, Holloway T, Folley JA. Impact of regional climate change on human health. Nature. 2005; 438: 310–7. 10.3402/gha.v5i0.19068.
- Kandji ST, Verchot LV. ( Undated). Impacts of and adaptation to climate variability and climate change in the East African Community: A focus on the agricultural sector. Nairobi: World Agroforestry Centre (ICRAF). Available online at http://www.worldagroforestry.org/downloads/publications/PDFs/RP07172.pdf.
- Mboera LEG, Mayal BK, Kweka EJ, Mazigo HD. Climate change on human health and health systems in Tanzania: a review. Tanzania journal of health research. 2011; 13(Suppl 1): DOI: 10.3402/gha.v5i0.19068.
- Afrane YA, Zhou G, Lawson BW, Githeko AK, Yan G. Effects of microclimatic changes caused by deforestation on the survivorship and reproductive fitness of Anopheles gambiae in Western Kenya Highlands. Am J Trop Med Hyg. 2006; 74: 772–8.
- Mboera LEG, Massaga JJ, Munga MA, Mayala BK, Kahwa AM, Msovela J, et al.. Current status of the service availability at various levels Health System in Tanzania. Dar es Salaam. National Institute for Medical Research. Tanzania, 2010
- Shabani J, Lutambi AM, Mwakalinga V, Masanja H. Clustering of under-five mortality in Rufiji Health and Demographic Surveillance System in rural Tanzania. Glob Health Action. 2010;3.
- Mwageni E, Momburi D, Juma Z, Irema M, Masanja H. Rufiji DSS. Tanzania essential health interventions project. Adult morbidity and mortality. Tanzania Ministry of Health. Dar es Salaam Tanzania, 1998
- NBS. (2002). Population and housing census. Dar es SalaamTanzania: National Bureau of Statistics (NBS).
- Tanzania Meteorological Authority. Available from: http://www.meteo.go.tz/ [cited 18 September 2012]..
- StataCorp. Stata: Release 11. Statistical Software. College Station. TX: StataCorp L.P. 2009.
- R2.14.2. Available from: http://cran.r-project.org/src/base/R-2/R-2.14.2.tar.gz [cited 18 September 2012].
- Wood SN. Modelling and smoothing parameter estimation with multiple quadratic penalties. J R Statist Soc (B). 2001; 62: 415–28.
- Dominici F, Daniels M, Zeger SL, Samet JM. Air pollution and mortality: estimating regional and national dose-response relationships. J Am Stat Assoc. 2002; 97: 100–11. 10.3402/gha.v5i0.19068.
- de Savigny D, Mayombana C, Mwageni E, Masanja H, Minhaj A, Mkilindi Y, et al.. Care-seeking patterns for fatal malaria in Tanzania. Malar J. 2004; 3: 27.10.3402/gha.v5i0.19068.
- Connor S, Thomson M, Molyneux D. Forecasting and prevention of epidemic malaria: new perspectives on an old problem. Parassitologia. 1999; 41: 439–48.
- Chou W-C, Wu J-L, Wang Y-C, Huang H, Sung F-C, Chuang C-Y. Modeling the impact of climate variability on diarrhea-associated diseases in Taiwan. Sci Total Environ ; 409. 1996; 2010: 43–51.
- Yu W, Vaneckova P, Mengersen K, Pan X, Tong S. Is the association between temperature and mortality modified by age, gender and socio-economic status?. Sci Total Environ. 2010; 408: 3513–8. 10.3402/gha.v5i0.19068.
- Yanda P, Wandiga S, Kangalawe R, Opondo M, Olago D, Githeko A, et al.2006. Adaptation to climate change/variability-induced highland malaria and cholera in the Lake Victoria Region. AIACC Working Paper No. 43..
- Thomson MC, Mason SJ, Phindela T, Conner SJ. Use of rainfall and sea surface temperature monitoring for malaria early warning in Botswana. Am J Trop Med Hyg. 2005; 73: 214–21.
- Kudamatsu M, Persson T, Strömberg D. Weather and infant mortality in Africa. Stockholm. IIES, Stockholm University. Sweden, 2010
- IPCC. (1996). Climate change and human health: an assessment prepared by a Task group on behalf of the World Health Organization, the World Meteorological Organization and the United Nations Environment Programme. Geneva: World Health Organization.
- Bull GM. The weather and deaths from pneumonia. Lancet. 1980; 1: 1405–8. 10.3402/gha.v5i0.19068.
- DETR. Fuel poverty – the new HEES – a programme for warmer, healthier homes. London: Department of the Environment Transport and the Regions. 1999.
- Lopez A.D, et al.. Global and regional burden of disease and risk factors, 2001: systematic analysis of population health data. Lancet. 2006; 367(9524):1747–57. 10.3402/gha.v5i0.19068.