Abstract
Introduction : Climate and weather variability can have significant health consequences of increased morbidity and mortality. However, today the impact of climate and weather variability, and consequentially, of climate change on population health in sub-Saharan Africa is not well understood. In this study, we assessed the association of daily temperature and precipitation with daily mortality by age and sex groups in Northern Ghana.
Methods : We analysed daily mortality and weather data from 1995 to 2010. We adopted a time-series Poisson regression approach to examine the short-term association of daily mean temperature and daily mean precipitation with daily mortality. We included time factors and daily lagged weather predictors and considered autocorrelation.
Results : For all populations, a statistically significant association of mean daily temperature with mortality at lag days 0–1 was observed below and above the 25th (27.48°C) and 75th (30.68°C) percentiles (0.19%; 95% confidence interval CI: 0.05%, 0.21%) and (1.14%; 95% CI: 0.12%, 1.54%), respectively. We also observed a statistically significant association of mean daily temperature above 75th percentile at lag days 2–6 and lag days 7–13 (0.32%; 95% CI: 0.16%, 0.25%) and 0.31% [95% CI: 0.14%, 0.26%]), respectively. A 10 mm increase in precipitation was associated with a 1.71% (95% CI: 0.10%, 3.34.9%) increase in mortality for all ages and sex groups at lag days 2–6. Similar results were also observed at lag days 2–6 and 14–27 for males, 2.92% (95% CI: 0.80%, 5.09%) and 2.35% (95% CI: 0.28%, 4.45%).
Conclusion : Short-term weather variability is strongly associated with mortality in Northern Ghana. The associations appear to differ among different age and sex groups. The elderly and young children were found to be more susceptible to short-term temperature-related mortality. The association of precipitation with mortality is more pronounced at the short-term for all age and sex groups and in the medium short-term among males. Reducing exposure to extreme temperature, particularly among the elderly and young children, should reduce the number of daily deaths attributable to weather-related mortality.
Climate and weather variability can have significant health consequences, resulting in increases in morbidity and mortality Citation1–Citation3. However, their impact on people living in tropical regions has not been as well described. The prevention of deaths caused by extreme weather conditions, including temperatures and precipitation is an issue of importance concerning public health Citation4 Citation5. There is a continuous flow of hospitalizations and deaths attributed to extreme ambient temperatures Citation3 Citation6. Elevated short-term weather variations are known to be associated with morbidity and mortality, including heatwaves Citation3, cold exposure Citation7, and heavy rains and dust Citation8. Studies on the relationship between weather variations and mortality are common in high-income countries but limited in low- and middle-income countries.
Projections of future climate scenarios suggest that higher global mean temperatures could result in marked changes in the frequency of temperature extremes and could result in substantial increase in temperature-related mortality Citation9. Quantification of the population mortality burden attributable to adverse changes in weather conditions are essential for planning of adaptive approaches to minimize the impact of climate change on population, particularly in less developed countries in sub-Saharan Africa.
For instance, in Northern Ghana, drastic changes in weather conditions occur every year. The Harmattan season (December–February) is usually characterized by very cold weather conditions in the early morning followed by very hot temperature, sometimes above 40°C, during the day. On the contrary, during the peak of the wet season (July–August), the weather is usually characterized by heavy rainfall and flooding, sometimes destroying houses and displacing families. However, the extent of the association of these weather conditions with population health is currently unknown. Studies in Europe and North America have shown significant association between increases in mortality and elevated temperature, measured by maximum or minimum temperature, heat index, and sometimes, other weather indices Citation10. The elderly, young children, and the poor and the sick are particularly at risk Citation3 Citation11 Citation12.
Studies in tropical countries have also shown that there is strong seasonal variation in Plasmodium falciparum malaria infection incidence with the peak observed in August and September, which corresponds to the peak of the rainy season Citation13 Citation14. Therefore, a better understanding of the factors that increase mortality as a result of the association of temperature and precipitation are needed to adequately define high-risk groups among the population. In this study, we assessed the association between temperature and precipitation on all-cause mortality in Northern Ghana.
Methods and materials
The study was conducted in the Kassena-Nankana DistrictFootnote1 (KND) of the Upper East region of Ghana, which covers an area of 1,675 km2 in size, and is between latitude 10° 30′ and 11°00′ north and longitude 0°50′ and 1°30′ west of the equator. Ecologically, the area is in the guinea savanna belt, characterized by semi-arid conditions with the vegetation consisting of grassland interspersed with short trees. There are two main seasons, the dry and wet seasons, which are influenced by two main air masses – the North-East Trade winds (Harmattan air mass) and the South-Westerlies (Tropical Maritime air mass), respectively. During the dry season (November–April), these winds are usually dry and dusty as they originate from the Sahara Desert. Minimum and maximum temperature during the day can range from 38°C to 42°C and night temperatures can fall below 18°C. During such periods, precipitation is virtually absent due to low relative humidity, which rarely exceeds 20%. During the wet season (May–October), the district experiences the tropical maritime air mass, which comes along with precipitation. Annual precipitation figures are in the range of 850 mm and 950 mm.
Previous studies have described the health profile of the people in the district Citation15–Citation18. Malaria and diarrhea continue to account for a large proportion of deaths Citation14 Citation19 Citation20, but a recent study has shown a gradual transition from infectious disease to non-communicable disease Citation15.
Mortality data for the study comes from the longitudinal population surveillance data of the Navrongo Health and Demographic Surveillance System (NHDSS). Starting with an initial census of the population in July 1993, the HDSS has continuously followed the population every 4 months, monitoring vital events, including births, deaths, and in and out migrations. Mortality variables were stratified by sex and four categorized age groups: (0–4), (5–19), (20–59), and (60+). summarizes the mean, maximum, and minimum daily mortality in the dataset. Weather data (daily minimum, maximum temperature and daily precipitation data) from January 1995 to December 2010 were obtained from the Navrongo Meteorology Station. Daily mean temperature data were aggregated from daily minimum and maximum temperatures, an index designed to better estimate exposure as it uses multiple observations per day and so should be less prone to measurement error compared with other temperature indices Citation21.
Table 1. Summary statistics of daily mortality data by age and sex in the Kassena-Nankana Districts (KNDs) of Northern Ghana (1995–2010)
Statistical analysis
We used a time series Poisson regression approach allowing for over-dispersion (for the mortality versus precipitation model) that included time-varying factors, such as time trend and season. We used a range of short-term lags of daily weather variables to assess the association between daily mean temperature and precipitation on mortality.
The daily mortality data from the NHDSS has some groupings of deaths on the 15th day of the month. This follows an earlier practice by field staff to record the 15th day of the month if the exact date of death could not be established. The date of death grouping was taken care of by replacing the deaths on the 15th day of each month with the monthly average. The remaining deaths for the given month were then distributed equally across the days of the month.
We fitted models to assess the association of mean daily temperature and precipitation on all-cause mortality by age groups and gender. We assumed that mortality patterns in the study area could be driven by a range of mediating factors (disease mechanisms) that are weather related. Adjustment for time trends and seasonality were done using natural cubic spline functions allowing for fixed Citation3 degrees of freedom (df) per year. The association of precipitation on daily mortality was statistically tested and found to be linear. We tested the sensitivity of the df of the smooth function of time trend by allowing for different df (i.e. 2, 3, 4, 6 and 8). Similarly, the df for the smooth function for the lag days temperature and precipitation variables were tested for sensitivity using df ranging from 2 to 6. We tested the association of 0–1, 2–6, 7–13, and 14–27 lag days of precipitation on mortality and chose to exclude results for 7–13 lag days for precipitation. Similarly, the lag day terms tested for association between temperature and mortality were of 0–1, 2–6, and 7–13. These lag strata are the mean of daily temperature and precipitation of lag day periods. Model fit was assessed using deviance statistic and Akaike Information Criterion (AIC) to arrive at a more parsimonious model. In addition, partial autocorrelation, heteroscedasticity and Q-Q plots were used to assess model assumptions.
We estimated the relative risks (RRs) for the association of daily mean temperature and precipitation with daily mortality using lag strata. The cumulative lag day's association for temperature was calculated for all lag days at the 25th and 75th percentile assuming linearity. The RRs for precipitation were fitted as linear terms, as suggested above. Days within the study period without data on temperature and precipitation were treated as missing values in the analysis. Data preparation and analysis were carried out using Stata version 11.2 (Stata Corp., College Station, TX), whereas regression models were fitted using the statistical software R version 2.12.1 Copyright (C) 2010 (The R Foundation for Statistical Computing).
Results
The total deaths reported within the period (1995–2010) were 31,144. A longitudinal analysis shows that the study area has witnessed a general decline in all-cause mortality over the study period (results not shown). Most of the deaths occurred among the older population, that is, 60+ (34.9%), while the highest maximum daily deaths occurred among children younger than age 5(11.0). Average daily mortality was relatively raised round the 90th day of the year coinciding with the peak of the temperature period (March–April). However, the peak in mortality seems a little delayed compared with the peak in precipitation as shown in . Minimum and maximum daily temperature and precipitation are also shown in .
Fig. 1. Seasonal pattern in daily mortality, daily mean temperature and precipitation in the Kassena-Nankana Districts (KNDs) of Northern Ghana (1995–2010).
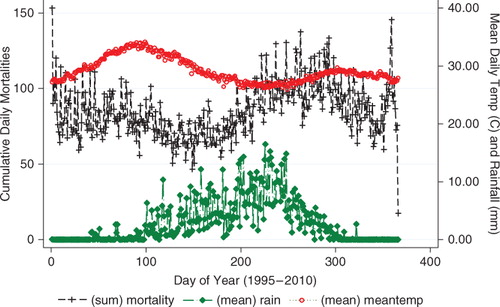
Table 2. Summary statistics of daily temperature and precipitation in the Kassena-Nankana Districts (KNDs) of Northern Ghana (1995–2010)
Association of daily mean temperature (°C) on daily mortality over lagged strata
The relationship between daily mean temperature and mortality is generally ‘U’ shaped for the short-term lag days of mean daily temperature (). There is a decrease in mortality from lower temperature up to about 30°C and then an increase upwards with increasing temperature. The thresholds for the 25th and 75th percentiles for the lag strata are 27.4°C and 30.6°C, respectively. The relationship tends to be linear for the association between temperature and mortality for lag days 2–6 among the 5–19 years age group and lag days 0–1 and 7–13 for the 20–59 years age group (results not shown).
Fig. 2. Relative risks (RRs) of daily mortality among age and sex groups with daily mean temperature over lagged strata. Gray regions are corresponding 95% confidence intervals.
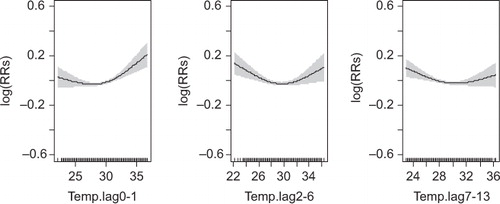
For all populations, a statistically significant association of mean daily temperature on mortality at lag days 0–1 was observed below and above the 25th and 75th percentiles (p-value 0.029 and 0.008), respectively (). We also observed a statistically significant association of mean daily temperature above 75th (30.6°C) percentile for lag days 2–6 and 7–13 but not at the 25th percentile (27.4°C), as shown in . However, the cumulative effect of lag days at the 25th and 75th percentiles were 1.0% (95% confidence interval [CI]: −0.8%, 2.8%) and 1.8% (95% CI: 0.7%, 2.9%), respectively ().
Table 3. Percent increase (95% confidence interval [CI]) for all cause daily mortality associated with 1°C increase in mean daily temperature
Table 4. Cumulative lag effect as a percent increase (95% confidence interval [CI]) for all cause mortality associated with 1°C increase in mean daily temperature
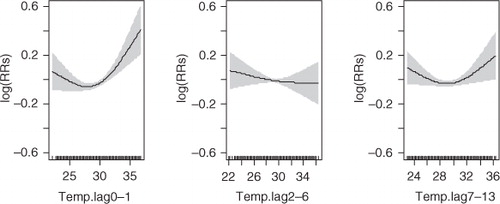
The results also show that a 1°C increase in mean daily temperature above the 75th percentile at lag days 2–6 and 7–13 was significantly associated with an increase in risk of mortality among children younger than age 5 (), 0.7% (95% CI: 0.4%, 0.5%) and 0.5% (95% CI: 0.2%, 0.5%), respectively ().
Fig. 3. Relative risks (RRs) of daily mortality among children under 5 years of age with daily mean temperature over lagged strata. Gray regions are corresponding 95% confidence intervals.
Among children aged 5–19 years, temperature at the 75th percentile of lag days 7–13 was significantly associated with mean daily mortality 0.7% (95% CI: 0.2%, 0.7%).
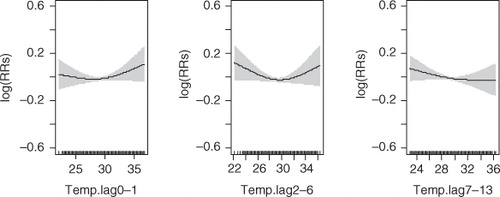
Among the elderly adults, 60+, the only significant (10% level of significance) association of temperature was observed at lag days 0–1 below and above the 25th and 75th percentiles (). Among this age group, the cumulative lagged days’ associations were estimated to be 0.8% (95% CI: −2.1%, 3.7%) and 1.8% (95% CI: 0.2%, 3.5%), respectively, for the 25th and 75th percentiles (). Cumulatively, the lag days were not significantly associated with mortality below the 25th percentile 1.0% (95% CI: −1.5%, 3.5%) but significant at the 75th percentile 1.5% (95% CI: 0.1%, 3.0%) ().
Fig. 4. Relative risks (RRs) of daily mortality among adults 60 years and above with daily mean temperature over lagged strata. Gray regions are corresponding 95% confidence intervals.
Mortality among men seems to be higher per 1°C increase in daily mean temperature above the 30.6°C threshold for all the lag days but this was more pronounced in the 0–1 lag days (). Also, the cumulative association of the lag days strata were estimated to be 2.1% (95% CI: −1.4%, 3.4%) and 2.0% (95% CI: 0.6%, 3.4%), respectively, at the 25th and 75th percentiles ().
Association of daily precipitation (mm) on daily mortality over lagged strata
Precipitation in the study area has a linear relationship with daily mortality (). The results show that short-term precipitation has an increasing association on mortality among the whole population (). A 10-mm increase in precipitation was found to be associated with a 1.7% (95% CI: 0.1%, 3.3%), at lag days 2–6 for the whole population ().
Fig. 5. Relative risks (RRs) of daily mortality among all age and sex groups with daily precipitation over lagged strata. Gray regions are corresponding 95% confidence intervals.
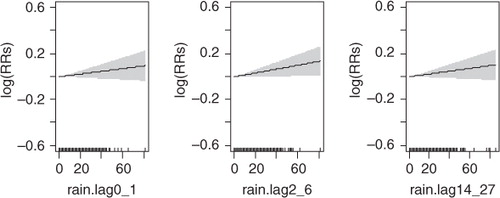
Table 5. Percent increase (95% confidence interval [CI]) for all cause daily mortality associated with 10 mm increased in precipitation
For children younger than age 5, the association of a 10-mm increase in precipitation though was not observed to be significantly related with daily mortality, a higher risk was observed with increasing lagged days: 0.4% (95% CI: −2.4%, 3.3%), 1.4% (95% CI: −1.3%, 4.1%), and 1.8% (95% CI: −0.8%, 4.5%) for lag days 0–1, 2–6, and 14–27, respectively ().
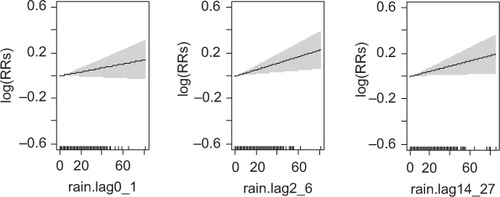
Even though the association of 10 mm increase in precipitation at lag days 0-1, 2-6, and 14-27 strata among the age groups were found not to be statistically significant, the association of precipitation with gender presented mixed results. While mortality among females does not seem to be affected by both short-term and medium short-term lag days of precipitation, mortality among males seems to be more relatively affected by long-term lag days (between 2 and 4 weeks) ().
For instance, daily mortality per a 10-mm increase in precipitation among females were observed to be 0.6% (95% CI: −1.7%, 2.8%), 0.4% (95% CI: −1.8%, 2.6%), and 0.0% (95% CI: −2.1%, 2.1%), respectively, at lags days 0–1, 2–6, and 14–27 (). Similarly for males, the association with mortality per a 10-mm increase in precipitation were 1.8% (95% CI: −0.4%, 4.0%) at lag days 0–1, 2.9% (95% CI: 0.8%, 5.1%) at lag days 2–6, and 2.3% (95% CI: 0.3%, 4.5%) at lag days 14–27 ( and ).
Fig. 6. Relative risks (RRs) of daily mortality among males with daily precipitation over lagged strata. Gray regions are corresponding 95% confidence intervals.
Discussion
Northern Ghana like other tropical climatic regions is characterized by seasonal variations in climatic conditions. However, there are no known studies or only few studies have examined the association between weather variation and mortality. The results show that both short-term daily mean temperature and long-term excess precipitation have a significant association on all-cause mortality in the whole population.
The cumulative association of temperature over the lag strata was estimated to be 1.8% higher per 1°C increase in daily mean temperature (above 30.6°C) on all-cause mortality across the whole population. Our study has corroborated well with previous studies showing that the elderly in society are among the most vulnerable groups during periods of increase in temperature Citation3 Citation11. For instance, Hales et al. Citation22 in their study found that a 1.8°F increase in temperature was associated with 1% (95% CI: 04%, 2.1%) in all-cause mortality.
Furthermore, we found that the association of temperature above the 75th percentile between lag weeks 1 and 2 was significant with a relative risk of 0.7% (95% CI: 0.2%, 0.7%) among children and young adolescents in the 5–19 age group. However, in the 20–59 age group, the effect was not significant.
Furthermore, we found that mortality related to long-term association of excess precipitation dramatically increased per a 10-mm increase in precipitation with an associated risk of 2.3% (95% CI: 0.3%, 4.5%) and 2.9% (95% CI: 0.8%, 5.1%) in the short-term and medium short-term lag days, respectively, among the male population. Higher precipitation patterns may increase the burden of mortality as a result of increase in the risk of infectious diseases, such as malaria, diarrhea, and respiratory infections. Coincidentally, incidences of these diseases among the vulnerable populations are heightened during the peak raining season. Malaria is the most widespread disease in the districts during this time of the year, affecting both infants and the elderly Citation14. In a previous study by Armah et al. Citation23, it was found that diarrhea and mortality also peak during the wet season and may explain the excess mortality that have been observed in our study. One previous study showed that any precipitation, 4 days prior, was significantly associated with an 11% increase in acute gastrointestinal illness visits to pediatric emergency department Citation24. In a study on the seasonal pattern of pneumonia-related mortality among children younger than age 5, Ye et al. Citation25 provided evidence that mortality in this age group in Nairobi's slums peaks during the rainy season. The explanations for this association are varied and as this study did not examine the associations between precipitation and cause-specific mortality, we are presently not in a position to explain the reasons for the association of precipitation with the male gender.
The study area has witnessed a couple of meningitis epidemics in recent years, mostly at a time when temperature is at its peak (March–April). Previous studies conducted in the study area have shown that more deaths attributable to meningitis have been observed in the dry seasons compared to any time of the year Citation26 Citation27. This could be explained by the long dry and hot season coupled with the housing architecture (poor ventilation) and sleeping arrangement of the population during these hot weather conditions. In a study by Scovronick et al. Citation28 in South Africa, the authors found that future mortality burdens would be reduced by over 50% (approximately 5,000 deaths annually) under a development policy that prioritizes the replacement of informal housing compared to one that prioritizes the replacement of traditional dwellings. Our results have highlighted the population groups that are most vulnerable to excess weather conditions, thus allowing for the formulation of better policy interventions to minimizing the adverse effects of climate change on population health in Northern Ghana.
There are some potential limitations to this study. First, some deaths in the HDSS data were recorded on the 15th day of the month when data collectors fail to establish the exact date of death. In the analysis, we addressed this problem by replacing the deaths on the 15th day of the month with the monthly average number of deaths and then redistributing the rest of the deaths equally across the days of the month. This methodological approach of handling age grouping has not been reported in the research literature and, therefore, needs further investigation and validation. Second, we also did not adjust for confounding factors, such as air pollution (visibility), on the association between temperature and mortality. Previous studies have been able to establish mediating effect of air pollution on the association between daily mean temperature and mortality Citation29 Citation30. Finally, the weather data contained about 4% missing values. However, these data were randomly distributed and adjusted for in the analysis and, therefore, could not affect the validity of our results.
Conclusion
This study has explored the relationship between temperature and precipitation variability with all-cause mortality to inform climate adaptation interventions in Northern Ghana. We provide evidence of increase in mortality associated with short-term increase in daily mean temperature exposure, particularly during the dry season on vulnerable populations, especially the young and elderly. We also observed statistically significant increased mortality associated with excess precipitation at medium short-term among males. The RRs associated with increased short-term daily mean temperature above the upper threshold seems to be stronger than short-term cool association and thus poses a serious public health hazard in the light of the global warming.
These new results provide a good basis for further research to elucidate the health impact and risk factors related to weather and climate change in Northern Ghana. They also support the call to develop interventions to control human activities on climate change and establish stronger public health systems to handle the consequences that future adverse climatic conditions will have on the population's health in Northern Ghana.
Conflict of interest and funding
The authors have not received any funding or benefits from industry or elsewhere to conduct this study.
Acknowledgements
We wish to acknowledge the untiring efforts and commitment of the NHDSS field staff, data entry clerks and data managers in collecting and managing this longitudinal data. We express our profound gratitude to the NHDSS research community for their continual cordial relationship and support for the research work. We are most grateful to the staff of Navrongo Meteorological Station for their willingness to share the weather data with us to undertake this study. We are very grateful to all our sponsors who have supported and continue to support the NHDSS, particularly the Rockefeller Foundation, which supported the NHDSS in its maiden years of operation.
This research was supported by the INDEPTH Network. We thank Joacim Rocklöv, Yazoume Ye, Rainer Sauerborn, Sari Kovats, David Hondula and Martin Bangha who facilitated at INDEPTH workshops in Nouna, Burkina Faso and Accra Ghana, for the production of this work.
Notes
1In 2008, a new district, Kassena-NankanaWest District, was carved out of the initial Kassena-Nankana District. Consequently, the NDSS now covers two districts.
Related Research Data
References
- Yu W, Mengersen K, Hu W, Guo Y, Pan X, Tong S. Assessing the relationship between global warming and mortality: lag effects of temperature fluctuations by age and mortality categories. Environ Pollut. 2011; 159: 1789–93. 10.3402/gha.v5i0.19073.
- Armstrong BG, Chalabi Z, Fenn B, Hajat S, Kovats S, Milojevic A, et al.. Association of mortality with high temperatures in a temperate climate: England and Wales. J Epidemiol Community Health. 2011; 65: 340–5. 10.3402/gha.v5i0.19073.
- Astrom DO, Forsberg B, Rocklov J. Heat wave impact on morbidity and mortality in the elderly population: a review of recent studies. Maturitas. 2011; 69: 99–105. 10.3402/gha.v5i0.19073.
- Kalkstein LS. Health and climate change. Direct impacts in cities. Lancet. 1993; 342: 1397–9. 10.3402/gha.v5i0.19073.
- Kalkstein LS, Smoyer KE. The impact of climate change on human health: some international implications. Experientia. 1993; 49: 969–79. 10.3402/gha.v5i0.19073.
- Smargiassi A, Goldberg MS, Plante C, Fournier M, Boudouin Y, Kosatsky T. Variation of daily warm season mortality as a function of micro-urban heat islands. J Epidemiol Community Health. 2009; 63: 659–64. 10.3402/gha.v5i0.19073.
- Barnett AG, Hajat S, Gasparrini A, Rocklöv J. Cold and heat waves in the United States. Environ Res. 2012; 112: 218–24. 10.3402/gha.v5i0.19073.
- Hii YL, Rocklov J, Ng N. Short term effects of weather on hand, foot and mouth disease. PloS One. 2011; 6: e16796.10.3402/gha.v5i0.19073.
- Huang C, Barnett AG, Wang X, Vaneckova P, FitzGerald G, Tong S. Projecting future heat-related mortality under climate change scenarios: a systematic review. Environ Health Perspect. 2011; 119: 1681–90. 10.3402/gha.v5i0.19073.
- D'Ippoliti D, Michelozzi P, Marino C, de'Donato F, Menne B, Katsouyanni K, et al.. The impact of heat waves on mortality in nine European cities: results from the EuroHEAT project. Environ Health. 2010; 9: 37.10.3402/gha.v5i0.19073.
- Rocklov J, Forsberg B. The effect of high ambient temperature on the elderly population in three regions of Sweden. Int J Environ Res Public Health. 2010; 7: 2607–19. 10.3402/gha.v5i0.19073.
- Costello A, Abbas M, Allen A, Ball S, Bell S, Bellamy R, et al.. Managing the health effects of climate change: lancet and University College London Institute for Global Health Commission. Lancet. 2009; 373: 1693–733. 10.3402/gha.v5i0.19073.
- Ye Y, Hoshen M, Kyobutungi C, Louis VR, Sauerborn R. Local scale prediction of Plasmodium falciparum malaria transmission in an endemic region using temperature and rainfall. Glob Health Action. 2009; 2. DOI: 10.3402/gha.v5i0.19073.
- Appawu M, Owusu-Agyei S, Dadzie S, Asoala V, Anto F, Koram K, et al.. Malaria transmission dynamics at a site in northern Ghana proposed for testing malaria vaccines. Trop Med Int Health. 2004; 9: 164–70. 10.3402/gha.v5i0.19073.
- Debpuur C, Welaga P, Wak G, Hodgson A. Self-reported health and functional limitations among older people in the Kassena-Nankana District, Ghana. Glob Health Action. 2010; 3. DOI: 10.3402/gha.v5i0.19073.
- Baird JK, Owusu-Agyei S, Utz GC, Koram K, Barcus MJ, Jones TR, et al.. Seasonal malaria attack rates in infants and young children in northern Ghana. Am J Trop Med Hyg. 2002; 66: 280–6.
- Binka FN, Morris SS, Ross DA, Arthur P, Aryeetey ME. Patterns of malaria morbidity and mortality in children in northern Ghana. Trans R Soc Trop Med Hyg. 1994; 88: 381–5. 10.3402/gha.v5i0.19073.
- Baiden F, Hodgson A, Adjuik M, Adongo P, Ayaga B, Binka F. Trend and causes of neonatal mortality in the Kassena-Nankana district of northern Ghana, 1995–2002. Trop Med Int Health. 2006; 11: 532–9. 10.3402/gha.v5i0.19073.
- Binka FN, Anto FK, Oduro AR, Awini EA, Nazzar AK, Armah GE, et al.. Incidence and risk factors of paediatric rotavirus diarrhoea in northern Ghana. Trop Med Int Health. 2003; 8: 840–6. 10.3402/gha.v5i0.19073.
- Adjuik M, Smith T, Clark S, Todd J, Garrib A, Kinfu Y, et al.. Cause-specific mortality rates in sub-Saharan Africa and Bangladesh. Bull World Health Organ. 2006; 84: 181–8. 10.3402/gha.v5i0.19073.
- Barnett AG, Tong S, Clements AC. What measure of temperature is the best predictor of mortality?. Environ Res. 2010; 110: 604–11. 10.3402/gha.v5i0.19073.
- Hales S, Salmond C, Town GI, Kjellstrom T, Woodward A. Daily mortality in relation to weather and air pollution in Christchurch, New Zealand. Aust N Z J Public Health. 2000; 24: 89–91. 10.3402/gha.v5i0.19073.
- Armah GE, Gallimore CI, Binka FN, Asmah RH, Green J, Ugoji U, et al.. Characterisation of norovirus strains in rural Ghanaian children with acute diarrhoea. J Med Virol. 2006; 78: 1480–5. 10.3402/gha.v5i0.19073.
- Drayna P, McLellan SL, Simpson P, Li SH, Gorelick MH. Association between rainfall and pediatric emergency department visits for acute gastrointestinal illness. Environ Health Perspect. 2010; 118: 1439–43. 10.3402/gha.v5i0.19073.
- Ye Y, Zulu E, Mutisya M, Orindi B, Emina J, Kyobutungi C. Seasonal pattern of pneumonia mortality among under-five children in Nairobi's informal settlements. Am J Trop Med Hyg. 2009; 81: 770–5. 10.3402/gha.v5i0.19073.
- Leimkugel J, Forgor AA, Dangy JP, Pfluger V, Gagneux S, Hodgson A, et al.. Genetic diversification of Neisseria meningitidis during waves of colonization and disease in the meningitis belt of sub-Saharan Africa. Vaccine. 2007; 25(Suppl 1):A18–23. 10.3402/gha.v5i0.19073.
- Leimkugel J, Hodgson A, Forgor AA, Pfluger V, Dangy JP, Smith T, et al.. Clonal waves of Neisseria colonisation and disease in the African meningitis belt: eight-year longitudinal study in northern Ghana. PLoS Med. 2007; 4: e101.10.3402/gha.v5i0.19073.
- Scovronick N, Armstrong B. The impact of housing type on temperature-related mortality in South Africa 1996–2015. Environ Res. 2012; 113: 46–51. 10.3402/gha.v5i0.19073.
- Almeida SP, Casimiro E, Calheiros J. Effects of apparent temperature on daily mortality in Lisbon and Oporto, Portugal. Environ Health. 2010; 9: 12.10.3402/gha.v5i0.19073.
- O'Neill MS, Hajat S, Zanobetti A, Ramirez-Aguilar M, Schwartz J. Impact of control for air pollution and respiratory epidemics on the estimated associations of temperature and daily mortality. Int J Biometeorol. 2005; 50: 121–9. 10.3402/gha.v5i0.19073.