
 ?Mathematical formulae have been encoded as MathML and are displayed in this HTML version using MathJax in order to improve their display. Uncheck the box to turn MathJax off. This feature requires Javascript. Click on a formula to zoom.
Abstract
Background
While quality of life (QoL) has long been an explicit policy goal for international development programmes, no instruments have specifically been developed for measuring health-related QoL in resource-limited settings. The aim of this study was to develop and validate a QoL instrument for use in international aid and development programmes and to assess factors associated with QoL among youth participating in a civic engagement project in Kampala.
Design
Using systematic random sampling, data were collected on 663 participants aged between 13 and 24 years in Kampala. The QoL questionnaire included 36 questions divided into a two-part scale: 18 questions rated for satisfaction (Part 1) and 18 other questions rated on importance (Part 2). The total sample was randomly divided into two split-half samples: one for the exploratory factor analysis (EFA; N=310) and the other for the confirmatorty factor analysis (CFA; N=353). The effect of demographic, socio-economic, and lifestyle factors on QoL was assessed using linear regressions.
Results
The EFA yielded three factors: living conditions and lifestyle (seven items, α=0.84), social relationships (five items, α=0.86), and personal independence (five items, α=0.76). In the CFA, the initial model demonstrated a poor to marginal fit model. Its re-specification by examining modification indices resulted in a good model fit: Comparative Fit Index=0.95, Root Mean Square Error of Approximation=0.06, and p of Close Fit >0.05. The model incorporating perceived importance had lower Akaike Information Criteria and Bayesian Information Criteria values than the unweighted model, thereby providing very strong support to weight satisfaction scores with importance ratings when measuring QoL in Uganda. Poor QoL was associated with poor educational attainment, drug and substance misuse, and family disruption.
Conclusions
The findings suggest that there is a relationship between QoL and lifestyle and structural issues among youth in Uganda. The study provides the first validated QoL measure to allow government and non-government organisations in low- and middle-income countries to track progress of international aid and development programmes.
Introduction
Although the concept of ‘quality of life’ (QoL) was a subject of discussion in Plato and Aristotle's works (Citation1, Citation2), research on QoL did not dominate the literature as a separate area of research until the 1960s. Since then, research on QoL has grown exponentially and the concept has been embraced in various research fields including sociology, economics, psychology, political science but predominantly in the field of health care and service delivery in industrialised countries (Citation3). However, there have been controversies related to scales used in QoL measures, with the debate centring around whether satisfaction with life scores should be weighted for importance rating/ranking. Various research studies have proposed that it is undesirable and unnecessary to weight satisfaction scores by importance ratings (Citation4, Citation5). Using different internationally known weighting algorithms, various researchers have found that importance ratings did not moderate the relationship between satisfaction scores and the overall life satisfaction (Citation5–Citation7). These studies theorise that satisfaction ratings already take into account the importance of the item, and therefore weighting satisfaction scores by importance rating/ranking is redundant (Citation5).
In contrast, some authors stipulate that individuals perceive some aspects of their life to be more important, or to carry more weight, than others, and hence aspects of life are not of equal importance to all respondents in a survey and in any settings (Citation8–Citation10). They argue that by summing or averaging satisfaction scores across all QoL items, one implicitly assumes equal weight among items which is somewhat counterintuitive (Citation10). In a series of studies, Hsieh (Citation10–Citation12) has consistently shown the merit and the need to weight satisfaction scores by importance rating/ranking.
However, most of the above studies have predominantly been carried out in industrialised countries without taking into account the cultural relativity of the QoL concept (Citation13, Citation14). In industrialised countries where autonomy and independence are the main features, a high QoL equates to individual success, achievement, self-actualisation, and self-respect (Citation13). In contrast, collectivist cultures found in low- and middle-income countries (LMICs) value interdependence, fulfilling roles within a group individuals belong to, and loyalty (Citation14). In these cultures, a high QoL is constructed much more in family and group terms (Citation13). Therefore, the assumptions that govern QoL and the importance attached to specific life events in one culture may not hold in another, thus highlighting the need to further test whether weighting satisfaction scores by importance rating is desirable across different cultural settings (Citation13).
The relevance of the cultural relativity of the QoL concept in LMICs is of great magnitude. While QoL has long been an explicit or implicit policy goal for international aid and development programmes (Citation15), tracking the effectiveness of such programmes has relied on high order composite indicators which were never intended for this purpose. These include the United Nations Human Development Index, the country's economic growth such as per capita gross domestic product, standard of living or the millennium development goals with some serious drawbacks (Citation16). Challenges include the selective definition of goals, definition of targets that are hardly ambitious, one-dimensional definition of poverty as a determinant of poor QoL, methodical problems in measuring poverty, quantity ahead of quality, blindness towards distribution issues, and above all, the focus on the South accountability to the North without commensurate measurable goals for the North (Citation16).
A QoL measure for use in development aid programmes is urgently needed. The application of QoL scales in resource-poor settings has been limited for several reasons. The KIDSCREEN, DISABKIDS, EQ-5D-Y, and the Pediatric Quality of Life Inventory PedsQL are available only in few European languages and are yet to be validated in resource-poor settings, thus cross-cultural research is precluded (Citation17). Similarly, the appropriateness of the World Health Organization Quality of Life (WHOQOL-BREF) for use among youth has been questioned, as its development was almost based on adults or adult patients, and discussions about its applicability and/or validation in children and adolescents are scarce (Citation18). Some authors have called for the development of a new adolescent version of the WHOQOL (Citation19).
Notwithstanding its limitations, the WHOQOL-BREF has been administered in LMICs with mixed results. Some of the questions, mainly pertaining to sex life, pain, and medication dependence, have been found to be culturally inappropriate among youth in Taiwan, attracting significant missing data and/or poor performance (Citation18). Likewise, the three items measuring ‘pain and discomfort’, ‘medication required in everyday life’, and ‘negative feelings like anxiety and depression’ performed poorly among Indian children and the author suggested that such items should be dropped in future research (Citation20). The environmental domain performed poorly, scoring the lowest among youth in India (Citation20) and China (Citation21). In Bangladesh, the WHOQOL-BREF physical and social relationships had poor internal consistency, with Cronbach alpha of 0.59 and 0.28, respectively (Citation22). Recently, Paltzer et al. (Citation23) found that, of the seven instruments that measure health-related QoL of young children, six have been used in resource-limited settings. However, they found that no instruments have specifically been developed for measuring health-related QoL among young children in resource-limited settings.
Therefore, for most LMICs, customised QoL measures need to take into account the structural issues that negatively affect the QoL of the population including structural poverty characterised by the unequal distribution and acquisition of assets, culturally mediated social relations and support, deprivation and unemployment due to lack of skills and poor access to vocational training programmes, and poor access to health and social services. The current study sought to develop a QoL instrument that addresses these issues as part of the baseline survey for the ‘Urban Program on Livelihoods and Income Fortification and Socio-Civic Transformation for the Youth in Kampala Project’. Implemented by World Vision Uganda with the support from World Vision Australia and the Australian Government Department of Foreign Affairs and Trade, the aim of the project is to improve the QoL of 3,500 people aged 13–24 in two of the most disadvantaged and populous divisions of Kampala, Uganda. Therefore, the aim of the study was twofold: 1) to develop and validate QoL instrument appropriate to the Ugandan context and closely related to structural issues faced by youth and 2) to assess factors associated with QoL among youth in Kampala.
Methodology
Operational definition and study setting
The Constitution of Uganda defines a youth as any person aged between 18 and 30 years, whereas the Ugandan Ministry of Gender, Labour, and Social Development uses the ages of 12 through 30 years in its various youth programmes (Citation24). In contrast, the International Labour Organization (ILO) defines a youth as any individual in the 15–24 year age bracket (Citation25). Therefore, for the purpose of our study, we defined a youth as any person aged between 13 and 24 years to take into account the ILO's definition and the Ugandan contextual reality.
The study was carried out in Makindye and Nakawa Divisions of Kampala City, Uganda, which has one of the youngest and the fastest growing population in Africa, with its population estimated at 35.5 million. More than three quarters (78%) are aged below 30 years (Citation26). Despite the Ugandan youth making up the largest proportion of the population, they are mostly unproductive, with youth unemployment rates of 61.6% among the highest in Africa (Citation27, Citation28). The low employment opportunities outside the capital Kampala attract a huge number of youth to the city in search of work. Almost 46% of the 1,723,300 people living in the city of Kampala reside in Nakawa and Makindye (Citation29), which are the two divisions in which the project is being implemented. Since the past two decades, the two divisions have been characterised by high unemployment in tandem with a high dependence burden and rampant crimes (Citation30), which present strong barriers to youth participation in community programmes and negatively affect their well-being. The study was approved by the Monash University Human Research Ethics Committee (approval no. CF16/1001-2016000532).
Study design, sampling strategy
A cross-sectional survey was carried out in July 2014. The Kampala City Council is composed of divisions, and each administrative division is made of parishes, divided into zones. A list of all zones within the parishes of the Makindye and Nakawa divisions was established for sampling purposes. Our sampling unit within a zone was a household. A list of households in each of the zones was constructed with the help of the local council representatives (known as LCs), and from the list, a household was selected using a systematic sampling approach.
Households in each zone were given a unique identification number. Given that zones varied in size, the number of households to be surveyed in each zone was proportional to each size. The sampling interval (X) was determined by dividing the total number of households in each zone with the expected sample size, and the first household to be surveyed was randomly selected by choosing a number between I and X. The next household to be visited was selected by adding X to the first randomly selected number and the process continued until the required sample size for that zone was obtained. Hence, for each selected household, a person aged 13–24 took part in the study, and the interview occurred outside the home away from the rest of household members. In the case of a household having more than one eligible participant, the interviewer randomly selected one participant to be included in the study. If the selected household was not inhabited or no one was at home, the closest neighbouring household was used for the survey.
Sample size and data collection
Given that employment status is closely associated with QoL, the prevalence of unemployment was used to determine our sample size. While obtaining accurate data on unemployment among youth in Uganda is a daunting task, available data suggest that youth unemployment rates vary between 34 and 83% (Citation31, Citation32). For the purpose of sample size calculation, a prevalence of 40% was used. With a total population base from which to draw our sample of approximately 793,000 (average household size=5 and % of people aged 13–24 years=30%) (Citation33) accepting a margin of error of 5% with 99% confidence interval, we estimated that we would need to obtain data on 637 participants.
Training enumerators and governance
Data were collected by 12 trained enumerators, who were supervised by four experienced field coordinators to monitor quality control. Data enumerators, who were bilingual (English and Luganda), were trained over 3 days followed by a field-testing of the questionnaire prior to data collection to ascertain its cultural appropriateness. The training covered sampling technics, interview techniques, and ethical issues including confidentiality and respect, and bilingual workers’ familiarisation with the questionnaire. Bilingual workers administered the survey in English. The research implementation was overseen by a steering committee comprising four staff from World Vision, four field coordinators, and representatives from youth organisations. The steering committee commented on the questionnaire including the fine-tuning of the questionnaire for clarity and cultural appropriateness, and approved all research processes.
Measures
QoL
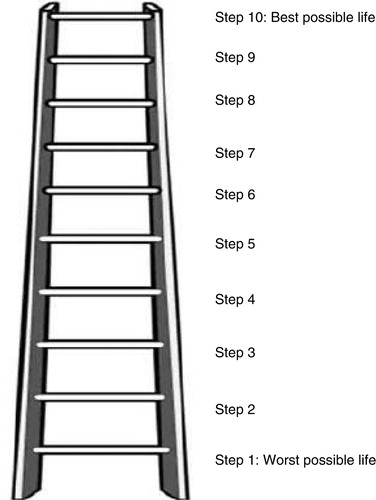
The QoL questionnaire included 36 questions divided into a two-part scale (Appendix 1). That is, 18 questions were rated for satisfaction (Part 1) and 18 other questions rated on importance (Part 2). The questionnaire used Likert-scaled responses as follows: satisfaction: 1=very dissatisfied, 2=dissatisfied, 3=neither dissatisfied nor satisfied, 4=satisfied, and 5=very satisfied; importance: 1=not at all important, 2=somewhat important, 3=important, 4=very important; and 5=indispensable. Five questions were adapted from the WHOQOL-BREF (Citation20): 1) housing conditions, 2) health services, 3) transportation, 4) sex life, and 5) personal safety. Additional questions were formulated to address the collective nature of social relationships [i.e. 1) the number of friends young people have, 2) how they get along with their friends, 3) how they get along with their family, 4) how they get along with non-relatives they live with, and 5) how they get along with non-relatives they do not live with]; access to and control over financial resources [i.e. 1) the amount of money young people have and 2) the amount of control they have over their money]; structural poverty and deprivation [i.e. 1) the work opportunities/career options, 2) the neighbourhood environment, 3) access to food, and 4) clothing]; and the use of time [i.e. the way young people spend their time]. Finally, a single-item well-being measure was included to assess concurrent construct validity. The item asked participants to rank themselves on a well-being ladder as follows: ‘Assume that a ladder with 10 steps is a way of picturing your life. Step 1 and the bottom of the ladder means the worst possible life for you. Step 10 and the top of the ladder means the best possible life for you. On the ladder, which step do you feel represents where you currently are in life (please circle)’.
Demographic, socio-economic, and lifestyle factors
A series of questions were administered as part of the survey to obtain background information on each participant. Data were collected regarding child age (in years), child gender (coded 0=female, 1=male), educational attainment (in years), marital status (coded 0=single/never married, 1=married, 2=cohabitation, 3=divorced/separated, and 4=widow/widower), living structure (coded 0=living with mother and father, 1=living with mother only, 2=living with father only, 3=parents are alive but living alone, 4=parents not alive, living with relative, 5=parents not alive, living with non-relative families, 6=parents not alive, living with friends, and 7=my parents are alive but live with other relatives), monthly income (in Ugandan Shillings-UGX), whether they have a disability (coded 0=no and 1=yes), whether they have attended any vocational training (coded 0=no and 1=yes), and employment status (coded 0=paid employment on a salary, 1=self-employed, 2=still at school, 3=volunteering or doing unpaid work; 4=unemployed: no structured activities, and 5=other, mainly commission based). The study also collected data on lifestyle factors including drug and substance misuse. Participant answered yes or no on questions related to smoking cigar, cigarette, shisha, or marijuana; chewing khat; khuber or smokeless tobacco; taking heroin; taking sedatives or stimulants; and sniffing paint, petrol, or glue.
Statistical analysis
The QoL satisfaction scales were subjected to exploratory factor analysis (EFA) to determine the factor structures and confirmatory factor analysis (CFA) to provide the evidence for the factor structures using Amos 21.0 (SPSS, Chicago, IL, US). The total sample was randomly divided into two split-half samples (Sample 1, N=310; Sample 2, N=353). Various researchers have suggested that using one sample for the EFA and the other sample for the CFA is sufficient to confirm both the reliability and goodness of fit of any theory-based measures using structural equation modelling (SEM) (Citation34).
In the EFA for sample I, standard procedures of principal component analysis (PCA) with Varimax rotation was used to determine the factor structure. The number of factors retained was determined by the Scree test, and the factor was determined using the Eigen values greater than 1, and item loadings ≥0.4 on a factor were considered to be robustly associated with that factor and those with loading <0.4 were considered weak (Citation35). The Kaiser–Meyer–Olkin (KMO) index was used to measure the homogeneity of variables and to check if the data were suited for factor analysis, with KMO >0.60 used as a cut-off point to confirm the suitability of factor analyses (Citation36). Cronbach alpha was computed to assess the internal consistency reliability of the scales. The following cut-off points were used to interpret Cronbach alpha: α≥0.9=excellent, 0.7≤α< 0.9=good, 0.6≤α<0.7=acceptable, 0.5≤α≤0.6=poor, and α<0.5=unacceptable (Citation37).
In the CFA for sample II, maximum likelihood estimation (Citation38) was used to validate the factor structure. The following indices and associated cut-off points were used to evaluate the model and to indicate a good fit (Citation39): the chi-square associated with each degree of freedom (CMIN/DF) <3, the Goodness of Fit (GFI), Comparative Fit Index (CFI), Normed Fit Index (NFI), and Tucker Lewis Index (TLI)≥0.90, Root Mean Square Error of Approximation (RMSEA)≤0.08, and p of Close Fit (PCLOSE) >0.05. Concurrent validity was determined using two approaches. First, the QoL factors were correlated between them. We expected a high correlation between QoL component scores. The second approach assessed concurrent validity by examining the correlation between QoL scores and scores of the one single-item ranking well-being on a ladder.
Once the factors were confirmed and their psychometric properties established based on the ‘satisfaction’ scale, they were weighted for importance rating (Citation40). The subscale scores were weighted based on Ferrans and Powers’ algorism (Citation41). The first stage involved weighting satisfaction scores at item levels. The satisfaction score was centred to zero by subtracting three from satisfaction responses for each item (and the scale became −2, −1, 0, +1, +2). The next stage involved multiplying centred satisfaction response with the paired raw importance response (scored 1–5) for each item, giving a possible range for scores from –10 to +10. Finally, to eliminate any negative values for the final score, we added 10 to every item score to produce a possible range from 0 to +20. In order to make the scores easy to interpret, the total weighted subscale scores, together with the single-item well-being measure, were rescaled to a 100 point scale, from 0 (poor QoL or poor well-being) to 100 (perfect QoL or well-being) using the following formula (Citation40):
Prior to undertaking planned analyses, the distribution of scores on each satisfaction and importance scaling variable was assessed by calculating mean, standard deviation, skewness, and kurtosis values. The normal distribution of the data was established using Kline's (Citation42) proposed cut-off points of <3.0 for skewedness and <8.0 for kurtosis. Correlations of item satisfaction and item importance, and the Akaike Information Criteria (AIC) and the Bayesian Information Criteria (BIC) were used to assess whether weighting for importance rating matters in the Ugandan context (Citation43).
The ‘fitstat’ command in Stata was used to compute the AIC and BIC to compare models (weighted vs. unweighted for importance), with the larger difference in either AIC or BIC indicating stronger evidence for one model over the other (i.e. the better model has lower AIC and/or BIC values). The effect of demographic, socio-economic, and lifestyle factors on unweighted and weighted QoL scores was assessed using linear regressions. The univariate analyses were screened to identify variables to be included in the multiple linear analyses and all variables whose p-value approached significance at 10% underwent multiple regression analyses (Citation44). However, the level of statistical significance for establishing an association was set at a probability of p<0.05 for all tests.
Results
Demographic characteristics
The demographic and socio-economic characteristics are summarised in for each split-half sample. The two split-half samples did not differ significantly on the study variables, except for gender. The majority of the sample (81.1%) were single or never married, which is consistent with study's age target. Only a quarter of participants (24.9%) lived in a nuclear family, while 24.6% lived in a single-parent household and 23% lived alone. Only 20.3% of participants were in the workforce as employees and about one in ten (8.8%) youth reported drug and substance misuse ().
Table 1 Demographic characteristics of the two split-half samples and testing for differences in the study variables
Construct validity and reliability
The KMO coefficient was 0.90 and Bartlett's Sphericity test was found to be significant ![]() =2475.9, p<0.001), indicating factor analyses was justified. Data from the EFA are summarised in . The principal component factor analysis of the 18 items on satisfaction with Varimax rotation method yielded three factors: living conditions and lifestyle (seven items, α=0.84), social relationships (five items, α=0.86), and personal independence (five items, α=0.76). The items loaded well on their respective subscales (a minimum item loading of 0.51), with Eigen values greater than 1 (6.95 for living conditions and lifestyle, 1.89 for social relationships, and 1.25 for personal independence). The extraction of the two factors accounted for 56% of the total variance. However, the item ‘How satisfied are you with your neighbourhood as a place to live in?’ cross-loaded on all three factors (loading of 0.31 for factor 1, 0.36 for factor 2, and 0.38 for factor 3) and was subsequently deleted.
=2475.9, p<0.001), indicating factor analyses was justified. Data from the EFA are summarised in . The principal component factor analysis of the 18 items on satisfaction with Varimax rotation method yielded three factors: living conditions and lifestyle (seven items, α=0.84), social relationships (five items, α=0.86), and personal independence (five items, α=0.76). The items loaded well on their respective subscales (a minimum item loading of 0.51), with Eigen values greater than 1 (6.95 for living conditions and lifestyle, 1.89 for social relationships, and 1.25 for personal independence). The extraction of the two factors accounted for 56% of the total variance. However, the item ‘How satisfied are you with your neighbourhood as a place to live in?’ cross-loaded on all three factors (loading of 0.31 for factor 1, 0.36 for factor 2, and 0.38 for factor 3) and was subsequently deleted.
Table 2 Factor loadings, item means, standard deviation (SD), and Cronbach alpha coefficients for the two split-half samples
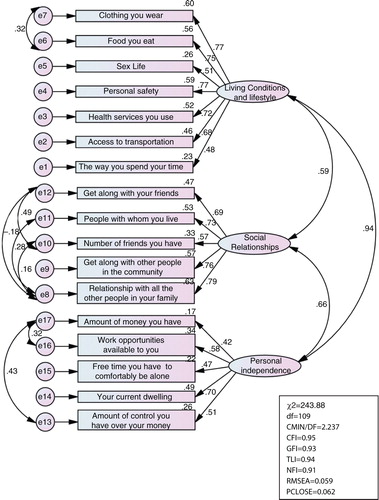
Data from the CFA are summarised in and . The findings suggest that the initial model () demonstrated a poor to marginal fit model. The initial model was respecified by examining modification indices (), resulting in a good model fit: CMIN/DF=2.24, CFI=0.95, TLI=0.94; NFI=0.91; RMSEA=0.06; SRMR=0.027, PCLOSE>0.05. The single-item ranking well-being on the ladder was also highly correlated with the QoL components, hence demonstrating a strong concurrent validity. It had a correlation coefficient 0.21 (p<0.001) with living conditions and lifestyle, 0.30 (p<0.001) with social relationships, and 0.11 (p<0.01) with personal independence. The three QoL components were also highly correlated: living conditions and lifestyle was highly correlated with social relationships (r=0.65, p<0.0010) and personal independence (r=0.50, p<0.001), while personal independence was highly correlated with social relationship ships (r=0.48, p<0.001).
Fig. 1 Confirmatory factor analyses: initial non-respecified model.
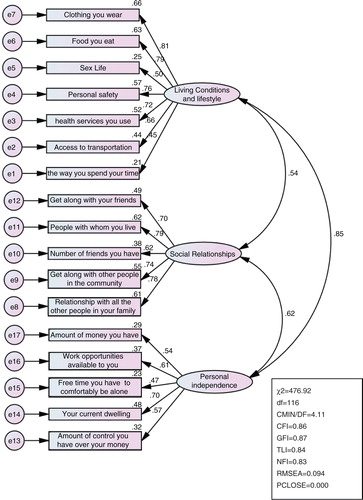
Fig. 2 Confirmatory factor analyses: respecified model.
Data distribution
Data presented in Table and 4 suggest that the skewness and kurtosis values for individual satisfaction items varied from −1.28 to 1.35 and −0.52 to 5.02, respectively. For individual importance items, the values varied from −1.06 to −0.61 for skewedness and 2.73 to 4.46 for kurtosis. The computed subscales had values varying from −1.16 to 0.73 for skewness and 2.59 to 5.11 for kurtosis (). These values indicate that there was no evidence of univariate non-normality and parametric testing was justified.
Table 3 Means, standard deviations (SD), skewness, and kurtosis for satisfaction and importance ratings on each item and correlation between satisfaction and importance items (N=663)
Table 4 Minimum, maximum, means, standard deviations (SD), skewness, and kurtosis for derived subscales (N=663)
Relevance of incorporating perceived importance into the quality of life measure
Correlations of item satisfaction and item importance are summarised in Table and 4 , which were all significant at p<0.001 and ranged from 0.23 to 0.52. The AIC and BIC results are summarised in . The model incorporating perceived importance had lower AIC and BIC values than the unweighted model, hence providing very strong support for the weighted model. The univariate linear regression analyses (unweighted vs. weighted satisfaction scores) examining the effect of demographic, socio-economic, and lifestyle factors on QoL are summarised in Appendix 1.
Table 5 Results for model comparison between weighted and unweighted for importance
How satisfied are you with:
How important to you:
Univariate analyses of the effect of demographic, socio-economic, and lifestyle factors on quality of life: rescaled, unweighted satisfaction scores vs. rescaled satisfaction scores, weighted for importance
The multiple linear regression analyses are summarised in using the unweighted scores in the regression on living conditions and lifestyle, the effect of disability, marital status, and employment, which were significant in the univariate linear regression analyses (Appendix 2), became non-significant. However, the effect of drug and substance use, family structure, and educational attainment remained significant. That is, poor living condition and lifestyle remained consistently and significantly associated with drug and substance misuse (β=−11.78, p<0.001), living with a single mother (β=−8.36, p<0.001), and leaving home to live alone (β=−6.99, p<0.01). In contrast, living conditions and lifestyle scores were positively associated with educational attainment (β=0.61, p<0.01). When living conditions and lifestyle scores weighted for perceived importance were used, the pattern was more robust, with marital status and being an orphan remaining significant as they were in the univariate model, hence providing evidence of the advantage for using weighted scores.
Table 6 Multivariate analyses of the effect of demographic, socio-economic, and lifestyle factors on quality of life: rescaled, unweighted satisfaction scores vs. rescaled satisfaction scores, weighted for importance
In terms of social relationships, the multiple linear regression analyses () found that the effect of disability using both unweighted and weighted scores and unemployment status using the weighted scores, which were significant in the univariate linear regression analyses (Appendix 2), became non-significant. However, the effect of educational attainment, drug and substance use, and family structure remained consistent. That is, in the regression on unweighted scores, poor social relationships were negatively associated with drug and substance misuse (β=−8.53, p<0.001), living with a single mother (β=−4.70, p<0.05), and running away from home to live alone (β=−5.39, p<0.05), while educational attainment was positively associated with social relationships scores. This pattern remained consistent in the regressions on the scores weighted for importance ().
In terms of personal independence, the multiple linear regression analyses () found that the effect of age, monthly income, educational attainment, and family structure, which were significant in the univariate linear regression analyses (Appendix 2), became non-significant. However, personal independence scores were consistently positively associated with being in a cohabiting relationship (β=8.11, p<0.01), but low personal independence was significantly associated with living with a single mother (β=−7.35, p<0.01), volunteering or undertaking unpaid work as the sole mode of employment (β=−7.08, p<0.05), and being unemployed (β=−17.31, p<0.05). The regression on scores weighted from importance () produced a similar pattern except for marital status, which became insignificant.
Discussion
The aim of the study was to develop and validate a QoL instrument for use among youth and appropriate to the Ugandan context, and to assess factors associated with QoL among youth in Kampala. Our findings support a good model fit with strong concurrent validity, and suggest that using satisfaction scores weighted for importance rating provides a more robust and extended pattern of the relationship between living conditions and lifestyle and health determinants than unweighted scores. The need to weight satisfaction scores with importance ratings is further supported by the strong correlations between item satisfaction and item importance and AIC and BIC values. While our findings support Hsieh's (Citation11, Citation12) overall findings, they do not support those suggesting non-significant correlations between item satisfaction and item importance (Citation4, Citation5) (Citation7, Citation45). Interestingly, none of these studies reported models fit, hence underscoring the novelty of our findings.
These inconsistent results in the literature could be explained by three major factors: failing to test for model fit, the cultural relativity of the QoL concept, and methodological differences. Most of the studies described above were undertaken in various settings where there exist cultural differences in values attached to specific social aspects of life, traditions, societal standards as well as customs. Existing methods of measuring QoL may not be adequate to capture important differences across cultures, especially as people may conceptualise QoL facets by drawing from their lived experiences and cultural norms (Citation46). For example, Heady and Wearing (Citation47) found that Northern Europeans (Danes, Swedes, Swiss, Norwegians), Dutch, Irish, and Australians reported higher levels of well-being than Japanese, Greeks, Italians, Spanish, and French. The authors attributed these differences to variations in cultural norms, equality, the level of democracy, and affluence. Similarly, measures of QoL across cultures have not used the same items, used different population (sick vs. healthy participants), and used different analytical approaches (Citation5, Citation9–Citation12, Citation19) (Citation45, Citation48) making difficult to compare studies and results. Notwithstanding these limitations, our study demonstrate that the need to weight satisfactions scores with importance rating needs to be context specific to account for cultural influences and contextual backgrounds. The study also demonstrates that it is possible to incorporate QoL measure in development aid programmes.
We found that QoL among youth in Kampala was positively associated with educational attainment but negatively associated with employment status. The universal primary and secondary education policies in Uganda continue to increase access to education, (Citation49, Citation50) but there is a mismatch between the skills youth are attaining at school and requirements in the job market. The Ugandan education system is theoretical, with little practice (Citation51). Therefore, youth with low educational attainment find it difficult to find a job, and if they get employed they found themselves in low-quality, informal, insecure, and casual jobs with unstable wages. Employers prefer graduates of ordinary level or high school because they are affordable, do not demand higher salaries, can do the work with minimum training, and are quick learners that adapt to any work, and above all can tolerate unfavourable employment conditions. All these factors combine to affect their QoL and well-being. It is possible that high educational attainment in Uganda is associated with non-alienated work, better economic resources, and high personal control, factors known to be associated with better QoL (Citation52).
Our findings suggest a close relationship between marital status and QoL. Cohabitation was associated with better QoL than being single/never married. The companionship provides a sense of security and emotional satisfaction, better financial security, and shared responsibilities. These findings are consistent with the literature suggesting that individuals in cohabiting relationships have better QoL and well-being than single/never married individuals (Citation53).
We found that poor QoL was associated with drug and substance misuse among youth, which is consistent with the current literature. For example, Zullig and colleagues (Citation54) examined the relationship between perceived life satisfaction and selected substance use behaviours among high school students. They found that factors significantly associated with reduced life satisfaction were cigarette smoking, chewing tobacco, marijuana, cocaine, regular alcohol use, binge drinking, injection drug, and steroid use. Similarly, Topolski et al. (Citation55) explored the association between health-risk behaviours and self-perceived QoL among adolescents. They found that adolescent who engaged in one or multiple risk behaviours reported poorer QoL than abstainers.
We found that poor QoL was associated with living with a single mother and running away from home. Research from Africa suggests that single-parent families, especially single-mother-headed families, experience extreme poverty, exacerbated by inadequate public assistance, lower earning capacity, and lack of principal care subsidies which predispose them to a number of stressors (psychological difficulties, inadequate childcare, and social and financial stress) (Citation56, Citation57). The consequence of such stress is the downward spiral of family disintegration (Citation56, Citation57). Similarly, regardless of the family structure, a significant number of children run away from home to escape poverty, family-level child labour and abuse, family problems, and child neglect to live on the street and/or with friends (Citation58). Therefore, coping with the circumstances of family poverty and disruption affects the QoL of the affected families, especially as children from single-mother-headed families and those running away from home. They are more likely drop out of school, to be idle out of school as well as work, to use drug and other illicit substances, and to engage in juvenile delinquency than those from nuclear families (Citation59).
Conclusions
The study provides evidence of the reliability and validity of the QoL tool which can be used to influence decisions in international aid and development interventions in resource-poor settings. It presents a number of opportunities to test theories of change to improve the effectiveness of international aid and development programmes in improving QoL. Currently, World Vision Uganda is using the tool in development programmes among youth in Kampala, to monitor the effectiveness of the ‘Urban Program on Livelihoods and Income Fortification and Socio-civic Transformation for the Youth in Kampala Project (UPLIFT)’ in improving QoL among youth, with the view of scaling it up across its programmes. The study methodology and findings demystify the measurement of the QoL in poor resourced areas with similar characteristics and also demonstrate that international aid and development programmes that seek to improve the QoL can confidently identify and attribute their contribution.
Paper context
• Research on quality of life (QoL) has grown exponentially over the last four decades. However, existing instruments have predominantly focused on health-related dimensions in industrialised countries.
• While QoL has long been an explicit policy goal for international development aid programmes, no instruments have specifically been developed for measuring the effectiveness of international development aid programmes.
• The current study developed and validated a QoL instrument for use in international aid and development programmes. Our findings provide very strong support to weight satisfaction scores with importance ratings when measuring QoL in Uganda.
• This validated QoL measure will allow government and non-government organisations in LMICs to track progress of international aid and development programme.
Authors’ contributions
AR conceptualised and led all aspects of the study, analysed the data, and led the manuscript. JK contributed to the design and delivery of the project including review of evaluation tools and supervision of data collection. GK contributed to the design of project and evaluated the study materials. All authors contributed to the development and write up of this manuscript, reviewed drafts of the manuscript, and approved the final version.
Conflict of interest and funding
The authors declare that they have no competing interests. The study was funded by World Vision Australia as part of its ongoing planning of development projects in low- and middle-income countries.
Acknowledgements
Professor Andre Renzaho is supported by an Australian Research Council Future Fellowship (FT110100345). We would like to acknowledge the steering committee (Joseph Kamara, Allen Amanya, Barbara Mirembe Namugambe, Loyce Mugisa, Robert Egessa) for helping with the implementation of the study. We also acknowledge the field coordinators and bilingual workers for helping with community mobilisation, especially Fiona Ibanda, Donah Sekitoleko, Muhairwe Celia, Jesse Tamale.
Related Research Data
References
- Taylor AE. Plato: the man and his work. 2001; New York: Courier Dover.
- Aristotle.McKeon R. Nicomachean ethics. The basic works of Aristotle. 1941; Trans: Ross WD. New York, NY: Random House. 927–1112.
- Schalock RL. Three decades of quality of life. Focus Autism Other Dev Disabl. 2000; 15: 116–27.
- Trauer T, Mackinnon A. Why are we weighting? The role of importance ratings in quality of life measurement. Qual Life Res. 2001; 10: 579–85. [PubMed Abstract].
- Wu C-H, Yao G. Do we need to weight satisfaction scores with importance ratings in measuring quality of life?. Soc Indicat Res. 2006; 78: 305–26.
- Mobley WH, Locke EA. The relationship of value importance to satisfaction. Organ Behav Hum Perform. 1970; 5: 463–83.
- McFarlin DB, Coster EA, Rice RW, Cooper AT. Facet importance and job satisfaction: another look at the range-of-affect hypothesis. Basic Appl Soc Psychol. 1995; 16: 489–502.
- Chou S-C, Boldy DP, Lee AH. Measuring resident satisfaction in residential aged care. Gerontologist. 2001; 41: 623–31. [PubMed Abstract].
- Hsieh C-M. Using client satisfaction to improve case management services for the elderly. Res Soc Work Pract. 2006; 16: 605–12.
- Hsieh C-M. Counting importance: the case of life satisfaction and relative domain importance. Soc Indicat Res. 2003; 61: 227–40.
- Hsieh C-M. Incorporating perceived importance of service elements into client satisfaction measures. Res Soc Work Pract. 2012; 22: 93–9.
- Hsieh C-M. To weight or not to weight: the role of domain importance in quality of life measurement. Soc Indicat Res. 2004; 68: 163–74.
- Hofstede G. The cultural relativity of the quality of life concept. Acad Manag Rev. 1984; 9: 389–98. http://dx.doi.org/10.2307/258280.
- Triandis HC.Bagley C, Verma GK. Collectivism vs. individualism: a reconceptualization of a basic concept in cross-cultural psychology. (1986) Personality, Cognition and Values: Cross-cultural Perspectives of Childhood and Adolescence, Cross-cultural studies of personality, attitudes, and cognition London: Macmillan. 1988; 60–95.
- Kosack S. Effective aid: how democracy allows development aid to improve the quality of life. World Dev. 2003; 31: 1–22.
- Martens J. Thinking ahead development models and indicators of well-being beyond the MDGs. 2010; Berlin: Dialogue on Globalization.
- Solans M, Pane S, Estrada M-D, Serra-Sutton V, Berra S, Herdman M, etal. Health-related quality of life measurement in children and adolescents: a systematic review of generic and disease-specific instruments. Value Health. 2008; 11: 742–64. http://dx.doi.org/10.1111/j.1524-4733.2007.00293.x [PubMed Abstract].
- Chen K-H, Wu C-H, Yao G. Applicability of the WHOQOL-BREF on early adolescence. Social Indicat Res. 2006; 79: 215–34.
- Skevington SM, Dehner S, Gillison FB, McGrath EJ, Lovell CR. How appropriate is the WHOQOL-BREF for assessing the quality of life of adolescents?. Psychol Health. 2014; 29: 297–317. [PubMed Abstract].
- Agnihotri K, Awasthi S, Chandra H, Singh U, Thakur S. Validation of WHO QOL-BREF instrument in Indian adolescents. Indian J Pediatr. 2010; 77: 381–6. [PubMed Abstract].
- Wang X, Matsuda N, Ma H, Shinfuku N. Comparative study of quality of life between the Chinese and Japanese adolescent populations. Psychiatr Clin Neurosci. 2000; 54: 147–52.
- Izutsu T, Tsutsumi A, Islam A, Matsuo Y, Yamada HS, Kurita H, etal. Validity and reliability of the Bangla version of WHOQOL-BREF on an adolescent population in Bangladesh. Qual Life Res. 2005; 14: 1783–9. [PubMed Abstract].
- Paltzer J, Barker E, Witt WP. Measuring the health-related quality of life (HRQoL) of young children in resource-limited settings: a review of existing measures. Qual Life Res. 2013; 22: 1177–87. [PubMed Abstract].
- Ministry of Labour Gender and Social Development. National youth policy: a vision for youth in the 21st Century. 2001; Kampala: Ministry of Labour, Gender and Social Development.
- International Labour Organization. Boosting employment through public works: an ILO what works in youth employment knowledge sharing event report. 2014; Addis Ababa: ILO.
- Government of Uganda. 2013; Kampala: Population Secretariat. The state of Uganda population report 2013.
- AAU, DRT, UNNGOF. Lost opportunity? Gaps in youth policy and programing in Uganda. 2012; Kampala: Action Aid International Uganda.
- AfDB, OECD, UNDP, UNECA. Africa economic outlook: Uganda 2012. 2012; Tunis: Africa Development Bank.
- Babirye JN, Engebretsen IM, Makumbi F, Fadnes LT, Wamani H, Tylleskar T, etal. Timeliness of childhood vaccinations in Kampala Uganda: a community-based cross-sectional study. PLoS One. 2012; 7: e35432. [PubMed Abstract] [PubMed CentralFull Text].
- Dobson S, Muhammed L, Mugisa F. Negotiated planning: breaking the implementation impasse in Kampala. Paper prepared for presentation at the ‘Annual World Bank Conference on Land and Poverty’, The World Bank, Washington, DC, 2014. Available from: http://sdinet.org/wp-content/uploads/2015/04/Dobson_Lutwama_Mugisa.pdf [cited 12 March 2015].
- Action Aid International Uganda. Lost opportunity? Gaps in youth policy and programming in Uganda. 2012. Available from: http://www.actionaid.org/sites/files/actionaid/youthrepot-final_0.pdf [cited 12 July 2015].
- African Development Bank. Africa economic outlook: Uganda 2012. 2012; Tunis: Africa Development Bank.
- Nakawa City Division. Division development plan: 2011/12–2015/16. 2011; Kampala: Nakawa Division Budget Desk, Kampala Capital City Authority.
- Osborne JW, Fitzpatrick DC. Replication analysis in exploratory factor analysis: what it is and why it makes your analysis better. Practical Assess Res Eval. 2012; 17: 2.
- Costello A, Osborne J. Best practices in exploratory factor analysis: four recommendations for getting the most from your analysis. Practical Assess Res Eval. 2005; 10: 1–9.
- Tabachnick BG, Fiddell LS. Using multivariate statistics. 1996; New York: Harper Collins. 3rd ed.
- George D, Mallery P. SPSS for windows step by step: a simple guide and reference. 2003; Boston: Allyn & Bacon. 11.0 update. 4th ed.
- Bentler PM. EQS structural equations program manual. 1995; Encino, CA: Multivariate Software Inc..
- Hu LT, Bentler PM. Cutoff criteria for fit indexes in covariance structure analysis: conventional criteria versus new alternatives. Struct Equat Model. 1999; 6: 1–55.
- Cummins RA. Comprehensive quality of life scale – adult: manual. 1997; Geelong, Australia: Deakin University.
- Ferrans CE, Powers MJ. Quality of life index: development and psychometric properties. Adv Nurs Sci. 1985; 8: 15–24.
- Kline RB. Principles and practice of structural equation modeling. 2005; New York, NY: Guilford Press.
- Aho K, Derryberry D, Peterson T. Model selection for ecologists: the worldviews of AIC and BIC. Ecology. 2014; 95: 631–6. [PubMed Abstract].
- Kulkarni N, Pierse N, Rushton L, Grigg J. Carbon in airway macrophages and lung function in children. New Engl J Med. 2006; 355: 21–30. [PubMed Abstract].
- Skevington SM, O'Connell KA. Can we identify the poorest quality of life? Assessing the importance of quality of life using the WHOQOL-100. Qual Life Res. 2004; 13: 23–34. [PubMed Abstract].
- Foroughi E. Cross-cultural quality of life along Persians. 1995; Melbourne: Deakin University.
- Heady B, Wearing A. Understanding happiness: a theory of subjective well-being. 1992; Melbourne: Longman Cheshire.
- Wu C-H. Can we weight satisfaction score with importance ranks across life domains?. Soc Indicat Res. 2008; 86: 469–80.
- Chapman DW, Burton L, Werner J. Universal secondary education in Uganda: the head teachers’ dilemma. Int J Educ Dev. 2010; 30: 77–82.
- Nishimura M, Yamano T, Sasaoka Y. Impacts of the universal primary education policy on educational attainment and private costs in rural Uganda. Int J Educ Dev. 2008; 28: 161–75.
- Altinyelken HK. Pedagogical renewal in sub-Saharan Africa: the case of Uganda. Comp Educ. 2010; 46: 151–71.
- Ross CE, Van Willigen M. Education and the subjective quality of life. J Health Soc Behav. 1997; 38: 275–97. [PubMed Abstract].
- Dush CMK, Amato PR. Consequences of relationship status and quality for subjective well-being. J Soc Pers Relat. 2005; 22: 607–27.
- Zullig KJ, Valois RF, Huebner ES, Oeltmann JE, Drane JW. Relationship between perceived life satisfaction and adolescents’ substance abuse. J Adolesc Health. 2001; 29: 279–88. [PubMed Abstract].
- Topolski TD, Patrick DL, Edwards TC, Huebner CE, Connell FA, Mount KK. Quality of life and health-risk behaviors among adolescents. J Adolesc Health. 2001; 29: 426–35. [PubMed Abstract].
- Bigombe B, Khadiagala G. Major trends affecting families in sub-Saharan Africa. 2003; New York: United Nations. 164–87. United Nations Department of Economic and Social Affairs, ed. Major trends affecting families: a background document.
- Jones S. Singlehood for security: towards a review of the relative economic status of women and children in woman-led households. Soc Transit. 1999; 30: 13–27.
- Young L. The ‘place’ of street children in Kampala, Uganda: marginalisation, resistance, and acceptance in the urban environment. Environ Plann D. 2003; 21: 607–28.
- Sandefur G, McLanahan SS. Growing up with a single parent: what hurts, what helps. 1994; Cambridge: Harvard University Press.
Appendix 1 The Ugandan Youth Quality of Life index
Overall Life Satisfaction: single item to measure overall quality of life.
Assume that a ladder with 10 steps is a way of picturing your life (10-point Likert scale). Consider these steps represent a scale from 1 to 10 where step 1 represents the bottom of the ladder and means the worst possible life for you and step 10 represents top of the ladder and means the best possible life for you. On the ladder, which step do you feel represents where you currently are in life (please circle) …