
Abstract
Background
We describe a veterinary syndromic surveillance system developed in Sweden based on laboratory test requests.
Materials and methods
The system is a desktop application built using free software.
Results
Development took 1 year. During the first year of operation, utility was demonstrated by the detection of statistically significant increases in the number of laboratory submissions. The number of false alarms was considered satisfactory in order to achieve the desired sensitivity.
Discussion
Besides the demonstrated benefit for disease surveillance, the system contributed to improving data quality and communication between the diagnostic departments and the epidemiology department.
Examples of exploratory analysis of animal health data for syndromic surveillance have been multiplying rapidly in the last 5 years. There is large variation in the types of data and data sources utilized (Citation1). Most of the literature, however, still focuses on retrospective assessments of available data, and few implemented and running systems have been described in veterinary syndromic surveillance (Citation2). Governmental institutions and other surveillance practitioners are still left with the question of whether it is useful to implement syndromic surveillance, and what benefits they provide.
Surveillance of animal diseases is in many cases active, that is, programs exist enforcing the regular testing of animals or establishing other actions for data collection by governmental officials. This is in contrast to public health surveillance, which often relies solely on the passive collection of data from secondary sources. Despite the obvious surveillance benefits, active collection can be a challenge for automated analysis of animal health data, as animals can be examined/sampled for many reasons other than disease occurrence (Citation2).
We have previously described the development and implementation of two veterinary syndromic surveillance systems based on laboratory test requests (Citation3, Citation4). In Ontario, Canada, the research and data evaluation was promptly followed by system implementation because syndromic surveillance was a goal of both the data provider (the Animal Health Laboratory) and the government of the province (Ontario Ministry of Agriculture and Food). In Sweden, the National Veterinary Institute was both the data owner and the body funding the research and system implementation.
The latter system is more extensive, as it includes all animal species covered by the diagnostic capacity of the National Veterinary Institute. It is also a better example of how syndromic surveillance was developed inside an institution central to the surveillance activities carried out daily in a country. Methodological details concerning the data analysis have been previously described (Citation4). This paper aims to summarize 1 year of system operation, aiming at describing the operational structure of the system, the resources involved in maintaining the system, and the multiple ways by which it was possible to integrate the system into the organization's activities.
Operational details and data flow
The Swedish National Veterinary Institute (SVA) is an agency under the Ministry of Enterprise and is the largest and only official laboratory in veterinary medicine in the country. SVA not only provides diagnostic services to veterinarians, but also process samples collected as part of monitoring and surveillance programs, as well as commissioned research. Test requests are digitalized daily, and data and operations are managed by a laboratory information management system (LIMS) developed in-house. Data are managed and stored through Oracle databases.
Using the pre-existing structure available in the institution, the syndromic surveillance system was built requiring only a Windows®-based personal computer and two open-source software: RapidMiner community edition (Copyright 2001–2010 by Rapid-I and contributors) and R Development Core Team (Citation5). gives a schematic overview of the system.
Fig. 1 Overview of the syndromic surveillance system at SVA, from data to outputs. The three colored areas refer to the different computing environments used.
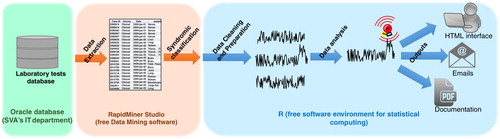
RapidMiner is a data-mining open-source software, which offers tools for data integration, analytical ETL (extract, transform, load), data analysis, and reporting. Data processing steps can be set using a user-friendly interface, and editing directly on XML codes is also possible. The Windows®'s Task Scheduler was used to set a RapidMiner process to run daily, at 4 am. This process extracts the most recent data of all laboratory submissions received in the previous day, directly from the Oracle database using an SQL query. Text mining and classification rules are then applied also within the process, in order to identify only those submissions related to passive diagnostic test requests sent by practicing veterinarians (excluding any diagnostic carried out as part of active surveillance or research), and classify records into syndromes for monitoring, as described in (Citation6, Citation4). A data set of all passive laboratory submissions from the previous days, properly classified into syndromes, is then saved as a comma separated value (‘.csv’) file.
Before closing the process, RapidMiner also runs a system command to source an R script. The R script is responsible for all the remaining tasks of the system (). Time series for each individual series are analyzed, and an alarm is generated if the number of laboratory submissions is considered high (see methods details below) for that day-of-week (or entire week) and time of the year. An email is sent to the system manager to assure that the analyses were successfully performed, and in case of an alarm all members of the Department of Epidemiology and Disease Control receive an email informing the occurrence. An html interface is available for users to review all data and analyses performed. A third documentation process is the generation of pdf reports of all alarms generated. A screenshot of the system interface is shown in , illustrated in a day when an alarm had been observed due to an increase in the number of laboratory submissions associated with respiratory syndromes in swine.
Fig. 2 Screenshot of the system interface, exemplifying an alarm due to an increase in the number of laboratory submissions associated with respiratory diseases in pigs.
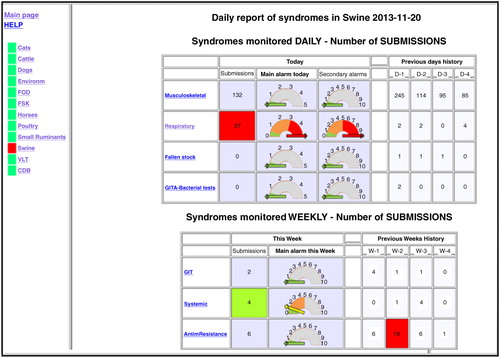
As shows, some syndromes are monitored daily. For those syndromes, before a new working day starts, algorithms compare the number of submissions received in the previous working day with historical data, and signal with a statistical score (shown as an ‘alarmometer’) how abnormal the number of submissions is. This score is based on summing the result of five detection limits for three different outbreak signal detection algorithms, as described in (Citation3). For some other syndromes, daily number of submissions is low and they are only monitored at the end of every week. Some yet have such low counts that monitoring is only performed when a new laboratory submission is received. For abortion in cattle, for instance, every time a case is observed, the system counts how many other submissions in cattle have been observed since the last case of abortion was detected, and decides if it is ‘too soon to be observing a new case of abortion’ (Citation7). shows all syndromes monitored, to give an idea of the scale of the system. It also indicates whether syndromes are monitored daily, weekly or as ‘counts between events’, the latter case explained.
Table 1 All syndromes monitored through syndromic surveillance at the Swedish National Veterinary Institute
The Department of Epidemiology and Disease Control has a telephone line to answer disease notifications from veterinarians in the field, available 24 h every day of the week. Alarms generated by the syndromic surveillance system are treated as notifications, and the person in charge of the line is responsible for following up the alarm, and deciding whether it is worth to trigger an investigation, or document the reasons why the alarm was believed to be false. This follow-up is discussed in detail under the topic of maintenance resources.
Development resources
The extra hardware and software costs were limited to a personal computer. One employee (postdoctoral) was hired exclusively for the development of the system. Full system development took 1 year, as follows:
One month of exploratory analysis of the historical data available (4 years of data).
Four months of developing text mining algorithms to recognize health keywords in each laboratory submission, and classify them into syndromes. This step can be considerably shortened if data are recorded in a more structured way, with less use of free text and increased use of standard codes. Moreover, lack of completeness in the data hindered automated separation of laboratory tests related to active monitoring versus passive laboratory submissions. As a result, text mining algorithms were also needed to perform such a separation.
Two months of retrospective analysis of the data, with special focus on time-series analysis and identification of characteristics of the time series that were relevant for monitoring.
Two months of selection and testing of algorithms for outbreak-signal detection.
Two months of testing the system with simulated data.
One month of testing the system in real time, before the system was considered fully implemented (the maintenance resources reported below refer to the first 12 months of operation after implementation, that is, following this 1 month testing).
Besides the salary of the dedicated employee, the following resources were estimated to be used during the development phase:
Help from IT personnel. The person responsible for maintenance of the Oracle database was requested to set up the connection through RapidMiner. Estimated person hours: total of 4 h during the entire first step of development.
Help from in-house diagnosticians. Diagnosticians were asked to help in the process of deciding which laboratory tests should be associated with the various clinical syndromes identified. The diagnosticians were provided with a suggested list of rules establishing these associations and were asked to check whether corrections were needed. They were also asked to meet in person with the system developer. Estimated person hours: 12 h (3 diagnosticians, each helping for 4 h) during the second step of development listed above.
Maintenance resources
shows the number of alarms detected in the first year of system operation, from May 2013 and May 2014 (260 working days and 52 weeks) for all syndromes monitored daily and weekly. As shown, the main cause of alarms in syndromes monitored daily is incomplete data entry. Removal of laboratory tests related to active surveillance or research relies on identification of specific codes for each surveillance program or research project, and text mining of the field ‘reason for sampling’. When the laboratory fails to enter this information on the same day, the tests are recorded in the LIMS, then the syndromic surveillance system, which runs over night, recognizes these submissions as passive data collection. Easily discarded false alarms were also detected after the holiday season, due to a great number of samples accumulating during the holidays, and being processed on the first business day afterwards. The effect of holidays and post-holidays on the number of submissions was not modelled as part of the statistical preprocessing of the time series because the results of applying this type of correction were not satisfactory during the testing phase of the system (no significant reduction in false alarms, but a possible reduction in sensitivity). It was therefore decided to review post-holidays alarms individually.
Table 2 Number of alarms detected during 1 year of system implementation (260 working days, 52 weeks)
Fifteen true alarms were detected in syndromes monitored daily:
Four consecutive days of alarms in fish, which proved to be a case of unexpected die-off due to an atypically hot summer.
One seasonal increase of Salmonella in cats, which started unusually early in that year.
Two as a result of epizootic investigations being carried out, triggered by epizootic suspicions reported by veterinarians. All laboratory submissions with the word ‘suspicion’ appearing anywhere in the data fields are considered as relevant for syndromic surveillance by the text mining algorithms, even if the investigation was ordered by surveillance officials.
Eight consecutive alarms due to an unexpected increase of Sarcoptes tests in dogs, which was investigated, but was not found to be related to any specific field problem. That is, there was in fact an increase in the number of submissions, so the alarm was considered true. But the veterinarian responsible for the samples clarified that no increase in incidence was observed, and this was part of a personal case study.
These four instances of investigations validated the functionality of the system and were considered positive outcomes.
Twenty-five alarms were detected, however, which were not found to be associated with a real outbreak signal after investigation. Investigation consisted of first contacting the laboratory personnel and the in-house experts responsible for the respective diseases and animal species. In most cases, the experts felt confident dismissing the alarm based on their review of the submissions. These were cases, for example, when the experts felt that the increase was a normal seasonal effect, not successfully modelled by the detection algorithms in that particular occasion. If the experts did not feel confident to dismiss the alarm, the veterinarians submitting the samples were contacted directly to confirm that a final diagnostic had been reached for a production problem or endemic diseases. The syndromes were also closely monitored in following time points. All these 25 alarms were ultimately considered false alarms. Each of them incurred 1–3 h of investigation time before being discarded as false alarms.
Data quality problems did not impact weekly alarms, since the information for active surveillance and research projects is usually entered in the LIMS system before the end of the week. Six alarms were related to true increases in syndrome incidence related to early seasonal patterns. Six alarms demanded investigation but were ultimately dismissed.
A total of 44 alarms were generated for syndromes monitored as counts between events (CBE), during the 260 working days. These alarms are more difficult to sort out as positive or negative, since they are always associated with only one or two submissions, which were considered alarming because the events are considered rare. In general, these alarms are not followed up in the same way as the daily or weekly alarms. After observing an alarm, we simply remain observant of that syndrome, and only if a consecutive alarm is generated (a new submission is received within a period of time again considered unusual by the algorithms) this is considered worthy of investigation. Consecutive alarms for CBE syndromes were not observed during the year of operation.
Integration with other activities in the institution
The use of text mining techniques to sort out the reasons for sampling (surveillance or passive submission) and to classify submissions into syndrome was the most time-consuming step of system development, but also added value to the data available. This step was considered to support the generation of epidemiological information from the health data collected through the LIMS system.
In the practice of animal health surveillance it is important, for instance, to demonstrate freedom from certain contagious animal diseases in order to safeguard trade agreements for animal products with other nations worldwide. Epidemiologists wanting to report, for instance, the activities of surveillance related to a specific exotic disease in the country, as an example PRRS in swine, can search for all laboratory tests received which were related to reproductive signs in pigs. The tests successfully investigated and found negative for PRRS, and those found positive for other pathogens, contribute to evidence that PRRS is not present in the country.
Since the system extracts a great amount of data on a daily basis and carries out automated analyses, it has been recognized that it can be useful to produce various types of automated reports, not only early disease detection. The system was presented to different departments within the institution, and diagnosticians were asked to list other reporting functions that could benefit their daily routines.
Expansion of the system
Since the system was first implemented, early in the summer of 2013, besides the inclusion of specific reports by demand of various diagnostic departments, we have also included automated mapping of the geographical coordinates.
It has also been possible to expand the system to monitor external sources of data, available through the Swedish Board of Agriculture (National Central Competent Authority for animal health). These include a national database recording mortality events, and more recently clinical findings registered by official veterinarians visiting livestock farms. These data sources are monitored in parallel with the laboratory submission data. More research is needed to find ways to combine these monitoring streams, so that evidence from multiple data sources can support each other.
Discussion
The literature on veterinary syndromic surveillance includes extensive references to the choice of data sources, detection algorithms and even response to alarm. However, little has been discussed concerning the actual implementation of a syndromic surveillance system. The scarcity of immediate implementation solutions, which can be readily implemented by epidemiologists exploring new data sources in animal health, may be one of the reasons why much has been discussed about the potential of different sources, but few systems have been implemented or remained active after the initial development phases (Citation2).
We have described a veterinary syndromic surveillance system implementation, which was developed as a simple desktop application, scheduled to run daily using Window's task scheduler. All R codes used to develop the system described are available as an R package, called vetsyn. Instructions to download, use, and contribute to the package are available at the SVA website (www.sva.se, search for ‘vetsyn’).
In our implementation of this system, a decision has been made to favor sensitivity rather than specificity. Besides setting detection thresholds that optimized sensitivity, we have chosen not to include in the statistical preprocessing any variables that did not significantly reduce the number of false alarms, but which could potentially result in missing true alarms. For that reason, holiday and post-holiday effects, for instance, were not modelled, and alarms resulting from post-holiday peaks were reviewed individually. It was also considered desirable to receive warnings for early seasonal increases for specific syndromes, so that laboratory personnel can be prepared for an increase in the number of laboratory test requests. As a result, a large number of alerts were generated over 1 year of system maintenance. It is important to note, however, that more than half of the false alarms were attributed to data quality problems or to post-holidays peaks. False alarms truly believed to be due to statistical chance summed to 25 daily and 6 weekly. Considering the number of species and syndromes monitored, the number of alarms, positive and false have been considered manageable. Institutions interested in reducing the number of alarms can increase the limit of detection (reduce sensitivity but increase specificity). In this specific system, the number of false alarms could also be reduced by monitoring all syndromes weekly, rather than daily. Such a gain in specificity would however incur a loss in timeliness.
The alarms considered to be associated with relevant events for health surveillance have validated the system utility. In the case of the unusual early start of the ‘Salmonella season’ in cats, for instance, the detection of the early seasonal pattern was of interest to both disease experts and laboratory personnel, who needed to be prepared for an earlier than expected increase in the number of submissions for Salmonella testing during that spring.
Moreover, the system contributed to detecting and correcting problems related to data quality, improved communication between the diagnostic departments and the epidemiology department, increased the overall situational awareness, and allowed other automated reports to be set up.
There are still more capabilities to explore from the system, which we intend to research in the future. These include, among others, spatial analysis to detect geographical clusters, further exploration of the ability to contribute to evidence of disease freedom, and monitoring of compliance with active surveillance sampling programs.
The syndromic surveillance system described has proved useful as a holistic system for generation of epidemiological information from animal health data, which offers more advantages than a simple early warning based on an increase in the number of laboratory submissions.
Conflict of interest and funding
The authors have not received any funding or benefits from industry or elsewhere to conduct this study.
Acknowledgements
The authors thank the diagnosticians who contributed to the development of the system, in particular: Dr. Anna Lindhe, Dr. Eva Osterman-Lind, Dr. Karin Persson-Waller, and Dr. Erik Ågren. They also thank Martin Bergström for the support with the Oracle database. System development was funded by the Swedish Board of Agriculture.
References
- Dupuy C, Bronner A, Watson E, Wuyckhuise-Sjouke L, Reist M, Fouillet A, etal. Inventory of veterinary syndromic surveillance initiatives in Europe (triple-S project): current situation and perspectives. Prev Vet Med. 2013; 111: 220–9.
- Dórea FC, Sanchez J, Revie CW. Veterinary syndromic surveillance: current initiatives and potential for development. Prev Vet Med. 2011; 101: 1–17. doi: http://dx.doi.org/10.1016/j.prevetmed.2011.05.004.
- Dórea FC, Sanchez J, McEwen BJ, McNab WB, Revie CW. Syndromic surveillance using veterinary laboratory data: algorithm combination and customization of alerts. PLoS One. 2013; 8: e82183.
- Dórea FC, Lindberg A, McEwen BJ, Sanchez J, Revie CW. Syndromic surveillance using veterinary laboratory requests: a practical guide informed by experience with two systems. Prev Vet Med. 2014; 116: 313–24.
- R Development Core Team. : a language and environment for statistical computing. 2012; Vienna, Austria: R Foundation for Statistical Computing.
- Dórea FC, Muckle CA, Kelton D, McClure JT, McEwen BJ, McNab WB, etal. Exploratory analysis of methods for automated classification of laboratory test orders into syndromic groups in veterinary medicine. PLoS One. 2013; 8: e57334.
- Radaelli G. Planning time-between-events Shewhart control charts. Total Qual Manage. 1998; 9: 133–40.