Abstract
Objectives: To investigate the effect of Antarctic residence on energy dynamics and aerobic fitness over the course of a year in over-wintering personnel.
Study design: A prospective longitudinal observational study.
Methods: A convenience sample of personnel over-wintering at Rothera Research Station in Antarctica was studied. Body weight, body fat, food intake, activity and aerobic fitness were recorded every 30 days for 1 year. Body weight, body fat and food intake were measured using weighing scales, skinfold callipers and diet records, respectively; activity was measured using accelerometer-based activity trackers and aerobic fitness using a treadmill protocol. Climate markers of temperature and sunlight hours were also recorded.
Results: Twenty-one subjects took part in the study over the 12-month period. A statistically significant increase in body weight and body fat in winter was observed (p=0.012 and p=0.049, respectively). There were no statistically significant trends in activity, food intake or aerobic fitness.
Conclusions: There were significant seasonal changes in body weight and body fat, with both measures increasing in winter but no significant changes in the other main outcome measures.
Antarctica is the highest, driest, coldest and windiest of all the continents. Inhabitants face myriad challenges in the form of cold temperatures, dry air and high levels of electromagnetic radiation. In addition to physical stressors, habitation also poses psychological stress through geographic and social isolation (Citation1 Citation 2) and the associated difficulties of small group interactions. Isolation in winter results in physical separation from outside influence for half a year or more. Prolonged periods of severe weather are not uncommon and can result in long periods without leaving the confines of a research station or field camp.
It is logical to assume that this environmental stress might affect energy dynamics and aerobic fitness. However, the precise nature of this effect has not been fully described in the literature. Much of the existing research has focussed on only part of this complex system, and the majority of the work has been undertaken more than 30 years ago (e.g. 3–6). Additionally, the majority of the work to date has reported effects of Antarctic residence only in men. Since living and working patterns have changed over the past few decades (including the introduction of female over-winterers), the effect of environmental stress on those living in a modern base warranted further exploration.
The aim of this study was to assess the effect of 12 months of Antarctic residence at a modern research station on energy dynamics and aerobic fitness. Energy dynamics were determined from measures of body weight, body fat, food intake and activity. Associations were examined between these measures of energy dynamics as well as aerobic fitness. Climate markers were also recorded and associations sought between these and energy dynamics.
Material and methods
Design
A prospective longitudinal observational study at Rothera Research Station, Antarctica (67°34′S 68°08′W) was undertaken to investigate the effect of Antarctic residence on energy dynamics and aerobic fitness over the course of a year (January 2007–January 2008). Measurement sessions were conducted at 30-day intervals throughout the year.
Sample
A convenience sample of over-wintering personnel was recruited. The over-wintering population includes individuals with a broad range of occupations (base commander, chef, mechanics, electrician, plumber, carpenter, medical officer, boat officer, diving officer, communications officer, meteorologist, meteorological scientist, marine scientists, field assistants) and therefore potentially different levels of work-related activity. There were no exclusion criteria. Subjects were not restricted by the study protocol.
Ethical approval
Ethical approval for the study was obtained from Central Office for Research Ethical Committees (COREC) via the South West Devon Research Ethics Committee. Written informed consent was obtained from each of the subjects.
Outcome measurements
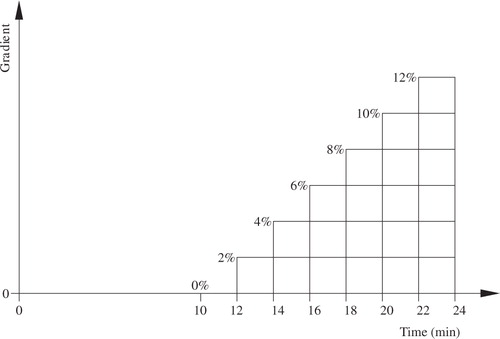
The main outcome measures were body weight, body fat, food intake, activity and aerobic fitness, and these were recorded at each measurement session. In order to maintain subject compliance, measurement sessions were conducted at a time of day convenient to each individual subject. Sunshine hours, temperature, wind speed and humidity were also recorded on a daily basis throughout the study period. Height was measured once at the start of the study. Body weight was measured to the nearest kilogram using a standard set of weighing scales (Tiger; model not stated). For the latter half of the measurements, duplicate weight was also recorded using balance scales (Seca Model 713; Seca Ltd, Birmingham, UK), with readings made to the nearest 0.1 kg. Skinfold thicknesses were measured using Harpenden skinfold callipers (Harpenden; John Bull, British Indicators Ltd, UK) based on the protocol of Durnin and Womersley (Citation7), and body fat was then calculated using established equations (Citation7). Food intake was measured using 3-day diet records, which were analysed to provide a measure of average caloric intake over a 24-hour period by trained staff at the Rowett Research Institute (Aberdeen, UK) using WinDiets Nutritional Analysis Software Suite (WinDiets Version 1.0; The Robert Gordon University, Aberdeen, UK), a computerised version of McCance and Widdowson: The Composition of Foods. Incomplete days were excluded from analysis. Activity levels were assessed by step counts, which were measured using the activPAL unit (activPAL series 8.0; PAL Technologies Ltd, Glasgow, UK). The unit is an activity tracker measuring 52×33×5.5 mm, which is attached to the right anterior thigh. Previous research has demonstrated a high level of accuracy of the activPAL unit in the measurement of step counts (Citation8 Citation9). The device was worn continuously for 72 hours whilst diet records were kept. Aerobic fitness, as indicated by VO2max, was measured using the Costill-Fox treadmill protocol and a slightly modified Åstrand treadmill protocol (). The Åstrand protocol is very similar to the Costill-Fox protocol, the differences being that the former has a slower speed (2.7 vs. 4.0 m/s) and has a 3-minute stage at 0% compared with 2 minutes for the latter (Citation10). The Åstrand protocol was therefore modified by reducing the 0% stage to 2 minutes for simplicity and to accommodate more direct comparison between the protocols. Subjects were selected to run either the Costill-Fox or the modified Åstrand protocol according to their predicted fitness, with a slower speed (i.e. Åstrand protocol) for the less fit subjects. Subjects completed the same protocol for each of their measurements. The treadmill was calibrated for each running speed and gradient combination. VO2max was calculated using established equations and the final completed stage of the running protocol ( Citation11 Citation12 Citation13 ).
Fig. 1. The treadmill protocol. Warm-up was at a user-defined speed and gradient and lasted 10 minutes. Test speed was set to either 2.7 m/s (6.0 mph) or 4.0 m/s (8.9 mph) according to estimated fitness level.
Data analysis
Results were analysed using SPSS v16-18 for Mac (SPSS Inc., Chicago, IL, USA). The level of statistical significance was set at p≤0.05. A repeated measures general linear model was used to test for seasonal variability in main outcome measures data over the 12-month study period. Since a peak or trough was expected in the winter months, quadratic level contrasts were used. Significant results were based on the fit of the single degree of freedom quadratic term, and therefore no further breakdown into specific contrasts was possible. Pearson's correlation was used to investigate the relationship between measures of energy dynamics and aerobic fitness and climate markers.
Results
Demographic characteristics
Twenty-two participants were included in the study; one subject withdrew after the first measurement session and was therefore excluded from the analysis; the total study sample size was 21 (18 male). One further subject withdrew after the seventh measurement session; his results have been included in the analysis. Four subjects did not complete the aerobic fitness testing within the study; however, their remaining results have been included in the analysis. Some other subjects were unavailable for testing at certain time points because of work commitments. Ten subjects were not sampled at session 7 because of logistical problems and the absence of the researcher from the station during part of the measurement session. These represent a random subgroup of the study sample with no specific differentiating characteristics [mean age 31.9±6.3 (standard deviation) years]. Missing results have been taken into account during subsequent statistical analysis. Anthropometric and baseline data for the participants are shown in .
Table I. Anthropometric and baseline data of participants at the start of the study period, illustrating mean values (standard deviation) and range
Climate data are presented for the study period of January–December 2007. The data collected were temperature, sunshine hours, wind speed and humidity. Data were analysed by calendar month. Summary data are presented in .
Table II. Monthly climate data for 1 January 2007–31 December 2007, illustrating mean values (standard deviation) and range
A summary of mean values for the main outcome measurements is presented in .
Table III. Unweighted mean (standard deviation) monthly values of main outcome measures
Main outcomes
Body weight and body fat
Body weight fluctuated over the course of the year. Unweighted mean weight dropped from approximately 84.0 kg in January to 83.1 kg in February and then increased to a clear peak in May, June and July (85.9 kg) before steadily decreasing to 82.5 kg in December. The variation in body weight over the course of the study was statistically significant (p=0.012).
Body fat also varied over the course of the year. There was a trend towards increased body fat in the winter months, with a peak in July of approximately 24.6%, and decreased levels in the summer months, with a steady reduction from July through to approximately 22.4% in December. The variation in body fat over the course of the study was statistically significant (p=0.049).
Activity and food intake
Activity as measured by unweighted mean step count fell to a low point of approximately 9,300 steps/day in winter (May) before rising steadily to a high point in summer of approximately 12,900 steps/day (October). A further low point was seen in December (9,400 steps/day). These fluctuations were not statistically significant. Food intake showed no patterns of fluctuation over the year (unweighted mean range 8,184–12,358 kJ/day), and this was supported by the lack of statistically significant variation.
Aerobic fitness
Aerobic fitness showed no patterns of fluctuation over the year (unweighted mean range approximately 57–61 ml/kg/min). No statistically significant variation was observed.
Secondary outcomes
Association between body weight and body fat
Pearson correlation tests were performed on body weight and body fat for each subject. There was a significant moderate or strong correlation for 12 subjects (r=0.674 to 0.939; p=0.000 to 0.047).
Association between activity and body weight, and activity and body fat
Pearson correlation tests were performed on activity and body weight, and activity and body fat each month. No significant correlations were found.
Association between aerobic fitness and body weight, and aerobic fitness and body fat
Pearson correlation tests were performed on aerobic fitness and body weight, and aerobic fitness and body fat each month. There was a strong negative correlation between aerobic fitness and body fat at all measurement sessions (r=−0.779 to −0.954; n=8 to 18; p=0.000 to 0.001). There was no significant correlation between aerobic fitness and body weight.
Association between climate, anthropometric data and activity levels
Since temperature data is constant for each subject in a given month, mean monthly values of all subjects were used as the data for correlation testing. Pearson's correlation failed to show a significant association between mean temperature and body fat, and between mean temperature and step count. However, there was a statistically significant and moderately strong negative correlation between mean temperature and body weight (r=−0.658, n=12, p=0.020). Similarly, since monthly sunshine hours data is constant for each subject in a given month, mean monthly values of all subjects were used as the data for correlation testing. Pearson's correlation failed to show a significant association between monthly sunshine hours and body weight, body fat and step count.
Discussion
The aim of this study was to determine the influence of 1 year's residence in Antarctica on body weight, body fat, food intake, activity and aerobic fitness. The main findings of the study were that there was an increase in body weight and body fat in winter. There were no significant changes in activity, food intake or aerobic fitness recorded over the course of the year. There was a strong negative correlation between body fat and aerobic fitness and a moderately strong negative correlation between body weight and mean temperature.
This study is relatively unique in addressing the different facets of energy balance and aerobic fitness over the course of a year in Antarctica. Whereas previous research has focused on one or a few of these areas, this study has sought to investigate the complete picture. We report on one of only a few occasions in which these measures have been taken in a mixed-sex sample during Antarctic residence, albeit with a high male:female ratio. This study is also one of the first studies to use accelerometer-based activity trackers as a measure of activity levels in the Antarctic environment. These provide an objective way of quantifying physical activity and offer significant advantages over previous techniques, such as the factorial method. Finally, the measurement of a relatively large study sample (for Antarctic research) provides greater statistical clarity than in previous work.
Activity
The mean step count (10,752 steps/day) was not especially low and indeed results were very similar to that found in a study of step counts of 18-to-65-year-old subjects in the United Kingdom (9,132–10,417 steps/day) (Citation14). This is initially quite surprising, since normal daily walking was minimal at Rothera. “One logical explanation for this is that where activities of daily living did not predispose to a high daily step count, subjects engaged sufficiently in leisure or athletic activities to stay active.” Another is that given the high inter-individual variation, the very high activity of some subjects may have been sufficient to counter the low activity of others.
In contrast with suggestions from previous research (Citation5 Citation15), there was not a significant change in activity during the study year. At Rothera, station life varied throughout the year. The summer season is characterised by a larger number of personnel and for most people, a busier workload. The long daylight hours and generally favourable weather meant that there were good opportunities for outdoor leisure pursuits. With the coming of winter, base life took on a slower, quieter pace. It is not clear why the present research did not demonstrate a significant seasonal variation in activity. Certainly casual observation suggested that subjects did not leave the base as often, often due to poor weather, decreased daylight hours and low motivation. It is interesting to note that when a repeated measures analysis with cubic level contrast is applied to the activity data, significance is found (p=0.04). This may be due to the unexpected fall in activity in December, effectively creating 2 low activity points over the year. However, this must clearly be treated with caution since a single trough was expected and a quadratic contrast is therefore more appropriate.
Body weight and body fat
Body weight and body fat increased during the winter months of the study. These observations align with previous studies (e.g. 15,16), which found significant seasonal variation in body weight and body fat. An important cause of this variation in previous studies was a seasonal fluctuation in activity, and it was hypothesised that a decrease in winter activity would therefore be observed in the present study. Although decreased activity levels were observed in early winter, this was not significant and showed no correlation with body weight or body fat. It is not clear what provided the mechanism for the observed seasonal variation in winter body weight and body fat. One explanation for this is may be that the activity trackers were not precise enough to quantify a decrease in winter activity. However, the activity trackers have been shown to be reliable at recording step count as discussed earlier. Another possible reason for the lack of statistical significance in these observations is the large margin of error (as evidenced by the high standard deviations) due in turn to the high inter-individual variations. A larger sample size may help to add some statistical clarity. It is possible that subjects did not fully comply with wearing the activity tracker. The counter to this is that graphical displays of recorded activity observed during analysis of the data allowed large periods of unexpected inactivity suggestive of poor compliance to be noted and data discounted as appropriate. Step count provides a general measure of whole body activity. However, it will not quantify isometric activity and is unable to allow for increased energy expenditure associated with moving through difficult terrain (e.g. deep snow) (Citation17) or walking whilst wearing heavy clothing (Citation18). It may be, then, that step count did not represent overall activity (i.e. actual energy expenditure) closely enough to allow significant seasonal variation to be observed. Finally, it may be another as yet unidentified mechanism unrelated to activity that caused the winter rise in body weight and body fat.
Relationship between body weight and body fat
The results of this study demonstrated a positive correlation between body weight and body fat for 12 out of the 21 subjects (i.e. 57%) (r=0.674 to 0.939; p=0.000 to 0.047). Similar positive correlations between body weight and body fat have been found in other studies (e.g. 3,16). For the present study, there were no apparent differences in those subjects who demonstrated correlations and those who did not. Possible explanations are that changes in muscle mass in some subjects confounded any correlation; this could be linked to differing occupations or leisure activities whilst in Antarctica producing differing stimuli on muscular development.
Food intake
The results of this study show that food intake was moderate at Rothera (9,860 kJ/day). Although notably lower than that reported in previous work [e.g. 15,070 kJ/day, (Citation4)], the values of this study are strikingly similar to those reported by the National Diet and Nutrition Survey for men aged 19–64 years in the United Kingdom (9,720 kJ/day) (Citation19). There was no significant pattern of variation over the year, and there was great inter-individual variation.
The lower intake, compared with many previous studies (Citation4 Citation6 Citation20 Citation21 Citation22 ), could be due to a higher awareness amongst subjects in the current era of the importance of healthy eating. This might explain the absence of significant seasonal variation. Indeed, food intake in and of itself was not expected to show variation with season. Unlike activity levels, which might be expected to be restricted by poor weather and poor light, there is less impetus for a change in the food intake.
Compliance with form completion and accuracy of portion size records are likely to represent the 2 largest sources of potential error. In a feasibility study for the National Diet and Nutrition Survey, a deficit of 25% was obtained when reported intake was compared to expenditure calculated using doubly labelled water (Citation19). During the present study, subjects were encouraged to complete the form at the time of eating to reduce recall error and an attempt to reduce portion size error was made by providing education into portion sizes; weighing food portions in future research would improve this accuracy further. However, if the deficit noted by the feasibility study of the National Diet and Nutrition Survey of 25% is assumed, then the true mean would be 13,150 kJ/day. This value would be much closer to that observed in previous polar studies (Citation23) and only a little more than the intakes of office clerks, laboratory technicians and building workers in the United Kingdom (i.e. the types of profession of this study's subjects) (Citation24).
Aerobic fitness
There was no significant seasonal variation in aerobic fitness. If the lack of seasonal variation in activity is assumed to be correct, then this represents the most likely explanation for the lack of variation in aerobic fitness; that is, subjects remained active during the study period sufficient to maintain fitness. A study by Dick (Citation25) also failed to observe such a seasonal variation. This was linked to the relatively stable activity of the subjects, with an absence of a winter decline in activity levels.
The outputted values for VO2max are remarkably high (Citation26). One possible explanation is that subjects did not achieve steady state during the exercise test. The use of standard protocols with 2-minute stages and taking measurements only from the last completed stage minimised this possibility. Given the severe nature of the maximal test, it is possible that there was an extraneous contribution from anaerobic metabolism, thus artificially inflating the maximum power output and overestimating VO2max (Citation11). Direct measurement of VO2max by expired gases, were that to have been possible, would have avoided this potential source of error. Although the calculations on which the reported values are based are valid and appropriate, these values of VO2max are estimates and there may be significant variation compared with the true values (Citation13). Another possible cause of overestimation is that the incline reported by the treadmill may have been higher than the actual gradient, thus making the work done appear greater than it actually was. However, if the VO2max values are an overestimate, such an overestimate would likely be fairly uniform across all measurements and since it was changes occurring during the study period that was of interest, actual values for VO2max are of less importance. As such, the values obtained are still valid for inter- and intra-individual comparisons.
Correlation between body weight and body fat and aerobic fitness
The study demonstrated a strong negative correlation between body fat and aerobic fitness, as measured by VO2max, which was statistically significant (r=−0.779 to −0.954, p=0.000 to 0.001). No correlation was observed between body weight and aerobic fitness. This is as expected: larger body weight may reflect larger musculature and thus may or may not be associated with aerobic fitness. However, fat plays no functional role in a short exercise bout; it is therefore "dead weight", which the subject must move during exercise. Further, those subjects who exercise regularly and are thus likely to be fitter are also likely to have lower levels of body fat as a direct result.
Climate
The results from the study period show a fluctuation from a mean monthly high of 2.2°C in January 2007 to a low of −11.6°C in July 2007, with a maximum of 6.1°C and a minimum of −23.4°C. Such temperatures are relatively mild by Antarctic standards (Citation5 Citation25 Citation27).
This study found no correlation between body weight, body fat and activity and sunshine hours. No correlation was found between body fat and activity and mean temperature, but a moderately strong negative correlation was found between body weight and mean temperature (r=−0.658, n=12, p=0.020).
Whilst the effect of temperature is significant on exposed skin, the effect is less pronounced once the subject is well insulated by clothing. No attempt was made to measure undergarment air temperature, and future studies may wish to revisit this area. However, in an investigation of undergarment skin temperature of 4 workers at Halley Research Station over the course of a year, Norman (Citation5) found that subjects were relatively well insulated from the cold external environment, with an average sub-clothing temperature of 32–33°C. With ample equipment and good education, it is not unreasonable to assume that the subjects of this study similarly were not exposed to a great deal of actual cold on a daily basis.
In the light of this, it is perhaps not surprising that there was no demonstrable correlation between body fat and activity and mean temperature. However, there was a significant moderately strong negative correlation between body weight and mean temperature. The reason for this is unclear. Given previous research, it would seem logical to conclude that weight increased as a product of decreased activity in response to unfavourable outdoor conditions. However, no correlation was found between temperature and activity. Other possible explanations may lie in altered neuro-endocrine pathways as evinced by Vats et al. (Citation28). Future research could investigate this relationship further.
Similarly, the proportion of time that subjects actually spent outside was not quantified during the present study. Previous research at Halley Research Station found that workers spent 9% of their total time outdoors on average over the course of the studied year (Citation29). In an unpublished work reported by Priestly et al., Cumming noted similar findings for exposure at the Argentine Islands base (Citation30). Future research may wish to re-evaluate this in a modern Antarctic base.
General limitations
A possible confounding factor of all measurements is the effect of the study itself. By observing the subjects in their daily activity, the possibility of reactivity cannot be excluded, that is, that some individuals modified their behaviour as a result (the Hawthorne effect). However, the study's duration is perhaps the greatest factor in minimising or negating this effect, since it is unlikely that participants would have remained motivated for a whole year to modify their behaviour to improve results in the study. Subject compliance is another potential problem with a longitudinal study of such length; individual attention and encouragement were used to attempt to counter this.
Subjects were heterogeneous both in physical characteristics and in terms of personal background as indicated by their job. The subjects were also similar to others in previous research, although the range of weights in this study may be broader (Citation3 Citation15). Nevertheless, the findings of this study are probably generalisable to other modern Antarctic station contexts. Although the sample size is too small to comment on generalisability with the United Kingdom population, physical activity levels were similar in both groups (Citation14).
Future research
This study has highlighted several avenues for future research. Firstly, the use of potential gold standard techniques such as densitometry or DEXA scanning in the measurement of body fat in Antarctica (should this become practically possible) would provide a precision hitherto unavailable. Similarly, the gold standard technique of doubly labelled water for the measurement of energy expenditure (i.e. activity) should be used alongside novel methods such as the activPAL to compare the latter's accuracy and validity in the Antarctic environment. Adding activity and clothing diaries may help to provide a more detailed explanation of how subjects are active. Similarly, the nature of work at polar bases has evolved in recent times and quantifying time spent outside is a current concern worthy of investigation. Sub-clothing temperature has been investigated in previous research, but there is little evidence from the modern polar era.
As per previous work in this field, the weight and body fat gains of the subjects in winter may have health implications for Antarctic over-winterers, which should be considered by Antarctic program directors. This information is particularly important since it represents the body composition changes experienced by those living and working in a modern Antarctic station and since increased body fat is a risk factor for several chronic health conditions (Citation31). Providing relevant health promotion for over-winterers would be a reasonable means of addressing this in the short term at least, with an emphasis on the need for regular exercise and the avoidance of overeating in winter months. Future work could then seek to assess the impact of such an intervention.
Conclusions
This study aimed to determine the influence of 1 year's residence in a modern Antarctic base on body weight, body fat, food intake, activity and aerobic fitness in a mixed sex population. An increase in body weight and body fat in winter was observed. No statistically significant trends were observed in food intake, activity or aerobic fitness as measured by VO2max over the study year.
Conflict of interest and funding
No conflict of interest is reported. Partial funding was provided by the British Antarctic Survey Medical Unit; this unit had no influence on study design, implementation or results.
Acknowledgements
We gratefully acknowledge the assistance of the following people: Dr Alex Johnstone and colleagues, Mrs Hilary Sanders, Dr Graham Horgan, Prof Grahame Budd, Mr Douglas Maxwell and Prof Malcolm Granat, Dr Sheila Simpson, Dr Lydia Simpson, the British Antarctic Survey and the British Antarctic Survey Medical Unit. We in particular acknowledge the 2007 wintering personnel at Rothera Research Station, who gave their time freely and graciously and without whose support this research could not have taken place.
References
- Case HS, Reed HL, Palinkas LA, Reedy KR, Van Do N, Finney NS, et al.. Resting and exercise energy use in Antarctica: effect of 50% restriction in temperate climate energy requirements. Clin Endocrinol (Oxf). 2006; 65: 257–264.
- Reed HL, Reedy KR, Palinkas LA, Van Do N, Finney LA, Case HS, et al.. Impairment in cognitive and exercise performance during prolonged Antarctic residence: effect of thyroxine supplementation in the polar triiodothyronine syndrome. J Clin Endocrinol Metab. 2001; 86: 110–116.
- Acheson KJ, Campbell IT, Edholm OG, Edholm OG, Miller DS, Stock MJ. A longitudinal study of body weight and body fat changes in Antarctica. Am J Clin Nutr. 1980; 33: 972–977.
- Easty DL. Food intake in Antarctica. Br J Nutr. 1967; 21: 7–15.
- Norman JN. Cold exposure and patterns of activity at a polar station. Brit Antarct Surv Bull. 1965; 4: 1–13.
- Milan FA, Rodahl K. Caloric requirements of man in the Antarctic. J Nutr. 1961; 75: 152–156.
- Durnin JV, Womersley J. Body fat assessed from total body density and its estimation from skinfold thickness: measurements on 481 men and women aged from 16 to 72 years. Br J Nutr. 1974; 32: 77–97.
- Maddocks M, Petrou A, Skipper L, Wilcock A. Validity of three accelerometers during treadmill walking and motor vehicle travel. Br J Sports Med. 2010; 44: 606–608.
- Ryan CG, Grant PM, Tigbe WW, Granat MH. The validity and reliability of a novel activity monitor as a measure of walking. Br J Sports Med. 2006; 40: 779–784.
- Kang J, Chaloupka EC, Mastrangelo MA, Biren GB, Robertson RJ. Physiological comparisons among three maximal treadmill exercise protocols in trained and untrained individuals. Eur J Appl Physiol. 2001; 84: 291–295.
- Astrand PO. Quantification of exercise capability and evaluation of physical capacity in man. Prog Cardiovasc Dis. 1976; 19: 51–67.
- McKelvie RS, Jones NL. Cardiopulmonary exercise testing. Clin Chest Med. 1989; 10: 277–291.
- American College of Sports Medicine. ACSM's guidelines for exercise testing and prescription. 5th ed. Media: Williams & Wilkins. 1995. 749. p.
- Hamilton SL, Clemes SA, Griffiths PL. UK adults exhibit higher step counts in summer compared to winter months. Ann Hum Biol. 2008; 35: 154–169.
- Wilson O. Changes in body-weight of men in the Antarctic. Br J Nutr. 1960; 14: 391–401.
- Davies AG. Seasonal changes in body weight and skinfold thickness. Brit Antarct Surv Bull. 1969; 19: 75–81.
- Smolander J, Louhevaara V, Hakola T, Ahonen E, Klen T. Cardiorespiratory strain during walking in snow with boots of different weights. Ergonomics. 1989; 32: 3–13.
- Teitlebaum A, Goldman RF. Increased energy cost with multiple clothing layers. J Appl Physiol. 1972; 32: 743–744.
- Food Standards Agency and Department of Health. The national diet & nutrition survey: adults aged 19 to 64 years. Volume 2. London: Food Standards Agency and the Departments of Health. 2003. 9–10 p.
- Masterton JP, Lewis HE, Widdowson EM. Food intakes, energy expenditures and faecal excretions of men on a polar expedition. Br J Nutr. 1957; 11: 346–358.
- Acheson KJ, Campbell IT, Edholm OG, Miller DS, Stock MJ. The measurement of food and energy intake in man-an evaluation of some techniques. Am J Clin Nutr. 1980; 33: 1147–1154.
- Taylor DM, Pye CL, Kibby J, Peterkin R, Hindson J, Lugg D, et al.. Energy intake, anthropometry and blood pressure of expeditioners in the Antarctic. Arctic Med Res. 1994; 53: 71–85.
- Simpson A. The effect of Antarctic residence on energy dynamics and aerobic fitness. Int J Circumpolar Health. 2010; 69: 220–235.
- Durnin JVGA, Passmore R. Energy, work and leisure. London: Heinemann. 1967. 166. p.
- Dick AF. Fitness changes in an Australian Antarctic expedition. Eur J Appl Physiol Occup Physiol. 1985; 54: 191–195.
- Wilmore JH, Costill DL. Physiology of sport and exercise. 3rd ed. Champaign: Human Kinetics. 2004. 142 p.
- Fiennes R. Captain Scott. London: Hodder & Stoughton. 2003. 508. p.
- Vats P, Singh SN, Singh VK, Shyam R, Upadhyay TN, Singh SB, et al.. Appetite regulatory peptides in Indian Antarctic expeditioners. Nutr Neurosci. 2005; 8: 233–238.
- Norman JN. Micro-climate of man in Antarctica. J Physiol (London). 1962; 160: 27–28.
- Anonymous. Man and the environment. In: Priestly R, Adie RJ, Robin GdQ. Antarctic research a review of British scientific achievement in Antarctica. London: Butterworths. 1964. 45. p.
- WHO. Obesity: preventing and managing the global epidemic. Report of a WHO consultation. WHO Technical Report Series, No. 894. Geneva: WHO. 2000. 16. p.