
Abstract
Extracellular vesicles (EVs) and exosomes are difficult to enrich or purify from biofluids, hence quantification and phenotyping of these are tedious and inaccurate. The multiplexed, highly sensitive and high-throughput platform of the EV Array presented by Jørgensen et al., (J Extracell Vesicles, 2013; 2: 10) has been refined regarding the capabilities of the method for characterization and molecular profiling of EV surface markers. Here, we present an extended microarray platform to detect and phenotype plasma-derived EVs (optimized for exosomes) for up to 60 antigens without any enrichment or purification prior to analysis.
In recent years, interest in the characterization, biogenesis and function of extracellular vesicles (EVs) has increased immensely. These membrane-derived vesicles play vital roles in a plethora of processes in several biological systems.
Currently, no proteins are known to be constitutively sorted into vesicles independently of the subcellular origin or the activation status of the producing cells. This lack of invariant housekeeping markers hampers the quantitative analysis of the vesicles.
Although the EV phenotype is particularly important in the determination of cellular and subcellular origin, it can in combination with a protein cargo analysis additionally provide clues about the functionality of the EVs. Further refinements of existing methods will not only contribute to broadening our understanding of the biological role of the EVs, but are also likely to accelerate the implementation of EVs as biomarkers in clinical diagnostics (Citation1, Citation2) and as therapeutic agents (Citation3).
Several methods exist to characterize the protein composition of EVs related to either a surface marker phenotype or the proteins present in the EV cargo, as reviewed by Revenfeld et al. (Citation3).
Detection and molecular profiling of EVs is technically challenging and often requires extensive sample purification and labelling (Citation4, Citation5). Previously, we developed and described a high-throughput approach for phenotyping EVs (Citation6). This approach, termed the “EV Array,” is based on a protein microarray platform. Antibodies are printed onto coated glass slides, which enable the capturing of EVs by their surface or surface-associated proteins. Afterwards, profiling of the EVs is performed by detection with selected biotinylated antibodies for exosomes, for example anti-CD9, -CD63 and -CD81. Here we demonstrate an extended microarray approach that offers improved profiling capabilities and provides an easy and efficient way to detect EVs as well as selected subpopulations. Therefore, this method presents an avenue towards scientific, diagnostic and prognostic applications.
Materials and methods
Blood samples
Blood samples were obtained from 5 healthy donors at the Department of Clinical Immunology at Aalborg University Hospital. Blood samples were collected as citrate-plasma with Vacuette® blood collection tubes (CPDA, Greiner Bio-One GmbH, DE). Plasma was isolated by centrifugation at 1,800 g for 6 min, aliquoted and stored at −40°C until analysis.
EV Array
The antibodies listed in Table were printed in duplicate or triplicate at 75–200 µg/mL diluted in PBS containing 5% glycerol. As positive and negative controls, 100 µg/mL of biotinylated human IgG and PBS with 5% glycerol was printed, respectively.
Table I. Antibodies printed on epoxy slides prior to EV capturing and analysis
Epoxy coated slides (75.6 mm×25.0 mm; SCHOTT Nexterion, DE) were used as the basis for the EV Array.
Non-contact printing
Microarray printing was performed on a TopSpot E-vision non-contact printer with a 24-spot print head (Biofluidix GmBH, DE). Two microlitre of antibodies and controls were manually loaded into the print head. Printing was performed at room temperature (RT). The instrument settings are analyte and buffer dependent and the most optimal settings were found manually on a day to day basis using drop check. Setting parameters were as follows: stroke 35–60 µm; downstroke 300–500 µm/ms; hold time 10–65 µs, and upstroke 5–8 µm/ms.
Contact printing
Microarray printing was performed on a SpotBot® Extreme Protein Edition Microarray Printer with a 946MP4 pin (ArrayIt, CA, USA). Temperature and humidity were kept at 15–18°C and 55–65%, respectively. Ten microlitre of the prepared antibodies and controls were placed in a 384-well microplate (ArrayIt) and placed in the printer. The pin was loaded with analyte solution and printing was performed by placing 20 preprints on a “dummy”-slide before triplicates of each analyte were placed onto the epoxy-coated slides. Between the different analytes the pin was washed as recommended by the manufacturer.
Catching and visualization
The following procedure for the EV Array was performed as described by Jørgensen et al. (Citation6) with modifications. In short, the slides were blocked for 1 hour at RT (50 mM ethanolamine, 100 mM Tris, 0.1% SDS pH 9.0) prior to incubation with plasma diluted 1:5, 1:10 or 1:20 in wash buffer (0.05% Tween®20 (Sigma-Aldrich, MO, USA) in PBS). The incubation with plasma was performed in Multi-Well Hybridization Cassettes (ArrayIt) at RT for 2 hours followed by overnight incubation at 4°C. After washing, the slides were incubated with biotinylated detection antibodies diluted 1:1500 in wash buffer (anti-human CD9, CD63 and CD81, Ancell Corporation, MN, USA). After washing, a 30 min incubation with Cy5-labelled streptavidin (diluted 1:1500 in wash buffer, Life Technologies, CA, USA) was performed for detection. Prior to scanning, the slides were washed in wash buffer followed by MilliQ water and dried using a Microarray High-Speed Centrifuge (ArrayIt). Scanning and spot detection were performed as previously described (Citation6).
Data analysis
Graphs and statistics were performed in GraphPad Prism 6.04 (GraphPad Software, Inc., CA, USA) and Excel 2013 (Microsoft, WA, USA). Heat maps were generated in Genesis 1.7.6 (IGB TU Graz, Austria).
For each protein spot, the signal intensity was calculated by subtracting the mean of the foreground (spot intensity) from the mean of the background (no sample/blank, washing buffer) at 635 nm. For a given antibody spot, the signal intensity was calculated as the mean signal of replicate spots in relation to the sample signal of the negative replicate spots (PBS). Before visualization and calculation of linearity, the antibody signals were converted by log2 transformation.
Results and discussion
We have used the multiplexed, highly sensitive and high-throughput platform of the EV Array as a basis for optimizing the method for characterization and molecular profiling of EV surface or surface-associated markers. To assure detection of the broadest possible exosome collection, it was decided to use detection antibodies against human CD9, CD63 and CD81 concurrently. All 3 antigens were targeted using a cocktail of the antibodies to maximize the detection signals. These antibodies were chosen because they are known to be present on the exosome subtype of EVs.
The non-contact microarray printing technology used in the original EV Array (Citation6) allowed only 24 different analytes to be printed simultaneously and the well size of the multi-well gaskets used limited the prints to duplicates. By implementing an alternative microarray printing technology (contact printing) the limitations of analyte numbers and replicates were altered, providing new possibilities for optimization of the EV Array (Table ). Basically, the non-contact printing technology resulted in antibody spots with a diameter of 200–250 µm (in duplicates). For the application tested here, the contact printing procedure applied spots with a diameter of 125–135 µm (in triplicate). a illustrates the difference in spot size for anti-CD9 spots. Decreasing the spot size will decrease the overall signal per spot (b) but the signal density will consequently increase (d). Below a certain spot size, the signal density approaches an optimum and will stay approximately constant with further decrease in spot size (Citation7). Therefore, the highest signal intensities and optimal signal-to-noise ratios can be achieved in small spots. The change in spot size and number of replicates gave rise to a 1.7–2.3 time reduction of the total spot area for each analyte printed (Table ). An additional advantage of using the contact printing technology is a decrease in the spot variation for each individual analyte. For example, for anti-CD9 the spot variation changes from 4.9 to 2.9% Coefficient of Variation (%CV) (b and Table ).
Fig. 1. Comparison of the applied microarray printing technologies; the original (ori.) non-contact printing and the new contact printing technologies. (a) Spots printed with anti-CD9 was used to analyse plasma from 5 donors for the contents of vesicles carrying CD9. The bar shows the color-coded intensities. (b) Mean and standard deviation of the fluorescent signals of the individual anti-CD9 spots shown in (a). Duplicates and triplicates were used for the original array (red bars) and new array (green bars), respectively. (c) Sum of the fluorescent signal for all replicates. (d) Fluorescent signal per area showing a higher signal per area of the improved array.
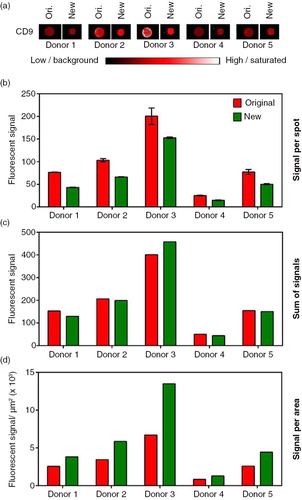
Table II. Summary of differences between the original non-contact printing procedure and the new contact printing procedure (exemplified by CD9)
In addition to smaller spots and thereby a higher sensitivity using contact printing, the technology also provided the opportunity to test whether it was possible to extend the number of analytes in the array, making it even more high-throughput and comprehensive.
In contrast to ordinary ELISA-based uses of the protein microarray technology, which analyse the presence of single molecules, the current version of the EV Array analyses the presence of highly sophisticated exosomes carrying various amounts of different molecules. Furthermore, the complexity of the analysis is also increased by the fact that the same exosome can carry several of the markers that are analysed for. Therefore, a technical issue of the analysis is to investigate whether the different antibodies printed on the array are competing with each other to capture the same exosomes.
To test whether it is possible to extend the number of analytes (from 21 to 60) used to phenotype the EVs present in a solution, we tested an experimental setup adding antibodies stepwise to the EV Array. The testing was performed by repeatedly analysing plasma samples from 5 healthy donors in 3 different sample dilutions. For each repeated experiment (antibody printing) additional antibodies were added and the signal intensities compared. When using 10 µL of plasma, a great variance of phenotypes was detected between the donors (), for example for CD276 (donor 1 being negative and donor 2 being moderately positive, indicated with an arrow on ). However, only small variances are seen when comparing the individual donors’ phenotypes across the different prints (increasing numbers of printed antibodies).
Fig. 2. Summary of the phenotyping of the exosomal population (positive for CD9, CD63 and/or CD81) in plasma from 5 selected, healthy donors. The exosomes were profiled using an EV Array printed with either 21 (Print 1), 33 (Print 2), 50 (Print 3) or 60 (Print 4) different capturing antibodies. The relative fluorescence intensity was log2 transformed prior to the visualization presented as a heat map. Black indicates no signal and green corresponds to maximum signal as indicated by the color-coded bar.
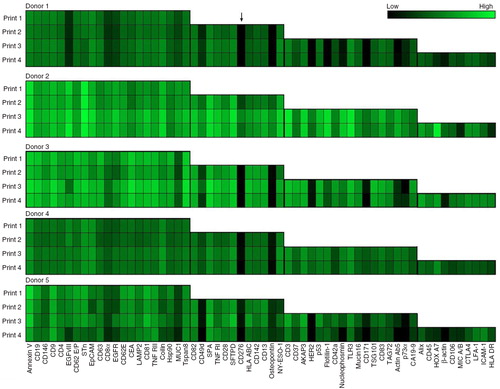
Some variations are however seen for 1 of the 5 donors (donor 5) where several signals tend to decrease with increasing numbers of antibody spots. This effect could indicate a relationship between the analytes, as if they may be present on the same subtype of exosomes. The correlating analytes are EGFRvIII, CD8α, nucleophosmin, CD171 and actin Ab5.
An additional observation appears to relate to the total number of exosomes for the individual donors. Generally, an increased number of positive signals were detected in the donors with higher signal intensities (donors 2 and 3). However, not all spots tend to follow this general trend, as seen for annexin V where donor 5 shows higher signals than does donor 3, which generally has higher signal intensities. Moreover, a similar structure is observed for the signals of coilin when comparing donors 4 and 5.
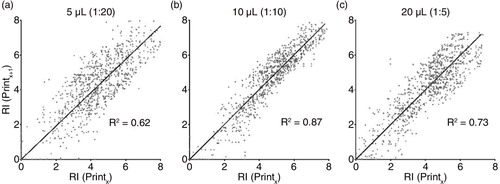
To analyse the datasets and variances in more detail, scatter plots of the relative intensities gained by the EV Array were generated for the 3 different plasma volumes applied (). The analyte signal intensities for each printing procedure were plotted against the intensities for the same analyte in the 3 other printing procedures. If the number of printed antibodies influences the signal intensities gained for each antibody, the scatter plots would be expected to have a non-linear pattern. Linear regression and calculation of the coefficient of determination (R2) were performed as illustrated in . The scatter plots and the R2 calculations reveal that the best linear pattern is obtained when using 10 µL plasma per analysis (b; R2=0.87).
Fig. 3. Scatter plot of the log2 transformed intensities of the 60 capture antibodies for 5 healthy donors. Intensities for each capturing antibody in each printing (Printx, x = Print 1 to 3) was plotted against the similar intensity for the printings with additional antibodies on the array (Printx + 1). The coefficient of determination (R2) was calculated for the linear regression (black line) with the intercept of (0,0). (a) Analysis using 5 µL plasma, (b) analysis using 10 µL plasma and (c) analysis using 20 µL plasma.
To picture the linearity for each of the individual antibodies applied for each amount of plasma used, scatter plots were generated and the slope and R2 calculated (Supplementary Table ). The mean of the individual R2 and the standard deviation are illustrated in a. The series of experiments using 10 µL plasma clearly represents the best linear correlations, whereas the 5 µL experiments do not confirm a linear correlation. The fact that the experiments using 10 µL plasma do not give a perfect linear correlation (R2=1) should be seen as a consequence of the %CV for an immunoassay for bioanalysis. The %CV for each individual antibody for each donor across the different printing procedures were calculated and illustrated in b. As summarized by Findlay et al. (Citation8) a minimal acceptance limit of a %CV of 25 is established for immunoassays. For the extended EV Array, the mean %CV for 5, 10 and 20 µL plasma were determined to be 19.5, 10.3 and 15.9, respectively (Citation8).
Fig. 4. (a) Comparison (5, 10 and 20 µL plasma) of the calculated coefficient of determination (R2) for the linear regression for each individual antibody (mean + SD). All calculated slopes and R2 values for each antibody and dilution are given in Supplementary Table . (b) Evaluation of the coefficient of variation (%CV) calculated across the different prints (Citation1–Citation4) for all antibodies and all donors (mean + SD) in relation to the amount of plasma used (5, 10 or 20 µL). (c) Example of representative spots obtained by the extended EV Array in relation to the amount of plasma analysed (5, 10 or 20 µL). Black indicates low signal (background) and white indicates a highly saturated signal as given by the color-coded bar.
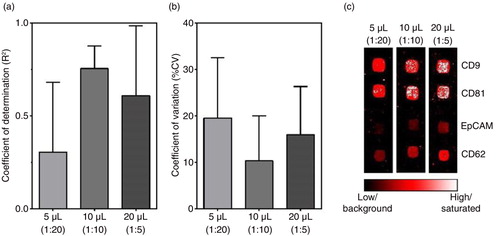
The increase in %CV observed upon decreasing the sample amount from 10 to 5 µL reflects the fact that the signal-to-noise ratio increases significantly. This increase is exemplified in c for selected spots. In particular, this increase stands out for spots capturing only low amounts of EVs, as seen for antigens such as EpCAM. In addition, c shows that increasing the sample amount does not necessarily result in increased signals as the spots of printed antibodies get saturated, as e.g. seen for the spots of CD9 and CD81. Another issue that should be taken into consideration when increasing the sample amount applied onto the EV Array is the presence of other biomolecules in plasma, which tend to bind to the glass slides, resulting in an unspecific background. This increase in background is seen more frequently when more than 10 µL plasma is used (data not shown).
EVs bear antigens from their parent cells and therefore phenotypical measurements of EVs can designate their cell of origin. However, EV research has been severely constrained by the technical difficulties in isolation and molecular analysis. In addition to the purification issue, throughput and reproducibility are also critical factors for the development of EV biomarker screening studies. To satisfy these technological requirements, we established a multiplexed, high-throughput, reproducible and high quality microarray technique where we integrate multiple capturing antibodies with an antibody detection choice that is easily replaceable.
The major advantage of using the EV Array technology platform is the opportunity to analyse and screen samples (plasma or cell medium supernatants) for at least 60 different antigens simultaneously and still keep the analysis in a high-throughput manner. The technology platform depends primarily on the production of a customized antibody microarray because the subsequent analysis can be performed with standard laboratory equipment, such as a fluorescent gel scanner. Several antibody microarrays are commercially available (e.g. from Sigma-Aldrich and Ray Biotech) and there are several opportunities to get a customized production (e.g. from ArrayIt or Ray Biotech).
A general limitation of many of the current phenotyping methods is that they fail to offer the ability to selectively identify well-defined EV subpopulations characterized by the presence of specific biomolecular markers. This lack of EV or exosome selectivity prevents determination of relative ratios of different subpopulations of EVs, information that may be critical in diagnostic applications.
The aim of this study was to demonstrate that our simple analysis has even greater potential regarding biomarker discovery, as well as being a tool in diagnostics and prog-nostics, than initially demonstrated (Citation6). In this study, it was shown that it is possible to analyse at least 60 markers simultaneously. However, we have not reached the limit yet, which signifies that it most likely is possible to add even more markers if needed. The criteria for an antibody to be included in the array was that it showed different levels of signal between the tested donors (>10) as exclusion of non-specific binding of plasma material or the detection antibodies.
Some of the chosen antibodies are specific against proteins situated intracellularly and it may not make any sense that these markers show positive signals when determining the membrane marker phenotype. However, in the case of e.g. p53, it has been shown to be situated on the surface of cells in culture under given circumstances, such as during mitosis (Citation9). Another example of translocation of intracellular proteins to the surface is myeloperoxidase and proteinase 3 (Citation10). Upon activation with TNFα or other cytokines, the neutrophils start to present the two cytosolic proteins as active enzymes onto their plasma membrane (Citation11). This suggests the possibility that it is possible to detect normally intracellular and even nuclear located proteins on the surface of cells and therefore also on the surface of their exosomes. This possibility is endorsed by the fact that the nuclear protein coilin (Citation12), as previously mentioned, was measured in different levels in the tested donors, which could argue against unspecific binding. Furthermore, the ESCRT protein TSG101 has shown great potential as one of the more important proteins in a 30-marker model able to distinguish non-small cell lung cancer patients from non-cancer patients by phenotyping their plasma exosomes (Citation2).
In this technical report, we have not distinguished whether it makes sense if the few healthy donors tested here are positive for some of the protein markers included, such as those related to cancer. Future biomarker studies on extensive patient cohorts will reveal if the individual markers are useful to distinguish healthy individuals from diseased.
Conflict of interest and funding
The authors have indicated that they have no conflicts of interest regarding the content of this article.
Supplementary Table
Download PDF (194.3 KB)Acknowledgements
This work was supported by Toyota Fonden, Det Obelske Fami-liefond and Aalborg Frivillige Bloddonorers Fond.
Related Research Data
References
- Im H, Shao H, Park YI, Peterson VM, Castro CM, Weissleder R et al. Label-free detection and molecular profiling of exosomes with a nano-plasmonic sensor. Nat Biotechnol. 2014; 32: 490–5. [PubMed Abstract] [PubMed CentralFull Text].
- Jakobsen KR, Paulsen BS, Bæk R, Varming K, Sorensen BS, Jørgensen M. Exosomal proteins as potential diagnostic markers in advanced non-small cell lung carcinoma. J Extracell Vesicles. 2015; 4: 26659. [PubMed Abstract].
- Revenfeld ALS, Bæk R, Nielsen MH, Stensballe A, Varming K, Jørgensen M. Diagnostic and prognostic potential of extracellular vesicles in peripheral blood. Clin Ther. 2014; 36: 830–46. [PubMed Abstract].
- Raposo G, Nijman HW, Stoorvogel W, Leijendekker R, Harding CV, Melief C et al. B lymphocytes secrete antigen-presenting vesicles. J Exp Med. 1996; 183: 1161–72. [PubMed Abstract].
- Théry C, Boussac M, Véron P, Ricciardi-Castagnoli P, Raposo G, Garin J et al. Proteomic analysis of dendritic cell-derived exosomes: a secreted subcellular compartment distinct from apoptotic vesicles. J Immunol. 2001; 166: 7309–18.
- Jørgensen M, Bæk R, Pedersen S, Søndergaard EKL, Kristensen SR, Varming K. Extracellular vesicle (EV) array: microarray capturing of exosomes and other extracellular vesicles for multiplexed phenotyping. J Extracell Vesicles. 2013; 2: 1–9.
- Templin MF, Stoll D, Schrenk M, Traub PC, Vöhringer CF, Joos TO. Protein microarray technology. Drug Discov Today. 2002; 7: 815–22. [PubMed Abstract].
- Findlay JW, Smith WC, Lee JW, Nordblom GD, Das I, DeSilva BS et al. Validation of immunoassays for bioanalysis: a pharmaceutical industry perspective. J Pharm Biomed Anal. 2000; 21: 1249–73. [PubMed Abstract].
- Milner J, Cook A. Visualisation, by immunocytochemistry, of p53 at the plasma membrane of both nontransformed and SV40-transformed cells. Virology. 1986; 150: 265–9. [PubMed Abstract].
- Falk RJ, Jennette JC. ANCA disease: where is this field heading?. J Am Soc Nephrol. 2010; 21: 745–52. [PubMed Abstract].
- Korkmaz B, Attucci S, Juliano MA, Kalupov T, Jourdan ML, Juliano L et al. Measuring elastase, proteinase 3 and cathepsin G activities at the surface of human neutrophils with fluorescence resonance energy transfer substrates. Nat Protoc. 2008; 3: 991–1000. [PubMed Abstract].
- Silva NP, Christofolini DM, Mortara RA, Andrade LEC. Colocalization of coilin and nucleolar proteins in cajal body-like structures of micronucleated PtK2 cells. Braz J Med Biol Res. 2004; 37: 997–1003. [PubMed Abstract].