
 ?Mathematical formulae have been encoded as MathML and are displayed in this HTML version using MathJax in order to improve their display. Uncheck the box to turn MathJax off. This feature requires Javascript. Click on a formula to zoom.
Abstract
Background
Fetal bovine serum (FBS) is the most widely used serum supplement for mammalian cell culture. It supports cell growth by providing nutrients, growth signals, and protection from stress. Attempts to develop serum-free media that support cell expansion to the same extent as serum-supplemented media have not yet succeeded, suggesting that FBS contains one or more as-yet-undefined growth factors. One potential vehicle for the delivery of growth factors from serum to cultured cells is extracellular vesicles (EVs).
Methods
EV-depleted FBS and human serum were generated by 120,000g centrifugation, and its cell growth–supporting activity was measured. Isolated EVs from FBS were quantified and characterized by nanoparticle tracking analysis, electron microscopy, and protein assay. EV internalization into cells was quantified using fluorescent plate reader analysis and microscopy.
Results
Most cell types cultured with EV-depleted FBS showed a reduced growth rate but not an increased sensitivity to the DNA-damaging agent etoposide and the endoplasmic reticulum stress–inducing chemical tunicamycin. Supplying cells with isolated FBS-derived EVs enhanced their growth. FBS-derived EVs were internalized by mouse and human cells wherein 65±26% of them interacted with the lysosomes. EV-depleted human serum also exhibited reduced cell growth–promoting activity.
Conclusions
EVs play a role in the cell growth and survival-promoting effects of FBS and human serum. Thus, it is important to take the effect of EV depletion under consideration when planning EV extraction experiments and while attempting to develop serum-free media that support rapid cell expansion. In addition, these findings suggest roles for circulating EVs in supporting cell growth and survival in vivo.
To access the supplementary material to this article, please see Supplementary files under ‘Article Tools’.
Cell culture was first reported in 1885 by Wilhelm Roux, who grew part of the medullary plate of an embryonic chicken in warm saline for several days. Body fluids such as lymph and plasma, or tissue homogenates, were then used to culture cells for longer periods (Citation1). Poorly defined media resulted in high variability between batches and labs. In 1956, Eagle developed a defined basic medium that included essential amino acids, salts, and vitamins (Citation2). This medium and its derivatives are still widely used (e.g. Dulbecco's modified Eagle's medium, or DMEM). However, most cell types require some serum for optimal growth in culture. Serum (a) supplies energy substrates, vitamins, hormones, growth factors, cytokines, and carrier proteins like albumin and transferrin; (b) provides extracellular matrix proteins such as fibronection that promote cell adhesion; and (c) protects cells from shear stress (Citation3).
Fetal bovine serum (FBS) is commonly used for cell culture. Modern production techniques have reduced the variability between FBS batches, lending relative consistency to experiments performed at different times and in different laboratories. However, using FBS is problematic for growing stem cells at a clinical-grade level (required for transplantation therapy), because its composition is not completely defined (Citation3). Thus, there is a need for serum-free defined media that can effectively support cell proliferation. To date, serum-free media can support the survival of many cell types in culture but do not recapitulate the fast growth rate of cells in the presence of 10% serum. Serum manifestly contains some as-yet-undefined factors and mechanisms that enhance cell growth.
In the last 20 years, it has been shown that serum contains an abundance of membrane vesicles (Citation4, Citation5) with mostly unknown function. There are 3 major types of extracellular vesicles (EVs) in the blood: microvesicles (50–1,000 nm) that originate from blebbing of the plasma membrane, exosomes (30–150 nm) that originate from fusion of late endosomes (multivesicular bodies) with the plasma membrane, and apoptotic bodies (100–5,000 nm) that originate from apoptotic cells (Citation6). EVs may mediate intercellular signaling by several mechanisms. First, EV membrane proteins, bioactive lipids, or lipid-modified growth factors and cytokines may interact with the cell surface. Second, internalization into a recipient cell may deliver cargo such as proteins and RNA. Both proteins and RNA delivered by EV have been shown to be active inside the recipient cell (Citation7). Emerging findings suggest that EVs play roles in many physiological processes and can be utilized as biomarkers or for drug delivery (Citation8).
Studying EV release in vitro requires the elimination of the abundant EVs in FBS; otherwise, they will contaminate the signals of EVs released by the cell of interest. Depletion of serum EVs is commonly achieved by high-speed centrifugation (Citation9). Here, we asked whether FBS EVs influence cell growth. Our findings show that EV-depleted FBS exhibits a reduced ability to promote the growth of human and mouse cells. We further show that FBS exosomes are internalized by cells and interact with lysosomes. These results suggest that serum-derived EVs serve as carriers of signals or nutrients that promote robust cell growth.
Materials and methods
Cells, plasmid, and reagents
Human U87 glioblastoma, human embryonic kidney (HEK) 293t cells, HeLa cells, human SH-SY5Y neuroblastoma cells, and mouse N2a neuroblastoma cells were cultured in DMEM (Gibco product no. 12800-017) containing 1% antibiotic and 10% FBS (HyClone™, Gibco, or ATCC; either normal FBS or EV-depleted FBS). In some experiments, cells were grown with medium that contained human serum (Sigma H6914 lot# SLBK2170V) instead of FBS. Lamp1-RFP plasmid was purchased from Addgene (no. 1817) (Citation10). Etoposide (no. E1383) and tunicamycin (no. T7765) were purchased from Sigma.
Generation of EV–depleted sera and isolation of small EVs
FBS and human serum were diluted (1:3) with DMEM to reduce its viscosity and was subjected to sequential centrifugation at 2,000g for 10 minutes; the supernatant was then transferred to a Beckman ultracentrifugation tube (no. 326823) and centrifuged at 10,000g for 40 minutes (SW28 rotor, k factor = 246); finally, the supernatant was transferred to a new Beckman ultracentrifugation tube and centrifuged at 120,000g for time periods ranging from 1 to 6 hours as indicated (SW28 rotor, k factor =246). The supernatant (the EV-depleted sera) was used for preparation of EV-depleted DMEM which was filtered through a 0.22 µm filter (Millex no. SLG5033SS) to sterilize the medium. The pellet, which contained the small EVs, was resuspended in PBS and was used for various analyses, as described below.
Labeling EVs with PKH26/67
EVs were suspended in 100 µl of buffer C prior to addition of 100 µl X2 PKH26 (Sigma no. PKH26GL) solution (5×10⁻⁶ M PKH26 in buffer C). The reaction was stopped after 2 minutes by adding PBS with 2% BSA (Sigma no. A-3912). The labeled EV were centrifuged twice at 110,000g for 1 hour (SW55i rotor, K=48) with an intervening wash in order to ensure removal of unbound dye.
Immunofluorescence, microscopy, and image analysis
Cells were grown on glass coverslips in 24-well plates. Labeled EVs were added to the cells 6 hours before the staining to allow internalization. For staining with PKH67, the cells were washed twice with PBS and incubated in 200 µl of PKH67 (Sigma no. PKH67GL) solution (3 µM PKH67 in buffer C) for 5 minutes. The cells were then washed twice with 1% PBS and were fixed in a solution of 4% paraformaldehyde in PBS for 20 minutes. For immunostaining, the cells were fixed in 4% paraformaldehyde, were permeabilized and pre-incubated with blocking solution (0.3% Triton X-100 and 10% normal goat serum in PBS) for 30 minutes, and then incubated overnight at 4°C with antibodies against Lamp2 (ab18528). The cells were then washed 3× (10 minutes/wash) with PBS and incubated with anti-rabbit secondary antibodies in blocking solution for 1 hour at room temperature. The cells were washed twice with PBS for 10 minutes and incubated in PBS containing 4′,6-diamidino-2-phenylindole dihydrochloride (DAPI) (Sigma no. 32670) for 10 minutes. Coverslips were then washed with PBS and mounted on microscope slides in an anti-fade medium (Vector Laboratories, Burlingame, CA). For lysosome staining, cells were incubated in DMEM containing 1 µM Lysosensor green (Life Technologies no. L-7535) for 30 minutes. Cells were then incubated in fresh DMEM for 1.5 hours, then EVs (35 µg protein) were added and cells incubated for 6 hours. Images were acquired using a Zeiss LSM 510 confocal microscope with a 40×objective. The amount of punctate PHK67 fluorescence inside the cell, and the percentage of the total fluorescence that was associated with the lysosomes, were quantified using image J software with the intra_cell plugin, which was developed for the quantification of intracellular fluorescent nanoparticles (Citation11).
Transmission electron microscopy
EV preparations (suspended in PBS) were allowed to adsorb for 5 minutes to freshly ionized 300 mesh formvar/carbon-coated grids, washed briefly through 5–7 puddles of ddH2O, and negatively stained in 2% aqueous uranyl acetate for 30 seconds. Images were taken with transmission electron microscopy (FEI Tecnai G2 Spirit) with a TWIN Lens operating at 100 kV and using an Olympus Soft Imaging System Megaview III digital charged coupled device (CCD).
Nanoparticle tracking analysis
EV suspensions were diluted from 1:20 to 1:200 to result in a concentration of 3–15×108/ml, and they were counted using a NS500 nanoparticle tracking analysis (NTA) system (NanoSight, Amesbury, UK). The EVs were visualized by their scattering of light from a focused laser beam and the collection of the scattered light by a standard optical microscope fitted with a CCD video camera. Five exposures of 20 seconds each were recorded from fields chosen randomly by a computer operating with NanoSight software, which also calculates their size according to the Stokes–Einstein equation.
Cell growth and viability
In order to calculate the cell proliferation rate, 150,000 cells were plated in a 5 cm flask and re-counted after 48–120 hours. The proliferation rate was then calculated using the following equation: In order to quantify cell viability, cells (U87 and HEK293 5,000 cells/well, HeLa 7,000 cells/well, and SH-SY5Y and N2a 10,000 cells/well) were plated in 96-well plates, treated with different culture media, and subjected to MTT analysis (Promega no. G3581) 24 or 48 hours later.
Flourometer analysis
Cells were plated in 96-well plates at the following densities: U87, HEK293T, and SHSY5Y cells −5,000 cells/well; and N2a and HeLa cells −8,000 cells/well. Twenty-four hours later, PKH26-labeled EVs were added at different concentrations and for different time periods as indicated in the text. The uptake of the EVs into the cells was quantified using a fluorescence plate reader with excitation at 530 nm and emission at 567 nm.
Protein quantification
The protein concentration of serum samples was determined by Bradford assay (Bio-Rad no. 500-0006), in a serial dilution range from 1:5 to 1:100.
Statistical analysis
Results are expressed as the mean and SEM of the indicated number of experiments. Statistical comparisons by Student's t-test or chi-squared test (χ2 test) were performed using Excel 2010. The effects of different incubation times with EV-depleted serum on cell viability were tested by 2-way analysis of variance (ANOVA) followed by the Bonferroni post hoc test. This analysis was performed using a Prism software package (Graphpad Software, San Diego, CA, USA).
Results
Generation of EV-depleted FBS and characterization of EVs
Isolation of EVs from culture medium involves high-speed centrifugation. However, there is no standardized protocol for EV removal, with different labs using considerably different centrifugation forces (100,000–200,000g) and time periods (1–16 hours). We used 120,000g centrifugation for times ranging from 1 to 6 hours. The concentration of nanoparticles (a size range of 40–400 nm) in the serum was measured before and after centrifugation by NTA (A). The nanoparticle concentration was reduced by 2.6-fold by 1 hour of centrifugation, 4.2-fold by 2 hours, 5.3-fold by 4 hours, and 7-fold by 6 hours. A presents the particle concentration in absolute numbers. To verify that the depleted particles are EVs, control and nanoparticle-depleted FBS were examined by electron microscopy in uncentrifuged FBS and ultracentrifuged FBS (2 hours centrifugation; B). In order to determine if the particles isolated from the FBS contain mostly EVs, and in particular exosome-like vesicles, electron microscopy (C), sucrose gradients (D), and analysis of protein content (E) were employed. C shows a representative electron microscope image of the particles isolated from FBS. The diameter of most membrane vesicles was between 30 and 120 nm, with the spherical shape typical of exosomes. Longer centrifugation times increased the background amount of amorphous particles in the electron microscope images, likely because of pelleted proteins and/or ribonucleoprotein aggregates. The size of most of these aggregates was below the detection limit of NTA; however, we cannot exclude that some non-exosome particles were detected by NTA. Exosome-size EV sedimentation in sucrose was between 1.11 and 1.19 mg/ml (Citation9, Citation12). Validation of the presence of exosome-like EVs following sedimentation in a sucrose gradient is usually performed using antibodies against exosome-specific proteins; however, commercially available anti-FLOT2, -TSG101, and -CD81 antibodies did not cross-react with bovine proteins, and an anti-FLOT1 antibody had very low cross-reactivity. Thus, the recovery of EV in the different fractions was evaluated by electron microscopy and NTA (D). These analyses demonstrate enrichment of EV in the 1.13 to 1.17 fraction, which is typical for exosomes. Interestingly, some vesicles were present in all other fractions (D).
Fig. 1. Characterization of FBS EVs and EV-depleted FBS. (A) FBS was depleted of EV by 10,000g centrifugation for 40 minutes, followed by 120,000g centrifugation for the indicated time periods. The FBS particle (50–500 nm) concentration was measured by NTA using a NanoSight NS-500 instrument (n = 3 for each time point). (B) FBS (upper panel) and FBS depleted of EVs by 2 hours of centrifugation at 120,000g (lower panel) were concentrated and visualized by transmission electron microscopy (bar = 200 nm). (C) Representative images of EVs isolated from 20 ml FBS by 120,000g centrifugation for the indicated time periods (bar = 200 nm). (D) EVs isolated from 40 ml FBS by 120,000g centrifugation for 2 hours were loaded on top of a sucrose gradient and centrifuged at 150,000g for 16 hours. Six fractions of different densities (as indicated) were separated, and EV sizes and amounts were measured by transmission electron microscopy (upper panels) and NTA (lower graph) (n = 2). (E) 4 µg of protein from FBS, FBS depleted of EV by 2 hours of centrifugation at 120,000g, EV isolated from FBS, and well-characterized human exosomes were run on a 4–12% Bis-Tris gel, and the global protein patterns were determined by silver staining (n = 3). (F) The efficacy of FBS EV isolation (2-hour ultracentrifugation) was calculated by dividing the amount of isolated EVs by the difference in particle number in FBS and EV-depleted FBS (n = 3).
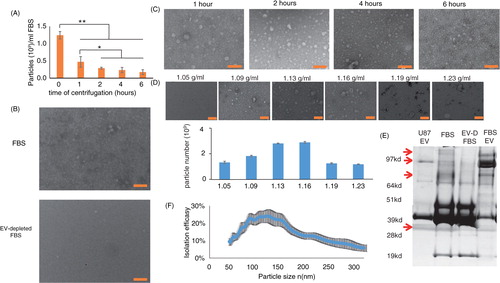
To compensate for the relative lack of antibodies against bovine exosome marker proteins, we measured the global protein size pattern by silver staining. E shows a representative silver stain of 4 µg protein harvested from uncentrifuged FBS, EV-depleted FBS, FBS-derived EVs, and well-defined exosomes released into culture medium by a human glioblastoma cell line. Notice that the protein size pattern is similar (but not identical) for the FBS-derived EVs and the glioblastoma cell-derived exosomes. In addition, there were 4 proteins (marked by arrows) that were found in the FBS and FBS-derived EVs, but they were remarkably diminished in the EV-depleted FBS (E). Altogether, these results show that 2 hours of centrifugation depletes most but not all EVs from the serum.
EV isolation efficiency
The numbers of FBS-derived EVs recovered after different centrifugation times were counted by NTA. The isolation efficiency was then calculated by dividing the number of isolated EVs of a certain size by the difference of particle numbers of the same size between FBS and EV-depleted FBS: . The efficiency of EV removal was size dependent (F). Overall, the efficiency of the EV isolation was about 25±11%; this moderate efficiency may be a consequence of many EVs adhering to the plastic tube, as different re-suspension protocols can increase the recovery from the EV pellet (KWW, unpublished data).
FBS EVs enhance cell proliferation and survival
U87 glioblastoma, HEK-293T, HeLa, SY5Y human neuroblastoma, and N2a mouse neuroblastoma cells were grown in culture medium containing 10% FBS or 10% EV-depleted FBS. Cell numbers were counted before seeding and 2–5 days later. The growth rates of the different cell types were calculated as the average 24-hour population doubling. The results presented in A show that, except for U87 cells, cell lines grown in the presence of EV-depleted medium had significantly reduced growth rates. Similar to the population doubling rate, all cell types except U87 had significantly lower levels of MTS intensity (viable cell number) after 48 hours of growth in medium containing EV-depleted FBS compared with regular FBS. To confirm that the reduced growth rate was due to EV depletion, the rescue effect of isolated FBS EVs was determined. Adding different concentrations of FBS-derived EVs to EV-depleted medium reversed the observed growth reduction (B). These results were consistent among 4 different batches of Hyclone FBS and when the FBS was purchased from ATCC or Gibco (C and Supplementary Fig. 1). Thus, the effect of FBS-derived EVs was evident with different batches and commercial sources of FBS. The reduction in HEK growth rate was verified by a blind recognition test performed as follows: cells were plated in 36 wells and were randomly divided into 3 groups of 12 (group 1 with 10% FBS, group 2 with 10% EV-depleted FBS, and group 3 with 10% EV-depleted FBS supplemented with isolated FBS EVs), and the cells were allowed to grow for 72 hours. An experienced observer blinded to the different conditions was asked to divide the 36 wells into 3 groups of 12 based on the cell number and appearance of the cells. Nine of the twelve wells in the EV-depleted FBS condition were recognized as different from the other 2 conditions significantly more often than expected by random chance (p<0.003 by χ-test). Moreover, 2 of the 3 misclassifications were with group 3 (FBS EV rescue). Because the effect of FBS EVs on cell growth could be species dependent, the ability of EV-depleted human serum to support cell growth was measured by MTS cell proliferation assay. D shows that the viability of N2a, HEK, and U87 cells grown with EV-depleted human serum was lower than that of the same cells grown in EV-containing medium.
Fig. 2. Cells maintained in EV-depleted serum exhibit reduced cell growth. (A) 150,000 cells were plated in a 5 cm flask and counted again after the indicated times. The 24-hour proliferation rate was calculated. Each cell type is normalized to its control, which is indicated by the gray line (n = 4 for the sSY5Y and HeLa cells; n = 7 for the other cell lines). (B) Cells were grown for 48 hours with regular 10% FBS, EV-depleted 10% FBS, or EV-depleted 10% FBS with isolated FBS EVs. Cell viability was measured by MTS assay (n = 6). (C) Using the same experimental design as in (B), MTS assays were performed on HEK, N2a, and U87 cells incubated in DMEM containing control and EV-depleted FBS from ATCC and Gibco as well as from Hyclone. (D) The indicated cell types were grown for 48 hours with 10% human serum or EV-depleted human serum. Viability was measured by MTS assay (n = 6). *p < 0.05; **p < 0.01; ¶p < 0.05 compared to the value for EV-depleted FBS or to the EV rescue. The p values for panels A, C, and D were calculated by 2-way ANOVA; and, for panel B, by Student's t-test.
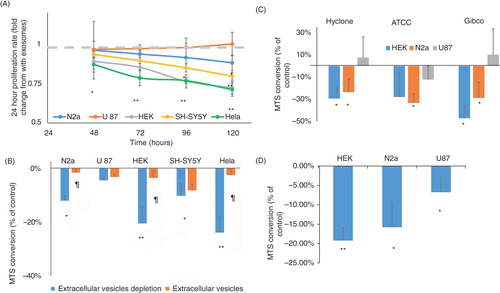
Fig. 3. EV-depleted serum does not affect cell sensitivity to DNA damage and endoplasmic reticulum stress. (A–F) Cells were maintained in 10% FBS, EV-depleted 10% FBS or EV-depleted 10% FBS with isolated FBS EVs for 24 hours. Then, (A) HEK, (C) N2a, and (E) U87 cells were exposed for an additional 24 hours to the indicated concentrations of etoposide (n = 5). (B) HEK, (D) N2a, and (F) U87 cells were exposed for an additional 24 hours to the indicated concentrations of tunicamycin (n = 5). (G) HEK, N2a, and U87 cells were maintained for 24 hours in 10% human serum or 10% EV-depleted human serum. Then, 2 µg/ml tunicamycin or 50 nM etoposide was added for an additional 24 hours, and cell viability was measured by MTS assay. In all panels, the results are normalized to cells that were grown with the same media, but without etoposide or tunicamycin. For panels (A–F), the p values were determined by 2-way ANOVA and, for panel (G), by t-test analysis; *p< 0.05.
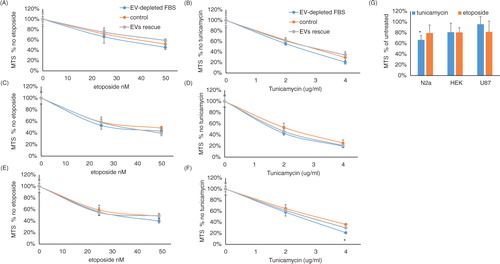
We next asked whether EV depletion affected only cell growth or also sensitivity of the cells to stress. To this end, DNA damage was induced with the topoisomerase 2 inhibitor etoposide, and the unfolded protein response was induced with the UDP–HexNAc inhibitor tunicamycin, which induces endoplasmic reticulum stress. The results, depicted in , show that although cells cultured with EV-depleted FBS grow slower, they are not more sensitive to etoposide or tunicamycin. HEK cells and N2a cells had consistently lower cell numbers (Supplementary Fig. 2A and B, respectively). Normalizing the cell growth reduction, resulting from the combination of EV-depleted FBS and etoposide or tunicamycin, to the reduction of EV-depleted FBS alone shows that there is no increase in sensitivity of HEK (B and C) and N2a cells (D and E) to etoposide or tunicamycin. U87 cells showed very slight cell growth reduction (Supplementary Fig. 2C) and a significant increase in sensitivity to a high concentration of tunicamycin but not to a low concentration (F) or to etoposide (E). Adding FBS exosomes completely rescued the reduced cell growth effect of EV-depleted FBS, but it did not change the cell viability in response to etoposide (A, C, and E for HEK, N2a, and U87 cells, respectively) or tunicamycin (B, D, and F for HEK, N2a, and U87 cells, respectively). Interestingly, although EV-depleted human serum did not significantly affect the sensitivity of human cell lines (HEK and U87) to tunicamycin or etoposide, human serum lacking EVs significantly increased the vulnerability of the mouse N2a cell line to tunicamycin, but not to etoposide (G).
FBS EVs are internalized by cultured cells
EVs can exert biological effects by interacting with the cell surface or by entering into cells. EVs isolated from FBS were labeled with PKH27, a red fluorescent lipophilic dye that labels membranes, and added to the N2A, U87, and HEK cell lines. Exosome–cell interactions were measured using a fluorometer, and they were found to be dose and time dependent (A and B, respectively). In order to determine whether the EVs adhere to the cell surface or are internalized into the cells, we labeled cells with PKH67, a green membrane dye, and analyzed EV internalization by confocal microscopy. C shows representative images demonstrating internalization of the EVs into N2a, HEK, and U87 cells. We observed local punctate EV accumulations inside the cells.
Fig. 4. FBS-derived EVs are internalized into cells by endocytosis. Isolated FBS EVs were labeled with the membrane dye PKH26 (red), and the free dye was removed by two 120,000g centrifugations. (A) U87, N2a, and HEK cells were grown for 6 hours in the presence of different amount of PKH26-labeled EVs. Free EVs were washed from the cells, and the level of internalization was quantified using a fluorometer plate reader (n=7). (B) PKH26-labeled EVs that contained 35 µg protein were added to different cell types in culture medium for the indicated times. Free EVs were washed, and the level of internalization was quantified using a fluorescence plate reader. The left panel shows the fluorescence after 1 hour of incubation in absolute numbers, and the right panel shows the time-dependent internalization normalized to that time point (n=4). (C) Representative images of isolated FBS EVs labeled with PKH26 (red) within N2a, U87, and HEK cells labeled with PKH67 (green). (D) The FBS-derived EVs were treated with 1 mg/ml of trypsin; free trypsin was removed by washing before the EVs were added to the cells. In different wells, the cells were treated with inhibitors (amiloride, 2 and 4 mM; latrunculin A, 2.5 and 5 µM; bafilomycin A, 20 and 40 nM; and heparin, 5 and 10 µg/ml) 30 min before regular EVs (not treated with trypsin) containing 35 µg protein were added. The internalization was measured after 6 hours of incubation (n=5). *p< 0.05, *p<0.01.
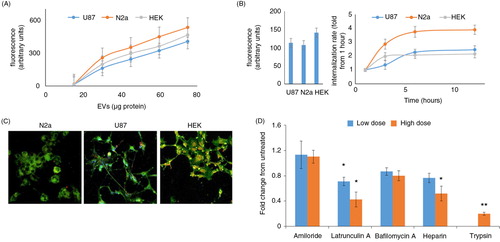
Most of the FBS EV internalization is a protein-mediated mechanism because trypsin treatment inhibited 81% of the internalization (D). The addition of heparin or the actin polymerization inhibitor latrunculin A 30 minutes before the addition of the FBS EVs reduced their internalization by 49 and 58%, respectively (D). This reduction suggests that endocytosis is important for EV internalization. In contrast, micropinocytosis that was previously reported to be a major exosome entrance pathway in microglia and macrophages (Citation13, Citation14) does not play a major role in the internalization of FBS EVs by HEK293 cells because amiloride and bafilomycin had no significant effect on the EV internalization (D).
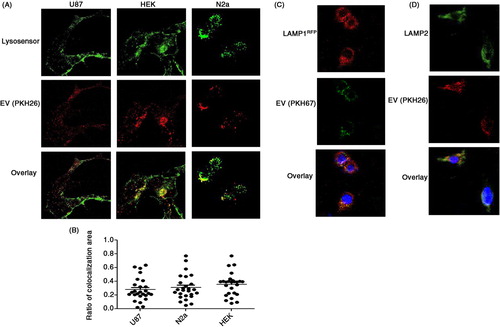
It was previously observed that, in some cases, EVs are targeted to the lysosomes (Citation15). A shows representative images of N2a, U87, and HEK cells co-labeled with the lysosome sensor “Lysosensor Green DND 189” and PKH26 (EVs). The percentages of EVs associated with lysosomes were calculated to be 62, 51, and 46% in N2a, HEK, and U87 cells, respectively (B). This quantification was performed with the Image J intra_cell plugin, developed for the quantification of nanoparticle cellular internalization (Citation11). The association of FBS-derived EVs with lysosomes was also shown by transfecting HEK293 cells with LAMP1-RFP and then treating them with PKH67 (green)-labeled EVs (C), and by immunostaining with LAMP2 antibody (D). Interactions between FBS-derived EVs and mitochondria or nuclei were not detected (data not shown).
Fig. 5. Internalized FBS-derived EVs are associated with lysosomes. U87, HEK293, and N2a cells were grown on a confocal suitable plate. (A) Lysosomes were stained with Lysosensor Green 2 hours before isolated FBS EVs labeled with PKH26 (red) were added (n=4). (B) The percentage of co-localization between FBS-derived EVs and lysosomes was determined using the Image J plugin intra_cell (10 images from each of 4 separate experiments were analyzed). (C) HEK293 cells were transfected with a plasmid to express LAMP1-RFP and were treated with FBS-derived EVs labeled with PKH67 (green) (n=3). (D) HEK293 cells were grown on cover slips, fixed with paraformaldehyde, and stained with LAMP2 antibodies (n=3).
Discussion
EVs are abundant in most body fluids, and data suggest that most cells are therefore exposed to such circulating EVs in vivo (Citation5). The functions of EVs in body fluids are mostly unknown, but they may include roles in signaling and removal of damaged and aggregated proteins. Cultured cells are mostly grown in the presence of serum, which contains high concentrations of EVs. Here we show that EVs in FBS, the most commonly used serum for cell culture, support cell growth and reduce cell sensitivity to genotoxic and endoplasmic reticulum stress. We found that FBS-derived EVs enter cells, where many of them interact with lysosomes.
The field of EVs, and exosome research in particular, is growing rapidly as indicated by a doubling of the number of publications retrieved on the PubMed database using the search term “exosomes” within the past 2 years. It has been recognized that generating EV-depleted FBS is necessary for obtaining EVs from cells of interest without contamination of serum EV; the common practice is to deplete EVs by high-speed centrifugation (Citation9). However, EV depletion procedures vary between labs regarding several parameters, including the amount of serum dilution (necessary for reducing viscosity) and centrifugation speed and time. These parameters may determine the efficacy and specificity of the EV depletion. We found that a relatively short centrifugation time (1 hour) reduced the EV concentration by only 2.2-fold, whereas a longer centrifugation (6 hours) resulted in a 7-fold reduction in the EV but also increased the amount of non-EV material observed in electron microscopy images, suggesting reduced specificity of depletion. These findings suggest that a standardized protocol for generating EV-depleted serum will be required for a valid comparison of results among studies in different laboratories.
Studying FBS EVs is a challenge because of the scarcity of antibodies against bovine proteins. For that reason, we used EM and NTA for the detection of EVs following their separation by sucrose gradient centrifugation. Interestingly, by this technique, EVs were detected in varying amounts in all sucrose densities tested, with a 2-fold enrichment in the 1.13–1.16 gr/ml fractions previously reported to contain exosomes. The detection of EVs in other fractions is probably a consequence of the low specificity and high sensitivity of the EM methodology. It was previously reported that, in some cases, different EV markers are detected in sucrose density fractions adjacent to the 1.13–1.16 gr/ml fractions (Citation12, Citation16). This suggests the existence of mixed EV types, possibly with different lipid and protein contents that determine their sedimentation.
Another important question in the EV field is: what is the yield of EV in isolation procedures? We calculated a yield of about 25% using our EV isolation protocol. A caveat of this calculation is that the NTA analysis method does not distinguish between vesicles, protein aggregates, and lipid droplets (Citation17). Thus, the calculated efficacy is for isolation of all particles within the EV size range and not EV in particular. Even so, EM images showed that the isolated fraction contained mostly vesicles of size and spherical shape consistent with those of exosomes. In addition, repeating the same calculation using values for cholesterol and protein concentrations resulted in comparable efficacies of 32 and 17%, respectively.
EV-depleted FBS did not have an immediate negative effect on cell growth. No significant differences could be detected in the first 24 hours, and in most cell types even in the first 48 hours. This lag in growth rate reduction suggested that EV-depleted FBS does not have a toxic effect on cells and is not devoid of proliferation signals. The lag in cell growth reduction rate may also result, in part, from residual growth signals from the FBS-containing medium in which the cells were maintained prior to switching to medium containing EV-depleted FBS. Adding EVs isolated from FBS to cells grown with EV-depleted media abolished the growth rate reduction. Interestingly, EV-depleted FBS did not increase cell sensitivity to DNA damage and unfolded protein accumulation. The factors in the serum exosomes that promote cell growth remain to be determined, but they could involve a protein, microRNA (miRNA), or cellular energy substrate. Examples of candidates for such a cellular growth factor that have been reported to be present in EVs include Wnt (Citation18), TGFβ (Citation19), and sonic hedgehog (Citation20). Anti-apoptotic proteins such as survivin have also been found in exosomes and may mediate the cell survival-promoting actions of EVs (Citation19).
EVs may exert their effects on cells by interacting with the cell surface, fusing with the plasma membrane, and releasing their contents into the cells, or by entering into the cells as intact vesicles (Citation7). The interaction of the FBS EVs with mouse and human cell lines was examined by labeling the EV with the lipophilic dye PKH. After adding the PKH-labeled EVs to the medium of cultured cells, we detected the fluorescence inside the cells and not on the plasma membrane, suggesting that the FBS EVs are internalized by the cultured cells. Because the appearance of the punctate PKH fluorescence inside the cells was inhibited by latrunculin A and trypsin, it apparently requires membrane surface protein-dependent endocytosis (Citation21). Inside the cells, most of the FBS-derived EVs (60%) are associated with lysosomes. The interaction of internalized EVs with lysosomes suggests a potential role in providing biosynthetic precursors (e.g. amino acids and lipids), which is one known function of lysosomes. Consistent with our findings, it was previously reported that internalized human exosomes interact with lysosomes (Citation15). The inhibition of FBS-derived EV internalization by trypsin suggests that most (80%) of the internalization is mediated by a well-conserved receptor. It is important to note that serum probably contains a mixed population of EV. The current methodologies do not distinguish between uptakes of different EV types; thus, it is possible that only a subset of serum EVs are internalized. It is important to note that the amount of FBS EVs used for this analysis is equivalent to the number of EVs in medium containing 35% FBS. This concentration of EVs was a necessity for readily detecting the intracellular fluorescence of these nanosized particles. It is also important to note that the FBS used for cell culture undergoes heat inactivation, 0.1 µm filtration, and at least 2 cycles of freeze and thaw, which probably influences some biological activities of the EVs.
The effects of EV-depleted FBS on cell growth rate in the present study, and the recent reports that EV-depleted FBS enhances macrophage activation in response to LPS (Citation21) 550 and inhibits migration of lung cancer epithelial cells (Citation22), show that FBS-derived EVs possess prominent biological activities. This suggests that future studies aimed at elucidating the role of EVs from specific cell types should take into consideration the EVs in medium supplemented with FBS. The molecular mechanisms by which EVs stimulate cell growth and survival are not clear yet. Previous findings suggest several potential mechanisms, including miRNAs that target genes involved in cell differentiation or death (Citation23), and transfer of lipids critical for cell growth (Citation24). Protein chaperones such as heat shock protein 70 (HSP70), HSP27, and HSP90 have been reported to be released from cells in exosomes (Citation25–Citation27), suggesting 1 potential cellular source of cytoprotective EVs in serum. Elucidation of the molecular mechanisms by which EVs in serum enhance cell proliferation and survival may advance efforts to develop serum-free media that support rapid cell expansion for therapeutic purposes.
Conflict of interest and funding
The authors have not received any funding or benefits from industry or elsewhere to conduct this study.
Supplementary figure
Download PDF (1.7 MB)Acknowledgements
This work was supported by the Intramural Research Program of the National Institute on Aging, National Institutes of Health (NIH).
Notes
To access the supplementary material to this article, please see Supplementary files under ‘Article Tools’.
References
- Jayme D, Watanabe T, Shimada T. Basal medium development for serum-free culture: a historical perspective. Cytotechnology. 1997; 23: 95–101. [PubMed Abstract] [PubMed CentralFull Text].
- Eagle H. The salt requirements of mammalian cells in tissue culture. Arch Biochem Biophys. 1956; 61: 356–66. [PubMed Abstract].
- Brunner D, Frank J, Appl H, Schoffl H, Pfaller W, Gstraunthaler G. Serum-free cell culture: the serum-free media interactive online database. Altex. 2010; 27: 53–62. [PubMed Abstract].
- Caby MP, Lankar D, Vincendeau-Scherrer C, Raposo G, Bonnerot C. Exosomal-like vesicles are present in human blood plasma. Int Immunol. 2005; 17: 879–87. [PubMed Abstract].
- Lasser C, Alikhani VS, Ekstrom K, Eldh M, Paredes PT, Bossios A et al. Human saliva, plasma and breast milk exosomes contain RNA: uptake by macrophages. J Transl Med. 2011; 9: 9. [PubMed Abstract] [PubMed CentralFull Text].
- Gyorgy B, Szabo TG, Pasztoi M, Pal Z, Misjak P, Aradi B et al. Membrane vesicles, current state-of-the-art: emerging role of extracellular vesicles. Cell Mol Life Sci. 2011; 68: 2667–88. [PubMed Abstract] [PubMed CentralFull Text].
- Meckes DG Jr., Raab-Traub N. Microvesicles and viral infection. J Virol. 2011; 85: 12844–54. [PubMed Abstract] [PubMed CentralFull Text].
- EL Andaloussi S, Mager I, Breakefield XO, Wood MJ. Extracellular vesicles: biology and emerging therapeutic opportunities. Nat Rev Drug Discov. 2013; 12: 347–57. [PubMed Abstract].
- Witwer KW, Buzas EI, Bemis LT, Bora A, Lasser C, Lotvall J. Standardization of sample collection, isolation and analysis methods in extracellular vesicle research. J Extracell Vesicles. 2013; 2 20360, doi: http://dx.doi.org/10.3402/jev.v2i0.20360 [PubMed CentralFull Text].
- Sherer NM, Lehmann MJ, Jimenez-Soto LF, Ingmundson A, Horner SM, Cicchetti G et al. Visualization of retroviral replication in living cells reveals budding into multivesicular bodies. Traffic. 2003; 4: 785–801. [PubMed Abstract].
- Sneh-Edri H, Stepensky D. ‘IntraCell’ plugin for assessment of intracellular localization of nano-delivery systems and their targeting to the individual organelles. Biochem Biophys Res Commun. 2011; 405: 228–33. [PubMed Abstract].
- Calzolari A, Raggi C, Deaglio S, Sposi NM, Stafsnes M, Fecchi K et al. TfR2 localizes in lipid raft domains and is released in exosomes to activate signal transduction along the MAPK pathway. J Cell Sci. 2006; 119: 4486–98. [PubMed Abstract].
- Fitzner D, Schnaars M, van Rossum D, Krishnamoorthy G, Dibaj P, Bakhti M et al. Selective transfer of exosomes from oligodendrocytes to microglia by macropinocytosis. J Cell Sci. 2011; 124: 447–58. [PubMed Abstract].
- Mulcahy LA, Pink RC, Carter DR. Routes and mechanisms of extracellular vesicle uptake. J Extracell Vesicles. 2014; 3 24641, doi: http://dx.doi.org/10.3402/jev.v3.24641.
- Tian T, Wang Y, Wang H, Zhu Z, Xiao Z. Visualizing of the cellular uptake and intracellular trafficking of exosomes by live-cell microscopy. J Cell Biochem. 2010; 111: 488–96. [PubMed Abstract].
- Lai RC, Tan SS, Teh BJ, Sze SK, Arslan F, de Kleijn DP et al. Proteolytic potential of the MSC exosome proteome: implications for an exosome-mediated delivery of therapeutic proteasome. Int J Proteomics. 2012; 2012: 971907. [PubMed Abstract] [PubMed CentralFull Text].
- Sokolova V, Ludwig AK, Hornung S, Rotan O, Horn PA, Epple M et al. Characterisation of exosomes derived from human cells by nanoparticle tracking analysis and scanning electron microscopy. Colloids Surf B Biointerfaces. 2011; 87: 146–50. [PubMed Abstract].
- Gross JC, Chaudhary V, Bartscherer K, Boutros M. Active Wnt proteins are secreted on exosomes. Nat Cell Biol. 2012; 14: 1036–45. [PubMed Abstract].
- Webber J, Steadman R, Mason MD, Tabi Z, Clayton A. Cancer exosomes trigger fibroblast to myofibroblast differentiation. Cancer Res. 2010; 70: 9621–30. [PubMed Abstract].
- Mackie AR, Klyachko E, Thorne T, Schultz KM, Millay M, Ito A et al. Sonic hedgehog-modified human CD34+ cells preserve cardiac function after acute myocardial infarction. Circ Res. 2012; 111: 312–21. [PubMed Abstract] [PubMed CentralFull Text].
- Christianson HC, Svensson KJ, van Kuppevelt TH, Li JP, Belting M. Cancer cell exosomes depend on cell-surface heparan sulfate proteoglycans for their internalization and functional activity. Proc Natl Acad Sci USA. 2013; 110: 17380–5. [PubMed Abstract] [PubMed CentralFull Text].
- Beninson LA, Fleshner M. Exosomes in fetal bovine serum dampen primary macrophage IL-1beta response to lipopolysaccharide (LPS) challenge. Immunol Lett. 2014; 163: 187–92. [PubMed Abstract].
- Shelke GV, Lasser C, Gho YS, Lotvall J. Importance of exosome depletion protocols to eliminate functional and RNA-containing extracellular vesicles from fetal bovine serum. J Extracell Vesicles. 2014; 3 24783, doi: http://dx.doi.org/10.3402/jev.v3.24783 [PubMed CentralFull Text].
- Yamasaki S, Anderson P. Reprogramming mRNA translation during stress. Curr Opin Cell Biol. 2008; 20: 222–6. [PubMed Abstract] [PubMed CentralFull Text].
- Llorente A, Skotland T, Sylvanne T, Kauhanen D, Rog T, Orlowski A et al. Molecular lipidomics of exosomes released by PC-3 prostate cancer cells. Biochim Biophys Acta. 2013; 1831: 1302–9. [PubMed Abstract].
- Choi DS, Kim DK, Kim YK, Gho YS. Proteomics, transcriptomics and lipidomics of exosomes and ectosomes. Proteomics. 2013; 13: 1554–71. [PubMed Abstract].
- Beninson LA, Brown PN, Loughridge AB, Saludes JP, Maslanik T, Hills AK et al. Acute stressor exposure modifies plasma exosome-associated heat shock protein 72 (Hsp72) and microRNA (miR-142-5p and miR-203). PLoS One. 2014; 9: e108748. [PubMed Abstract] [PubMed CentralFull Text].