
Abstract
Background
Lung cancer is one of the leading causes of cancer-related death. At the time of diagnosis, more than half of the patients will have disseminated disease and, yet, diagnosing can be challenging. New methods are desired to improve the diagnostic work-up. Exosomes are cell-derived vesicles displaying various proteins on their membrane surfaces. In addition, they are readily available in blood samples where they constitute potential biomarkers of human diseases, such as cancer. Here, we examine the potential of distinguishing non-small cell lung carcinoma (NSCLC) patients from control subjects based on the differential display of exosomal protein markers.
Methods
Plasma was isolated from 109 NSCLC patients with advanced stage (IIIa–IV) disease and 110 matched control subjects initially suspected of having cancer, but diagnosed to be cancer free. The Extracellular Vesicle Array (EV Array) was used to phenotype exosomes directly from the plasma samples. The array contained 37 antibodies targeting lung cancer-related proteins and was used to capture exosomes, which were visualised with a cocktail of biotin-conjugated CD9, CD63 and CD81 antibodies.
Results
The EV Array analysis was capable of detecting and phenotyping exosomes in all samples from only 10 µL of unpurified plasma. Multivariate analysis using the Random Forests method produced a combined 30-marker model separating the two patient groups with an area under the curve of 0.83, CI: 0.77–0.90. The 30-marker model has a sensitivity of 0.75 and a specificity of 0.76, and it classifies patients with 75.3% accuracy.
Conclusion
The EV Array technique is a simple, minimal-invasive tool with potential to identify lung cancer patients.
To access the supplementary material to this article, please see Supplementary files under “Article Tools”.
To date lung cancer accounts for more deaths each year than any other type of cancer (Citation1). The 5-year survival rate for non-small cell lung cancer (NSCLC) is currently 11–18% (Citation2, Citation3). Because the majority of NSCLC patients present the advanced stage disease, the outcome is often fatal (Citation4). Still, diagnosing NSCLC can be challenging, and new methods to support the already used clinical tools are needed to secure a better overall outcome.
Exosomes are small vesicles formed in multi-vesicular bodies and subsequently released through exocytosis (Citation5). Multiple experiments have investigated and established that exosomes display various proteins on their membrane surface (Citation6, Citation7). Additionally, exosomes are readily available in the blood stream (Citation8) and hereby constitute potential biomarkers of human diseases, such as cancer. Previous studies have identified plasma exosomes as useful markers in several cancer diseases including lung cancer Citation9–(Citation11) . So far, a panel of 12 miRNAs and membrane proteins such as CD91, CD317 and EGFR have been suggested as potential exosomal markers of NSCLC (Citation9, Citation12) (Citation13). Nevertheless, studies concerning the diagnostic potential of exosomes in cancer patients have so far been complicated by high workload procedures when isolating and investigating plasma exosomes using ultracentrifugation. Furthermore, prior methodological constraints have enforced a single exosome-marker focus, which has had a negative bearing on sensitivity as well as the gain of new knowledge.
Protein microarrays are potent tools for investigating antigens or antibodies in samples such as plasma. In addition, they harbour an advantage over other methods by being able to detect multiple proteins simultaneously (Citation14). Recently, it was shown that adjusted protein microarrays can capture extracellular vesicles fitting the description of exosomes (Citation15), which here and in the following refers to vesicles expressing CD9, CD63 and/or CD81 and having a size of 30–100 nm.
The Extracellular Vesicle Array (EV Array) is a sandwich-ELISA-based method capturing exosomes using an antibody panel targeting the extracellular domain of selected membrane or membrane-associated proteins. The EV Array constitutes a fast, automated, economical and highly sensitive method for exploration of plasma exosomes while consuming as little as 10 µL sample.
Developing a plasma test for lung cancer detection is an attractive approach owed to the easy accessibility of blood samples and the minimal discomfort for the patients providing them. Reliable and easy performed diagnostic tools are particularly important in NSCLC patients, where effective minimal-invasive blood-based diagnostic methods are currently limited. The EV Array shows great potential as such a diagnostic tool. The aim of the present study was to explore the potential of plasma exosomes in diagnosing NSCLC, using a multi-marker approach based on multivariate analysis.
Material and methods
Patient samples
The plasma samples included in this study were collected from patients suspected of having lung cancer due to clinical symptoms. Patients were examined from May 2011 until January 2014 at the Department of Pulmonary Medicine, Aarhus University Hospital, Denmark. The outcome of the examination was undetermined at time of inclusion. One hundred and nine patients with NSCLC adenocarcinoma stage IIIa–IV were consecutively collected. A control group was made of 110 patients who were diagnosed to be cancer free based on computed axial tomography and, if relevant, negative biopsies. The only exclusion criterion was cancer. Since infection and inflammation are frequently observed amongst patients with lung cancer, acute or chronic infection or inflammation of any kind were not considered reason for exclusion. By doing so, a control group resembling the clinical situation in a diagnostic outpatient department could be made.
Phenotyping of extracellular vesicles using the EV Array
Production of microarrays
Microarray printing was performed on a SpotBot ® Extreme Protein Edition Microarray Printer with a 946MP4 pin (ArrayIt Corporation, CA, USA). As a positive control 100 µg/mL of biotinylated human IgG was printed and PBS with 5% glycerol was used as negative control. Antibodies were printed on epoxy-coated slides (75.6 mm×25.0 mm; SCHOTT Nexterion, DE), which were left to dry at room temperature overnight prior to further analysis.
Antibodies for production of the EV Array
A total of 37 anti-human antibodies were used and listed in the following with the corresponding clone, if available: CD146 (P1H12), Flotillin-1, HB-EGF (4G10), HER3 (2F9), HER4 (H4.77.16), Hsp90 (IGF1), N-cadherin (8C11), p53 (pAb240), TAG72 (0.N.561), and TSG101 (5B7) from Abcam (MA, USA); SFTPD (VIF11) from Acris Antibodies GmbH (DE); EGFR and EGFRvIII from Antibodies-online.com (DE); CD63 (MEM-259) from Biolegend (CA, USA); HER2 (29D8) from Cell Signalling (MA, USA); CD9 and CD81 from LifeSpan BioSciences (WA, USA); SPA (6F10) from Novus Biologicals (CO, USA); CD13 (498001), CD14 (50040), CD142 (323514), CD151 (210127), CD206, CEA (487609), MUC1 (604804), TNF RI, TNF RII and Tspan8 (458811) from R&D Systems (MN, USA); AREG (S-13), EpCam (0.N.277), Mucin16 (X306), NY-ESO-1 (E978) and PLAP (8B6) from Santa Cruz Biotechnologies (TX, USA); CD171 from Sigma-Aldrich (MO, USA); c-MET (016) and PD-L1 from Sino Biological Inc. (China); CD163 (Mac2-158) from Trillium Diagnostics, LLC (ME, USA). All antibodies were diluted with PBS with 5% glycerol and printed in triplicates at 75–200 µg/mL.
Catching and visualization of exosomes
The EV Array was prepared as described by Jørgensen et al. (Citation15) with modifications. In short, the microarray slides were initially blocked (50 mM ethanolamine, 100 mM Tris, 0.1% SDS, pH 9.0) prior to incubation with 10 µL plasma sample diluted (1:10) in wash-buffer (0.05% Tween ® 20 in PBS). The incubation was performed in Multi-Well Hybridization Cassettes (ArrayIt Corporation) at RT for 2 hours followed by overnight incubation at 4°C. Following a short wash, the slides were incubated with a cocktail of biotinylated detection antibodies (anti-human-CD9, -CD63 and -CD81, LifeSpan BioSciences, WA, USA) diluted 1:1,500 in wash-buffer. After a wash, a subsequent 30-minute incubation step with Cy5-labelled streptavidin (Life Technologies) diluted 1:1,500 in wash-buffer was carried out for detection. Prior to scanning, the slides were washed in wash-buffer, then in ultrapure/deionized water and finally dried using a Microarray High-Speed Centrifuge (ArrayIt Corporation). Scanning and spot detection was performed as previously described (Citation15).
Data analysis
Graphs and statistics were carried out using GraphPad Prism (version 6.04, GraphPad Software, Inc., San Diego, CA, USA), Excel (version 2013, Microsoft, Redmond, WA, USA) and ROCCET (Version 03/17/2014, TMIC, AB, Canada). Heat maps and Hierarchical cluster analysis were produced using Genesis (version 1.7.6, IGB TU Graz, Graz, Austria).
Multivariant ROC analysis
Random Forests was used for classification and Monte-Carlo cross validation (MCCV) using balanced subsampling was employed to compute ROC curves and to calculate confidence intervals of their area under the curve (AUC). In each MCCV, two thirds (2/3) of the samples were used to evaluate the feature importance. The top important features were then used to build a classification model, which was validated on the 1/3 of the samples that were left out. Five hundred iterations were used to calculate performance of the model. Prior to analysis missing value estimation was performed by replacing missing values by “min.” A Top 20 of ratios (based on p-values) was computed and included into the analysis prior to data transformation and normalization by log2.
Results
Exosomal markers can be detected in small amounts of plasma
The EV Array analysis was performed on 109 plasma samples from patients diagnosed with stage IIIa–IV NSCLC adenocarcinoma and on 110 plasma samples from patients without a cancer diagnosis (Table ). Even though only 10 µL unpurified plasma sample was loaded for each patient, sufficient signal for further analysis was obtained from all samples.
Table I. Selected baseline patient characteristics for the two study groups
Thirty-seven different antibodies were used for the analysis of plasma exosomes. Some markers were previous used and optimised for EV Array analysis (Citation15). In addition, antibodies targeting markers involved in NSCLC pathology were optimised for the EV Array analysis. For this purpose, members of the EGF system and selected markers of inflammation (CD163, CD206) (Citation16, Citation17) were selected (Table ).
Table II. Description of the markers selected for the EV Array together with the outcome (p-value) of the non-parametric t-test comparing the log2 transformed data from the control group and the cancer group (Supplementary Fig. 1a and b)
Univariate analysis of exosomal markers
The univariate analysis of each marker using log2-transformed signal-values revealed generally a significantly higher marker-expression in control subjects compared to lung cancer subjects (Table and Supplementary Fig. 1a and b).
Hierarchical cluster analysis for each of the groups depicted a high variety of expression among the individuals, which was also seen in a previously study of healthy donors (Citation15). The hierarchical cluster analysis also showed co-variance among certain markers, for example CD9, CD81 and CD151 (marked with a box) and EGFRvIII, Flotilin-1, HER4, N-cadherin and CD163 (marked with a dashed box) (a and b). The control group had a significantly higher (p<0.05) CD9, CD81 and CD151 expression when looking at log2-transformed data (a and Supplementary Fig. 1a). For the co-varying group consisting of EGFRvIII, Flotilin-1, HER4, N-cadherin and CD163, all markers were higher expressed in the control group, as well as when looking at log2-transformed data (b). As the cancerous patients showed a tendency to have a lower amount of positive antigens over all (a), a normalisation (calculation of the percentage) of the signals for each antigen to the total signal for each individual patient was performed (a). Taken together with the fact that the EV Array signal detection relies on CD9-, CD63- and/or CD81-antibody binding, the relative expression of these markers was examined further (Pie charts in a). When looking at the normalised data (b), the CD9, CD63 and CD81 percentage was significantly higher (p<0.05) in the cancer group.
Fig. 1. Hierarchical cluster analysis. Two groups of markers show co-variance both in the control group and in the cancer group (marked with boxes). a) Heat map illustration of all markers in the control group. b) Heat map illustration of all markers in the cancer group.
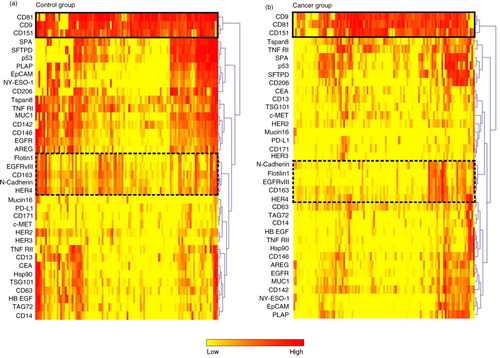
Fig. 2. EV Array signal intensities for selected antigens. a) The EV Array signal intensities for the exosomal markers CD9, CD63 and CD81 displayed in box plots. The co-variation of the signal intensities across the patient samples can be seen in Fig. 1 and Supplementary Fig. 2. b) Box plot of a group of antigens (Flotilin-1, HER4, EGFRvIII, N-Cadherin and CD163) showing a high degree of co-variation (see ). *p<0.05; ***p<0.001; ****p<0.0001; ns=not significant.
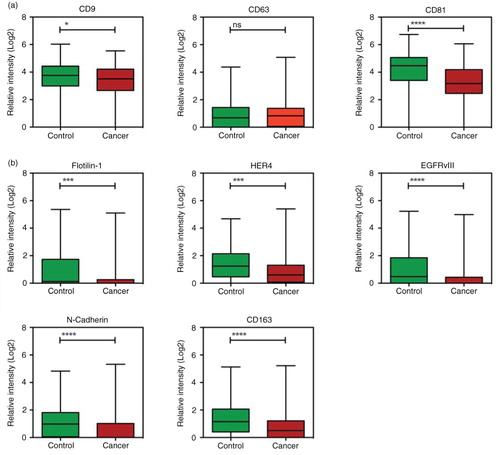
Fig. 3. Normalisation of the data to the total amount of signal. a) The signals for all analytes were summed for each individual patient and plotted; controls indicated with green and cancer with red. For each individual patient the expression of the analytes were calculated as percentage of the total signal. The pie charts illustrate an example of the normalised data for a patient in each group with a total amount of signal of ~40. Highlighted is the expression of CD9, CD63 and CD81. b) and c) Box plot of the relative expression of markers from a and b in percentage (in relation to the total sum of exosomal signal). *p <0.05; **p<0.01; ****p<0.0001; ns=not significant.
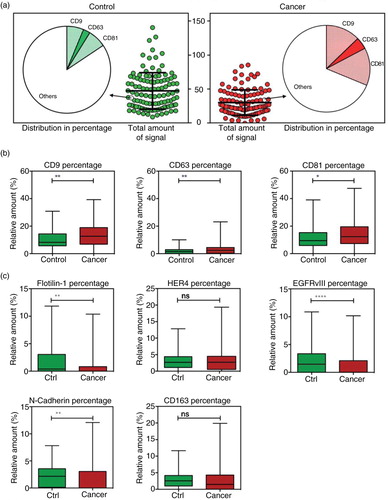
Normalised data for the co-varying group EGFRvIII, Flotilin-1, HER4, N-cadherin and CD163 was also investigated. For these markers the normalisation did not change the relations significantly (c).
Multivariate exosomal marker analysis as a diagnostic tool in NSCLC
To estimate the diagnostic value of each marker, ROC curves were generated. None of the individual markers alone gained an AUC indicating a diagnostic potential (a and b).
However, the diagnostic potential of a panel of markers was evaluated using multivariate analysis. For the multivariate analysis all log2-transformed data was included. The univariate analysis of the normalised data for CD9, CD63 and CD81 (b) showed a significant higher signal in the cancerous patients. Therefore, these normalised values were accepted in the multivariate analysis together with the individual relations between the analysed markers.
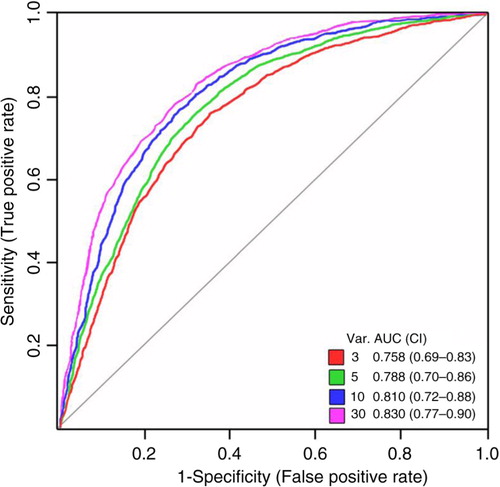
shows the ROC curves for the 3, 5, 10 and 30 best rated marker combinations. The 30-marker model has the largest AUC of 0.83, CI: 0.77–0.90, a sensitivity of 0.75 and a specificity of 0.76. This model classifies patients with 75.3% accuracy. No increase in AUC was observed when expanding the number of markers included beyond 30 (data not shown).
Fig. 4. Multivariate analysis by Random Forests using the EV Array measurements of the exosomal antigens. Random Forests ROC curves generated by the cross validation performance. The area under curve (AUC) for top 3-, 5-, 10-, and 30-marker panels are given together with the 95% confidence interval.
The importance of each marker or their individual relations for the model was assessed () and assigned a value in the range 1–10. The most important marker was found to be CD81 followed by the relation between TAG72 and the normalised values of CD63. The top 10 ranking of the importance did not change between the models including 3, 5, 10 or 30 markers. Their respective coloured lines indicate the markers included in the individual models.
Fig. 5. Multivariate analysis by Random Forests using the EV Array measurements of the exosomal antigens. The mean average importance to the classification model using the 30-marker panel illustrated in for each of the analysed exosomal antigens, the normalised values (indicated by “*”) and their internal relations (indicated by “/”). The top 10 ranking did not change between the models including 3-, 5-, 10- or 30-markers and the markers included in each model are visualised by the coloured lines. Colours refer to the number of variables showed in .

Discussion
Circulating exosomes are a promising biomarker source in various diseases. So far, only a limited number of studies have examined the diagnostic potential in relation to NSCLC. Until now, the studies have been limited to investigating exosomes captured by antibodies towards a single antigen, for example, EpCAM or CD9 (Citation9, Citation13). In spite of these constraints, promising results were obtained through these studies and a subset of exosomal miRNAs and the exosomal-bound CD91-protein was revealed as promising biomarkers. The present study examined plasma exosomes from 219 patients, initially suspected of having lung cancer, from a multi-marker aspect. Of these patients 109 where afterwards diagnosed with NSCLC. Investigation of 37 exosome capturing antibodies and the use of a cocktail of 3 different detecting antibodies against known exosome markers gave comprehensive information paving the way for multivariate analysis.
Our multivariate EV Array analysis results in a 30-marker panel classifying 75% of the patients correctly. This result is superior to exosomal CD91-expression alone (61%) as recently reported by Ueda et al. (Citation13). Our data suggests that the EV Array analysis could be a valuable complementary tool in diagnosing NSCLC.
The univariate t-test analysis revealed higher exosomal marker abundance on the control patient exosomes compared to the cancer patient exosomes. This is in concordance with the recent study of serum samples from NSCLC patients and healthy blood donors performed by Ueda et al. (Citation13). The decreased overall signal could be due to less compact exosomes in lung cancer patients, for example, fewer proteins per exosome. Presumably, this would result in fewer lung cancer exosomes being captured by the antibodies. Previously, differences in the protein load of the exosomes of melanoma patients have also been shown by Peinado et al. to have an influence on the survival rate (Citation61). Another possibility is that exosomes from NSCLC patients express another subset of markers than the ones targeted in this analysis or that the exosomes carrying the cancerous markers are cleared by an activated immune system in the cancerous patients (Citation62). Additional markers could be explored to optimise the EV Array and other detection antibodies could be evaluated for further investigation of this phenomenon.
The co-variation of exosomal markers constitutes an additional interesting finding. CD9 and CD81 remain well-described exosomal markers and may be expected to co-vary. Interestingly, CD63, another well-known marker, does not follow this pattern, which has also been described previously (Citation15, Citation63). The difference in expression of CD63 in relation to CD9 and CD81 highlights the advantage of detecting the signal with a cocktail of CD9, CD63 and CD81 antibodies in order to achieve sufficient information.
EGFRvIII together with Flotilin-1, HER4, N-cadherin and CD163 constituted an additional co-varying group (a and b). EGFRvIII is the truncated version of EGFR known from glioblastoma (Citation54). Nevertheless, EGFR truncation is not normally observed in NSCLC and neither in normal tissue (Citation64, Citation65). An obvious first thought to explain the level of EGFRvIII signal in both control and cancer patients could point to an unspecific antibody binding to normal EGFR. However, since the patterns of these 2 markers (EGFR and EGFRvIII) vary from each other this explanation does not seem to be the case. Another explanation could be an unexplored tendency for exosomes to harbour truncated EGFR. This phenomenon should be explored further in order to assess the biological bearing of this truncated receptor.
As seen from the ranking of the 30 markers, their contribution differs in importance to the model. Increasing the average importance with new and more efficient markers could greatly strengthen the analysis and the diagnostic potential. Furthermore, as no increase in diagnostic potential was seen when including more markers, it is essential to substitute weak markers with better candidate markers in order to increase the average importance and thereby provide an even more valuable tool. In conclusion, the EV Array constitutes a broad spectra tool offering exhaustive information on exosomal content with a minimal of sample requirement, which can be optimized and adjusted to fit individual sets of samples.
Conflict of interest and funding
The authors have not received any funding or benefits from industry or elsewhere to conduct this study.
Supplementary figure
Download PDF (18.8 KB)Notes
To access the supplementary material to this article, please see Supplementary files under “Article Tools”.
References
- Siegel R, Naishadham D, Jemal A. Cancer statistics, 2013. CA Cancer J Clin. 2013; 63: 11–30.
- American Cancer Society. Cancer facts and figures 2014 [Internet]. 2014. [cited 2014 Sep 22]. Available from: http://www.cancer.org/acs/groups/content/@research/documents/webcontent/acspc-042151.pdf.
- Engholm G, Ferlay J, Christensen N, Kejs AMT, Johannesen TB, Khan S et al. NORDCAN: Cancer Incidence, Mortality, Prevalence and Survival in the Nordic Countries, Version 6.0. Association of the Nordic Cancer Registries. Danish Cancer Society. 2011. [cited 2014 Sep 22]. Available from: http://www.ancr.nu.
- Provencio M, Isla D, Sánchez A, Cantos B. Inoperable stage III non-small cell lung cancer: current treatment and role of vinorelbine. J Thorac Dis. 2011; 3: 197–204. [PubMed Abstract] [PubMed CentralFull Text].
- Pan BT, Teng K, Wu C, Adam M, Johnstone RM. Electron microscopic evidence for externalization of the transferrin receptor in vesicular form in sheep reticulocytes. J Cell Biol. 1985; 101: 942–8.
- Wilson C, Nicholes K, Bustos D, Lin E, Song Q, Stephan J et al. Overcoming EMT-associated resistance to anti-cancer drugs via Src/FAK pathway inhibition. Oncotarget. 2014; 5: 7328–41. [PubMed Abstract] [PubMed CentralFull Text].
- Théry C, Boussac M, Véron P, Ricciardi-Castagnoli P, Raposo G, Garin J et al. Proteomic analysis of dendritic cell-derived exosomes: a secreted subcellular compartment distinct from apoptotic vesicles. J Immunol. 2001; 166: 7309–18.
- Caby M-P, Lankar D, Vincendeau-Scherrer C, Raposo G, Bonnerot C. Exosomal-like vesicles are present in human blood plasma. Int Immunol. 2005; 17: 879–87.
- Rabinowits G, Gerçel-Taylor C, Day JM, Taylor DD, Kloecker GH. Exosomal microRNA: a diagnostic marker for lung cancer. Clin Lung Cancer. 2009; 10: 42–6.
- Logozzi M, De Milito A, Lugini L, Borghi M, Calabrò L, Spada M et al. High levels of exosomes expressing CD63 and caveolin-1 in plasma of melanoma patients. PLoS One. 2009; 4: e5219.
- Hong C-S, Muller L, Whiteside TL, Boyiadzis M. Plasma exosomes as markers of therapeutic response in patients with acute myeloid leukemia. Front Immunol. 2014; 5: 160.
- Huang S-H, Li Y, Zhang J, Rong J, Ye S. Epidermal growth factor receptor-containing exosomes induce tumour-specific regulatory T cells. Cancer Invest. 2013; 31: 330–5.
- Ueda K, Ishikawa N, Tatsuguchi A, Saichi N, Fujii R, Nakagawa H. Antibody-coupled monolithic silica microtips for high throughput molecular profiling of circulating exosomes. Sci Rep. 2014; 4: 6232.
- Melton L. Protein arrays: proteomics in multiplex. Nature. 2004; 429: 101–7. doi: http://dx.doi.org/10.1038/429101a.
- Jørgensen M, Bæk R, Pedersen S, Søndergaard EKL, Kristensen SR, Varming K. Extracellular vesicle (EV) Array: microarray capturing of exosomes and other extracellular vesicles for multiplexed phenotyping. J Extracell Vesicles. 2013; 2: 1–9.
- Rødgaard-Hansen S, Rafique A, Christensen PA, Maniecki MB, Sandahl TD, Nexø E et al. A soluble form of the macrophage-related mannose receptor (MR/CD206) is present in human serum and elevated in critical illness. Clin Chem Lab Med. 2014; 52: 453–61.
- Kazankov K, Barrera F, Møller HJ, Bibby BM, Vilstrup H, George J et al. Soluble CD163, a macrophage activation marker,is independently associated with fibrosis in patients with chronic viral hepatitis B and C. Hepatology. 2014; 60: 521–30.
- Théry C, Zitvogel L, Amigorena S. Exosomes: composition, biogenesis and function. Nat Rev Immunol. 2002; 2: 569–79. doi: http://dx.doi.org/10.1038/nri855.
- Stoorvogel W, Kleijmeer MJ, Geuze HJ, Raposo G. The biogenesis and functions of exosomes. Traffic. 2002; 3: 321–30. doi: http://doi.wiley.com/10.1034/j.1600-0854.2002.30502.x [PubMed Abstract].
- Shimamura T, Li D, Ji H, Haringsma HJ, Liniker E, Borgman CL et al. Hsp90 inhibition suppresses mutant EGFR-T790M signaling and overcomes kinase inhibitor resistance. Cancer Res. 2008; 68: 5827–38.
- Kahlert C, Kalluri R. Exosomes in tumor microenvironment influence cancer progression and metastasis. J Mol Med. 2013; 91: 431–7.
- Wick MR, Swanson PE, Manivel JC. Placental-like alkaline phosphatase reactivity in human tumors: an immunohistochemical study of 520 cases. Hum Pathol. 1987; 18: 946–54.
- Ponnusamy MP, Venkatraman G, Singh AP, Chauhan SC, Johansson SL, Jain M et al. Expression of TAG-72 in ovarian cancer and its correlation with tumor stage and patient prognosis. Cancer Lett. 2007; 251: 247–57.
- Filella X, Molina R, Jo J, Bedini JL, Joseph J, Ballesta AM. Tumor associated glycoprotein-72 (TAG-72) levels in patients with non-malignant and malignant disease. Bull Cancer. 1992; 79: 271–7. [PubMed Abstract].
- Tiernan JP, Perry SL, Verghese ET, West NP, Yeluri S, Jayne DG et al. Carcinoembryonic antigen is the preferred biomarker for in vivo colorectal cancer targeting. Br J Cancer. 2013; 108: 662–7.
- Nazarenko I, Rana S, Baumann A, McAlear J, Hellwig A, Trendelenburg M et al. Cell surface tetraspanin Tspan8 contributes to molecular pathways of exosome-induced endothelial cell activation. Cancer Res. 2010; 70: 1668–78.
- Grah JJ, Katalinic D, Juretic A, Santek F, Samarzija M. Clinical significance of immunohistochemical expression of cancer/testis tumor-associated antigens (MAGE-A1, MAGE-A3/4, NY-ESO-1) in patients with non-small cell lung cancer. Tumori. 2014; 100: 60–8. [PubMed Abstract].
- Sun N, Chen Z, Tan F, Zhang B, Yao R, Zhou C et al. Isocitrate dehydrogenase 1 is a novel plasma biomarker for the diagnosis of non-small cell lung cancer. Clin Cancer Res. 2013; 19: 5136–45.
- Kimura Y, Fujii T, Hamamoto K, Miyagawa N, Kataoka M, Iio A. Serum CA125 level is a good prognostic indicator in lung cancer. Br J Cancer. 1990; 62: 676–8.
- Woenckhaus M, Merk J, Stoehr R, Schaeper F, Gaumann A, Wiebe K et al. Prognostic value of FHIT, CTNNB1, and MUC1 expression in non-small cell lung cancer. Hum Pathol. 2008; 39: 126–36.
- Nagai S, Takenaka K, Sonobe M, Ogawa E, Wada H, Tanaka F. A novel classification of MUC1 expression is correlated with tumor differentiation and postoperative prognosis in non-small cell lung cancer. J Thorac Oncol. 2006; 1: 46–51.
- Fiala O, Pesek M, Finek J, Benesova L, Minarik M, Bortlicek Z et al. Predictive role of CEA and CYFRA 21-1 in patients with advanced-stage NSCLC treated with erlotinib. Anticancer Res. 2014; 34: 3205–10. [PubMed Abstract].
- Liu H, Gu X, Lv T, Wu Y, Xiao Y, Yuan D et al. The role of serum carcinoembryonic antigen in predicting responses to chemotherapy and survival in patients with non-small cell lung cancer. J Cancer Res Ther. 2014; 10: 239–43.
- Zhang P-F, Zeng G-Q, Hu R, Li C, Yi H, Li M-Y et al. Identification of flotillin-1 as a novel biomarker for lymph node metastasis and prognosis of lung adenocarcinoma by quantitative plasma membrane proteome analysis. J Proteomics. 2012; 77: 202–14.
- Huszar M, Moldenhauer G, Gschwend V, Ben-Arie A, Altevogt P, Fogel M. Expression profile analysis in multiple human tumors identifies L1 (CD171) as a molecular marker for differential diagnosis and targeted therapy. Hum Pathol. 2006; 37: 1000–8.
- Tokuhara T, Hasegawa H, Hattori N, Ishida H, Taki T, Tachibana S et al. Clinical significance of CD151 gene expression in non-small cell lung cancer. Clin Cancer Res. 2001; 7: 4109–14. [PubMed Abstract].
- Kwon MJ, Seo J, Kim YJ, Kwon MJ, Choi JY, Kim T-E et al. Prognostic significance of CD151 overexpression in non-small cell lung cancer. Lung Cancer. 2013; 81: 109–16.
- Goldin-Lang P, Tran Q-V, Fichtner I, Eisenreich A, Antoniak S, Schulze K et al. Tissue factor expression pattern in human non-small cell lung cancer tissues indicate increased blood thrombogenicity and tumour metastasis. Oncol Rep. 2008; 20: 123–8. [PubMed Abstract].
- Oka S, Uramoto H, Chikaishi Y, Tanaka F. The expression of CD146 predicts a poor overall survival in patients with adenocarcinoma of the lung. Anticancer Res. 2012; 32: 861–4. [PubMed Abstract].
- Kristiansen G, Yu Y, Schlüns K, Sers C, Dietel M, Petersen I. Expression of the cell adhesion molecule CD146/MCAM in non-small cell lung cancer. Anal Cell Pathol. 2003; 25: 77–81.
- Weber B, Hager H, Sorensen BS, McCulloch T, Mellemgaard A, Khalil AA et al. EGFR mutation frequency and effectiveness of erlotinib: a prospective observational study in Danish patients with non-small cell lung cancer. Lung Cancer. 2014; 83: 224–30.
- Ise N, Omi K, Nambara D, Higashiyama S, Goishi K. Overexpressed HER2 in NSCLC is a possible therapeutic target of EGFR inhibitors. Anticancer Res. 2011; 31: 4155–61. [PubMed Abstract].
- Hirsch FR, Varella-Garcia M, Cappuzzo F. Predictive value of EGFR and HER2 overexpression in advanced non-small-cell lung cancer. Oncogene. 2009; 28: S32–7.
- Nielsen TO, Poulsen SS, Journe F, Ghanem G, Sorensen BS. HER4 and its cytoplasmic isoforms are associated with progression-free survival of malignant melanoma. Melanoma Res. 2014; 24: 88–91.
- Higginbotham JN, Demory Beckler M, Gephart JD, Franklin JL, Bogatcheva G, Kremers G-J et al. Amphiregulin exosomes increase cancer cell invasion. Curr Biol. 2011; 21: 779–86.
- Velcheti V, Schalper KA, Carvajal DE, Anagnostou VK, Syrigos KN, Sznol M et al. Programmed death ligand-1 expression in non-small cell lung cancer. Lab Invest. 2014; 94: 107–16. doi: http://dx.doi.org/10.1038/labinvest.2013.130 [PubMed Abstract].
- Harvey RD. Immunologic and clinical effects of targeting PD-1 in lung cancer. Clin Pharmacol Ther. 2014; 96: 214–23. doi: http://dx.doi.org/10.1038/clpt.2014.74 [PubMed Abstract].
- Benedettini E, Sholl LM, Peyton M, Reilly J, Ware C, Davis L et al. Met activation in non-small cell lung cancer is associated with de novo resistance to EGFR inhibitors and the development of brain metastasis. Am J Pathol. 2010; 177: 415–23.
- Nakamura Y, Niki T, Goto A, Morikawa T, Miyazawa K, Nakajima J et al. c-Met activation in lung adenocarcinoma tissues: an immunohistochemical analysis. Cancer Sci. 2007; 98: 1006–13.
- Ongusaha PP, Kwak JC, Zwible AJ, Macip S, Higashiyama S, Taniguchi N et al. HB-EGF is a potent inducer of tumor growth and angiogenesis. Cancer Res. 2004; 64: 5283–90.
- Hui L, Zhang S, Dong X, Tian D, Cui Z, Qiu X. Prognostic significance of twist and N-cadherin expression in NSCLC. PLoS One. 2013; 8: e62171.
- Lee JS, Yoon A, Kalapurakal SK, Ro JY, Lee JJ, Tu N et al. Expression of p53 oncoprotein in non-small-cell lung cancer: a favorable prognostic factor. J Clin Oncol. 1995; 13: 1893–903. [PubMed Abstract].
- Murakami H, Yokoyama A, Kondo K, Nakanishi S, Kohno N, Miyake M. Circulating aminopeptidase N/CD13 is an independent prognostic factor in patients with non-small cell lung cancer. Clin Cancer Res. 2005; 11: 8674–9.
- Del Vecchio CA, Giacomini CP, Vogel H, Jensen KC, Florio T, Merlo A et al. EGFRvIII gene rearrangement is an early event in glioblastoma tumorigenesis and expression defines a hierarchy modulated by epigenetic mechanisms. Oncogene. 2012; 32: 1–12.
- Maniecki MB, Etzerodt A, Ulhøi BP, Steiniche T, Borre M, Dyrskjøt L et al. Tumor-promoting macrophages induce the expression of the macrophage-specific receptor CD163 in malignant cells. Int J Cancer. 2012; 131: 2320–31.
- Huang A, Zhang B, Wang B, Zhang F, Fan K-X, Guo Y-J. Increased CD14(+)HLA-DR (−/low) myeloid-derived suppressor cells correlate with extrathoracic metastasis and poor response to chemotherapy in non-small cell lung cancer patients. Cancer Immunol Immunother. 2013; 62: 1439–51.
- Sano H, Kuroki Y. The lung collectins, SP-A and SP-D, modulate pulmonary innate immunity. Mol Immunol. 2005; 42: 279–87.
- Zhang J, Hawari FI, Shamburek RD, Adamik B, Kaler M, Islam A et al. Circulating TNFR1 exosome-like vesicles partition with the LDL fraction of human plasma. Biochem Biophys Res Commun. 2008; 366: 579–84.
- Niewczas MA, Gohda T, Skupien J, Smiles AM, Walker WH, Rosetti F et al. Circulating TNF receptors 1 and 2 predict ESRD in type 2 diabetes. J Am Soc Nephrol. 2012; 23: 507–15.
- Rauchhaus M, Doehner W, Francis DP, Davos C, Kemp M, Liebenthal C et al. Plasma cytokine parameters and mortality in patients with chronic heart failure. Circulation. 2000; 102: 3060–7.
- Peinado H, Alečković M, Lavotshkin S, Matei I, Costa-Silva B, Moreno-Bueno G et al. Melanoma exosomes educate bone marrow progenitor cells toward a pro-metastatic phenotype through MET. Nat Med. 2012; 18: 883–91.
- Bobrie A, Théry C. Exosomes and communication between tumours and the immune system: are all exosomes equal?. Biochem Soc Trans. 2013; 41: 263–7.
- He M, Crow J, Roth M, Zeng Y, Godwin AK. Integrated immunoisolation and protein analysis of circulating exosomes using microfluidic technology. Lab Chip. 2014; 14: 3773–80.
- Sasaki H, Kawano O, Endo K, Yukiue H, Yano M, Fujii Y. EGFRvIII mutation in lung cancer correlates with increased EGFR copy number. Oncol Rep. 2007; 17: 319–23. [PubMed Abstract].
- Okamoto I, Kenyon LC, Emlet DR, Mori T, Sasaki J, Hirosako S et al. Expression of constitutively activated EGFRvIII in non-small cell lung cancer. Cancer Sci. 2003; 94: 50–6.