
Abstract
Extracellular vesicles (EVs) play a significant role in cell–cell communication in numerous physiological processes and pathological conditions, and offer promise as novel biomarkers and therapeutic agents for genetic diseases. Many recent studies have described different molecular mechanisms that contribute to EV biogenesis and release from cells. However, little is known about how external stimuli such as cell culture conditions can affect the quantity and content of EVs. While N2a neuroblastoma cells cultured in serum-free (OptiMEM) conditions did not result in EVs with significant biophysical or size differences compared with cells cultured in serum-containing (pre-spun) conditions, the quantity of isolated EVs was greatly increased. Moreover, the expression levels of certain vesicular proteins (e.g. small GTPases, G-protein complexes, mRNA processing proteins and splicing factors), some of which were previously reported to be involved in EV biogenesis, were found to be differentially expressed in EVs under different culture conditions. These data, therefore, contribute to the understanding of how extracellular factors and intracellular molecular pathways affect the composition and release of EVs.
To access the supplementary material to this article, please see Supplementary files under ‘Article Tools’.
Extracellular vesicles (EVs) are secreted by most cells such as epithelial cells, B- and T-lymphocytes, mast cells, dendritic cells and neurons (Citation1–Citation5), into bodily fluids like urine, blood and cerebrospinal fluid. They have been reported to participate actively in the communication between cells through the transfer of functional proteins (Citation6), mRNAs and small RNAs (Citation7), and by inducing signalling cascades through interactions with cell surface receptors and bioactive lipids (Citation8). Subsequently, this transfer of information can impact on various physiological processes including immune responses and neuron signalling, or even participate in the spread of pathological conditions such as cancer, neurological diseases and infections (Citation9–Citation14). Given that these vesicles are natural carriers of biological molecules within the body, some researchers have capitalized on the use of EVs for targeted genetic therapy (Citation15, Citation16), which has led to a burgeoning interest on the biology and applicability of these vesicles in therapy today.
In the EV field, the term “exosome” is commonly used to define a specific subgroup of EVs, which are of 30–100 nm in size and of endosomal origin (Citation17). Recently, it has become evident that there is a need to revise the exact nomenclature of vesicles due to the technical difficulties in isolating exosomes separately from other types of EVs (e.g. microvesicles) and elucidating their true biological functions (Citation18, Citation19). We, therefore, chose to use the collective term “EVs” to describe our vesicles in this study.
In relation to exploring the applicability of EVs for therapies and diagnostics, results from several groups have begun to unravel the various biogenesis mechanisms of these vesicles, in particular, exosomes (Citation20–Citation22). During the late endosomal stage, the endosomal membrane buds inward to form numerous intraluminal vesicles (ILVs), transforming an endosome into a multivesicular body (MVB). These ILVs, which are now commonly referred to as exosome precursors, are released into the extracellular environment as exosomes upon MVB fusion with the cell membrane. Studies have shown that the formation of ILVs can be regulated both by endosomal sorting complex required for transport (ESCRT) components and its associated proteins (Citation23, Citation24) as well as by ESCRT-independent machinery, triggered by ceramide or G-protein coupled sphingosine 1-phosphate receptors (Citation25–Citation27). MVB fusion with the cell membrane (and subsequent exosome release) can be controlled by various Ras GTPases (Citation28–Citation32) or even lipids and lipid-related proteins (Citation20, Citation33) (Citation34). Interestingly, recent reports suggest that these various EV biogenesis mechanisms may be cell-type specific and could affect the composition, in addition, to the quantity of exosomes released (Citation20, Citation35).
Environmental factors such as the constituents of culture media for EV collection may affect EV production and contents too; however, how these factors impact on EV biogenesis pathways directly or indirectly is much less explored. In most in vitro studies, EVs are isolated from conditioned media that has been previously depleted of serum EVs. This is crucial because these EVs would co-pellet with cell-secreted EVs during the purification process and interfere with subsequent applications (Citation36). Typically, this EV-depleted medium is referred to as “pre-spun” medium. However, there have been some disagreements lately on whether all serum EVs are effectively removed during this initial ultracentrifugation process. Hence, in some instances, such as in cultures of mesenchymal stem cells or neurons, serum-free media [with or without the addition of supplements, such as B-27 and N-2 (Citation37–Citation39)], is used for EV harvesting. The use of these alternative media types, however, could affect cell growth, quantity of EV released and their content.
In this study, we investigated the quantity and protein composition of EVs secreted from N2a neuroblastoma cells cultured in pre-spun (Dulbecco's modified Eagle medium, DMEM, supplemented with 10% EV-depleted serum) and in serum-free OptiMEM (a media commonly used when transfecting cells that contains supplements that maintain cell viability with reduced serum amounts). We first analysed how EV secretion was affected by both the incubation time and starting cell density. EVs were isolated from conditioned media using the classical differential ultracentrifugation method, analysed for expression of EV markers by western blotting, and quantified by nanoparticle tracking analysis (NTA). We then proceeded with quantitative proteomic analysis on the EVs obtained from both types of conditioned media to determine the overall proteomic changes in EV contents. Our findings show that serum-free conditions lead to an increase in EV release, and the protein composition of these vesicles differ to those derived from cells grown in serum-containing media.
Materials and methods
Cell culture
Neuro2a (N2a, a mouse neuroblastoma cell line) and NSC-34 (a fusion of motor neuron enriched embryonic mouse spinal cord cells with mouse neuroblastoma) were cultured in T-175 flasks at 37°C with 5% CO2 in complete media comprising DMEM (Life Technologies, Carlsbad, CA, USA), supplemented with 10% foetal bovine serum (FBS, Life Technologies) and penicillin/streptomycin (P/S, 5,000 µg/mL; Life Technologies). Cells were counted and seeded in 3 different ratios, low, medium and high, with 5 flasks per ratio. These ratios corresponded to a starting seeding cell number of 1.35×10⁶, 3×10⁶ and 7×10⁶, respectively. Cells were washed, and media were then changed to either pre-spun media or OptiMEM the next day after seeding. Pre-spun media contain DMEM with 10% FBS, which has been depleted from EVs by ultracentrifugation at 120,000g, 4°C for 70 min prior to making up the media. Both pre-spun and OptiMEM were further supplemented with P/S. Conditioned media (pre-spun and OptiMEM) was collected for EV isolation from 5 individual flasks representing 5 different incubation time points (24, 48, 72, 96 and 120 h) after changing the media. A parallel experiment was also conducted on SH-SY5Y cells, a human neuroblastoma cell line. To evaluate the feasibility of alternative media types for collection of EVs, we further cultured N2a cells in serum-free DMEM (SF DMEM). Unless otherwise indicated, the conditioned media were always collected 48 h after the change in media on cells. After each collection of media, cells in each flask were trypsinized, stained with trypan blue and counted using a hemocytometer.
Preparation of cell lysates
To compare the protein expression in cell lysates versus EV, cells were lysed in radioimmunoprecipitation assay buffer (50 mM Tris–HCl, pH 7.4; 150 mM NaCl; 1% Triton X-100; 1% sodium deoxycholate; 0.1% sodium dodecyl sulphate (SDS); 1 mM Ethylenediaminetetraacetic acid (EDTA) and a cocktail of protease inhibitors (Roche, Basel, Switzerland) for 30 min on ice and spun for 30 min at 13,000g at 4°C. The supernatants were collected and total protein amounts were quantified using the Bradford assay (Bio-Rad®, Hercules, CA, USA).
Isolation of EVs
Conditioned media collected from the flasks were centrifuged at 200g for 5 min to remove dead cells and cell debris. The supernatant was further centrifuged at 1,000g for 10 min. The pellet was discarded and the supernatant were filtered through 0.22 µm filter before it was ultracentrifuged at 120,000g for 70 min in a fixed angle 70Ti rotor (Beckman Coulter, Pasadena, CA, USA) to pellet EVs. Prior to proteomic analysis, EV pellets were washed with a second ultracentrifugation at 120,000g for 70 min in a fixed angle 70Ti rotor. All centrifugation steps were performed at 4°C. The pellets were then re-suspended in a final volume of 100 µL of phosphate-buffered saline (PBS; Life Technologies) and stored at −80°C before subsequent molecular analyses.
Nanoparticle tracking analysis
For particle size determination, NTA was performed with a NanoSight NS500 instrument equipped with the NTA 2.3 analytical software. Samples were thawed on ice and diluted in PBS between 1:500 and 1:20,000 to achieve a particle count of between 2×10⁸ and 2.0×10⁹ per mL. Once the dilution of the sample was determined, the sample was loaded in the sample chamber and the camera was focused. For all recordings, camera level of 13 was used. Five 30 s videos were recorded for each sample using a script incorporating a sample advance and 5 s delay steps between each recording. These measurements were analysed using the batch process facility using the following post-acquisition settings: “automatic” for blur and minimum expected particle size, and a fixed detection threshold at “5”. An average of the 5 recordings was made and exported to Microsoft Excel for further analysis. If the profiles were not in agreement, measurements were repeated.
Western blotting
Western blotting was performed using a Bio-Rad® Mini-PROTEAN® Tetra cell as per the manufacturer's instructions. To cross-compare the yield of EVs, we proceeded to load equal volumes of the re-suspended EV pellets in the gel. For comparisons between cells and EVs, 40 µg of cell lysate or EVs was loaded in the gel. Cell or EV samples were mixed at a 1:1 ratio with 2× Laemmli sample buffer (Bio-Rad®) containing 5% β-mercaptoethanol and heated at 100°C for 10 min. Samples were then loaded in a 1.5 mm, 10% home-made Tris/glycine SDS–polyacrylamide gel and ran at 140 V for 60–70 min. Proteins on the gel were transferred to a polyvinylidene fluoride (PVDF) membrane (Millipore, Billerica, MA, USA) at 100 V for 60–70 min in transfer buffer containing 20% methanol. Membranes were then incubated in blocking buffer (5% fat-free milk in Tris buffer saline with 0.1% Tween-20 (TBS-T)) for 60 min at room temperature (RT) on a rocker with gentle shaking. After blocking, the membrane was incubated with freshly prepared primary antibody solution, anti-CD9, anti-PDC6I/Alix, anti-Tsg101, anti-Calnexin, anti-PEDF (SERPINF1) and anti-ADP ribosylation factor 6 (ARF6; Abcam, Cambridge, UK) and anti-MYG1 (Santa Cruz Biotechnology, Santa Crus, CA); at 1:1,000 or 1:400 dilution depending on the antibodies’ efficiency overnight at 4°C or 2 h at RT. Membranes were washed 3 times for 10 min each using TBS-T with vigorous shaking before adding the secondary antibody solution [anti-mouse IgG DyLight-800 at 1:10,000 dilution for detecting PDC6I/Alix and MYG1; anti-rabbit IgG DyLight-800 at 1:10,000 dilution for detecting CD9, Tsg101, Calnexin, ARF6 and PEDF(SERPINF1)] and incubating for 1 h at RT. After secondary incubation, membranes were washed 3 times for 10 min and visualized by scanning both 700 and 800 nm channels on the LI-COR ODYSSEY® CLx Infrared Imaging System. For probing of other proteins on the same membrane, the membrane was washed 3 times 10 min before re-incubation of the next primary antibody.
Apoptosis and viability assay
Cell apoptosis assays were performed using ApoTox-Glo™ Triplex Assay kit (Promega Corporation, Madison, USA) following manufacturer's instructions. N2a cells were seeded at 5,500 cells per well in a 96-well clear-bottom black plate, in complete growth media. This cell density corresponded with the medium seeding density as described earlier. Media on the cells were changed after 24 h to SF DMEM, DMEM supplemented with 10% EV-depleted FBS or OptiMEM. Assays were performed 24 or 48 h after the change of media as indicated. A positive control, representing 100% apoptosis level, was determined on the cells in complete media (DMEM+10%FBS) treated with 10 μM staurosporin for 4 h prior to the assay.
Sucrose gradient analysis
To analyse the density of isolated EVs, we floated the pellet collected from N2a samples grown at medium cell density for 3 days onto a discontinuous sucrose gradient. Briefly, the re-suspended pellet was loaded on a linear gradient of sucrose (0.25–2.5 M) and centrifuged at 200,000g for 16 h at 4°C in a SW40 swing rotor (Beckman Coulter). One millilitre fractions were then collected from the top, and each fraction was weighed to obtain an estimated density of that particular fraction. Each fraction was further diluted in 25 mL of PBS and centrifuged at 120,000g for 70 min at 4°C to pellet the particles in each fraction. The pellet at each fraction was then re-suspended in 20 µL PBS and used for western blotting analysis.
Nano LC–MS/MS proteomic analysis
Purified EVs were concentrated by speedvac and lysed with 1% SDS, 25 mM HEPES and 1 mM dithioerythritol (DTT). Lysates were heated to 95°C for 5 min followed by sonication for 1 min and centrifugation at 14,000g for 15 min. The supernatant was mixed with 1 mM DTT, 8 M urea, 25 mM HEPES, pH 7.6 and transferred to a 10 kDa cut-off centrifugation filtering unit (Pall, Nanosep®, Pall corporation, Port Washington, NY, USA), and centrifuged at 14,000g for 15 min. Proteins were alkylated by 50 mM iodoacetamide in 8 M urea, 25 mM HEPES for 10 min. The protein lysates were then centrifuged at 14,000g for 15 min in 10 kDa cut-off spin filters followed by removal of flow through. A buffer with 8 M urea and 25 mM HEPES was added to the retentate and the spin filter centrifuged at 14,000g for 15 min. After the flow through was discarded, this process was repeated once more. Trypsin (Promega Corporation) in 250 mM urea and 50 mM HEPES was added to the cell lysate at a ratio of 1:50 trypsin/protein and incubated overnight at 37°C. The filter units were centrifuged at 14,000g for 15 min followed by another centrifugation with Milli-Q water, and the flow through was collected. Peptides were cleaned by a strata-X-C-cartridge (Phenomenex, Torrance, CA, USA).
Before analysis on the Q Exactive (Thermo Fischer Scientific, San Jose, CA, USA), peptides were separated using an Agilent 1200 nano LC system. Samples were trapped on a Zorbax 300SB-C18 and separated on a NTCC-360/100-5-153 (Nikkyo Technos., Ltd, Tokyo, Japan) column using a gradient of A (3% acetonitrile (ACN) and 0.1% formic acid (FA)) and B (95% ACN an 0.1% FA), ranging from 5 to 37% B in 240 min with a flow of 0.4 µL/min. The Q Exactive was operated in a data-dependent manner, selecting top 5 precursors for fragmentation by HCD. The survey scan was performed at 70,000 resolution from 300 to 1,700 m/z, using lock mass at m/z 445.120025, with a max injection time of 100 ms and target of 1×10⁶ ions. For generation of HCD fragmentation spectra, a max ion injection time of 500 ms and AGC of 1×10⁵ were used before fragmentation at 30% normalized collision energy, 17,500 resolution. Precursors were isolated with a width of 2 m/z and put on the exclusion list for 70 s. Single and unassigned charge states were rejected from precursor selection.
Proteome discoverer 1.3 with sequest-percolator was used for protein identification. Precursor mass tolerance was set to 10 ppm and for fragments to 0.02 Da. Oxidized methionine was set as dynamic modification, and carbamidomethylation as static modification. Spectra were matched to a combined mus musculus and bos taurus ensembl 72 database, and results were filtered to 1% False discovery rate (FDR). Identifications in bos taurus was considered to originate from FBS and removed. Protein areas were normalized to the median between each replicate to account for uneven peptide loading. Proteins were considered identified if they had quantifiable protein area in 2 or more of the 3 biological replicates. Differential protein levels between OptiMEM and pre-spun were defined by fulfilling 2 criteria; a) multiple t-test ratios, 5% FDR, using Graphpad Prism and b) ratio outside of the 99% confidence interval of OptiMEM (set as denominator). Gene ontology (GO) term enrichment analysis was performed using Panther (Citation40).
Statistical analysis
In d, protein levels of a selected group of proteins from EVs derived from OptiMEM and pre-spun conditions were plotted based on the proteomics data (Supplementary Table I). To assess differences between the 2 groups, Student's t-test (paired or unpaired, 2-tailed) was used, as applicable. Differences were considered to be significant for values of p<0.05.
Results
Increased EV yield from cells cultured in OptiMEM compared with pre-spun media
Since N2a cells are normally grown in media supplemented with serum, we first evaluated how these cells reacted to the change in culture media to pre-spun and OptiMEM. Generally, cells proliferated at a slower rate in OptiMEM than in pre-spun medium over the course of the 5-day period analysed. The number of adherent cells started to decrease in OptiMEM at day 4 and in pre-spun medium at day 5, indicating reduced cell viability in OptiMEM as compared with pre-spun (a). Interestingly, N2a cells cultured in OptiMEM presented with longer outgrowths, demonstrating that the change to OptiMEM media affected cell morphology (Supplementary Fig. 1a).
Fig. 1. (Continued).
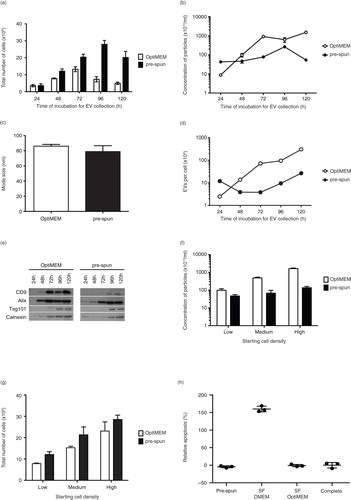
Fig. 1. Comparison of N2a cells and EVs cultured and collected under either OptiMEM or pre-spun conditions over a 5-day period. Total number of adherent N2a cells (a) and concentration of particles (b) derived from N2a conditioned media cultured under OptiMEM and pre-spun conditions across a 5-day period. (c) Average mode size of the particles isolated from OptiMEM and pre-spun conditions. (d) Ratio of the total number of EVs per cell isolated from OptiMEM or pre-spun conditioned media. (e) Representative western blotting pictures showing the appearance of EV markers (CD9, Alix and Tsg101) and ER marker (Calnexin) in the EVs isolated across the 5-day period. Equal volumes of the re-suspended EV pellets, representing 20% of total EV yield, were loaded in the gel. (f) Concentration of particles derived from N2a cells conditioned media seeded at different starting densities, over a fixed 48 h period of culture from either OptiMEM or pre-spun conditions. (g) The total number of adherent N2a cells in the flasks after the 48 h period of culture for both OptiMEM and pre-spun conditions. (h) Relative apoptosis (%) levels in N2a cells after 48 h in the different media types. Complete represents normal growth conditions (DMEM + 10% FBS). 100% apoptosis level is determined with 10 μM of staurosporin treatment for 4 h. (i) The total number of adherent N2a cells in the flasks after the 48 h period of culture in the 3 different media types. (j) Concentration of particles derived from N2a cells conditioned media after 48 h. (k) Representative western blotting pictures showing the appearance of EV markers (Alix and Tsg101) and ER marker (Calnexin) in the particles isolated after 48 h.
Next, we isolated and characterized EVs from these cells cultured under the 2 conditions over the 5-day period with NTA and western blotting for EV markers. Prior to EV collection, the pre-conditioned media (pre-spun and OptiMEM) were checked and found to contain negligible numbers of particles (data not shown). From the cell cultures, the total number of particles isolated increased across the first 3 days in both conditions. Subsequently, the particle numbers began to decrease at day 4 for OptiMEM and at day 5 for pre-spun media (b). Consistently, substantially more particles were released in OptiMEM than in pre-spun medium at day 2 (b), although there was no significant difference in the mode size and overall size distributions profiles of the particles (c and Supplementary Fig. 1b). Interestingly, the ratio of the total number of secreted EVs per cell followed different kinetic profiles in OptiMEM as compared with pre-spun medium (d). In a parallel experiment, we tested if this same phenomenon was detected in another mouse neuroblastoma cell line, NSC-34. Again, we saw a similar trend of cell proliferation numbers and higher concentrations of particles in OptiMEM as compared to pre-spun medium (Supplementary Fig. 2a–b), where the mode size and size distribution profiles of particles were similar in both conditions (Supplementary Fig. 2c–d). With western blotting, EV markers (PDC6I/Alix, CD9 and Tsg101) were consistently detected a day earlier in OptiMEM compared to pre-spun samples (e). On the other hand, Calnexin was detected increasingly from day 3 onwards. Again, Calnexin was detected a day earlier from EVs collected from OptiMEM than from pre-spun media. When we only considered a fixed incubation period of 48 h, we observed that the number of particles released was consistently higher in OptiMEM than in pre-spun medium, regardless of the starting cell density (f). Interestingly, this was despite finding a lower number of adherent cells in OptiMEM than in pre-spun cultures (g). Moreover, a similar phenomenon was observed in human neuroblastoma cells, SH-SY5Y (Supplementary Fig. 2e–g).
To investigate if our observations were simply due to the presence or absence of serum, we tested N2a cells in SF DMEM alone. Our data showed that N2a cells were not healthy after 48 h in SF DMEM as shown by the high apoptosis levels and low cell counts (h and i). NTA quantification of the total number of particles was greater in SF DMEM samples than in OptiMEM or pre-spun (j). Although all 3 samples stained positively for EV markers (Alix and Tsg101), the level of Calnexin was the greatest in the SF DMEM sample (k).
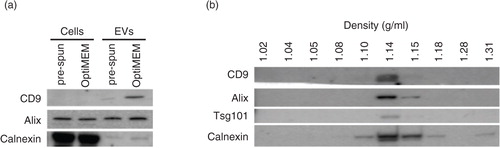
When the incubation period was extended to 72 h for EV collection, it was observed that in both media there was an increase in both the levels of EV markers (CD9 and Alix) and Calnexin. Calnexin is an endoplasmic reticulum (ER) protein that has been used as a marker of contaminating vesicles in EV preparations (Citation41, Citation42). To verify this marker as a contaminant in our samples, we proceeded to load equal amounts of proteins from cells and EVs on a western blot. Interestingly, we found that reported EV markers (CD9 and Alix) were both enriched in EVs over cells, while the opposite trend was noticed for Calnexin (a). Hence, this finding confirmed Calnexin as a suitable contamination marker in our EV samples. In the field of EVs, it has been discussed that additional procedures, such as density gradient flotation, after the initial ultracentrifugation step are able to get rid of these contaminants. Hence, we tested if EVs derived from OptiMEM conditioned media over 72 h, could be separated from contaminants by floating the sample on a discontinuous sucrose gradient. Post-floating our EVs on a sucrose gradient showed the detection of EV markers (CD9, Alix and Tsg101) at densities of 1.10–1.18 g/mL, which is in agreement with previously reported densities of EVs (Citation43). Interestingly, the expression of Calnexin was also detected at the same densities as these EV markers (b).
Fig. 2. Characterization of N2a cells and EVs cultured and collected under either OptiMEM or pre-spun conditions at a fixed 72 h period. (a) Representative western blotting pictures showing the enrichment of EV markers (CD9 and Alix) in the EVs as compared to the parental cell lysates, while the opposite trend is noticed for the ER marker, Calnexin. Forty micrograms of cell lysate or EVs was loaded in the gel. (b) Representative western blotting pictures showing the appearance of EV markers and Calnexin at 1.10–1.18 g/mL after floating EVs on a continuous sucrose gradient for 16 h.
Culture conditions affect EV protein composition
In addition to the quantity of released particles and the expression of EV markers, we sought to analyse whether the general proteome of EVs differed between pre-spun and OptiMEM culture conditions. In order to ensure collection of EVs from a healthy cell culture, we chose to collect EVs from both pre-spun and OptiMEM conditions after a 48 h incubation period and subjected them to nano liquid chromatography–tandem mass spectrometry (LC–MS/MS) proteomic analysis. OptiMEM and pre-spun EVs were analysed in biological triplicates, which showed good overlap in protein identifications between MS runs and quantitative reproducibility (Supplementary Fig. 3a and b).
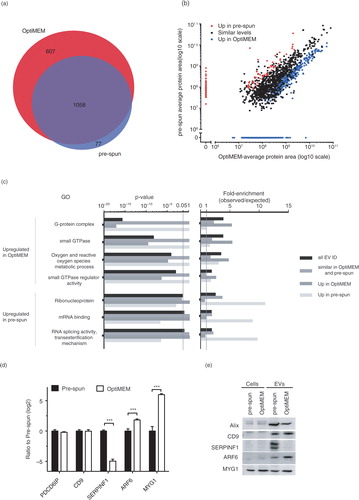
A total of 1,742 proteins were identified (1% FDR) in EVs from OptiMEM and pre-spun media (Supplementary Table I). Of the identified proteins, 1,058 proteins were identified in EVs from both OptiMEM and pre-spun media, with 607 and 77 proteins exclusively found in OptiMEM and pre-spun conditions, respectively (a). Of the 1,058 proteins identified in both OptiMEM and pre-spun EVs, 655 were expressed at similar levels, and 45 and 358 proteins were considered up-regulated in pre-spun and OptiMEM, respectively (b and Supplementary Fig. 3c). For GO enrichment analysis, we grouped proteins identified in both conditions that display differential protein levels in either condition, with proteins detected only in the same condition (b). This generated 3 groups of proteins; a) 655 proteins with similar levels in both conditions, b) 122 proteins considered up-regulated in pre-spun compared to OptiMEM and c) 965 proteins considered up-regulated in OptiMEM compared to pre-spun (b). We used Panther (Citation40) to identify GO enrichments in the 3 protein groups (c and Supplementary Fig. 3d).
Fig. 3. (Continued). Fig. 3. Nano LC–MS/MS proteomic analysis of N2a EVs isolated from either OptiMEM or pre-spun conditions collected after 48 h period. (a) Venn diagram showing a 60% overlap of total proteins identified in EVs from both OptiMEM and pre-spun conditions. (b) Scatter plot showing the correlation between the expression levels of proteins identified in EVs isolated from either OptiMEM or pre-spun conditions. Proteins are further classified into 3 groups: similar levels in both conditions (black dots), higher expression in pre-spun (red dots) and higher expression in OptiMEM (blue dots). (c) A subset of significantly enriched GOs from proteins considered to be up-regulated in either OptiMEM or pre-spun-derived EVs. All proteins are grouped under the 4 categories: all EV IDs (black bar), proteins of similar levels in both OptiMEM and pre-spun (grey bar), higher in OptiMEM (dark grey bar) and higher in pre-spun (light grey bar). (d) Proteomics data showing the ratio of OptiMEM/pre-spun (log 2) on the selected proteomic validation targets (Alix/PDCD6IP, CD9, SERPINF1, ARF6 and MYG1) (***p < 0.001, 1% FDR). (e) Representative western blots on these selected validation targets in both cells and EVs cultured and collected under either OptiMEM or pre-spun conditions.
Overall, proteins identified to be of similar levels between both conditions included EV markers such as Alix and CD9 as indexed in Exocarta (Citation44). Other similarly expressed proteins include cytoskeleton and cytoskeleton-related proteins such as tubulin, actin and actin-related proteins, as well as heat shock protein-90 (Supplementary Table II).
Based on GO annotations, the level of ribosomal proteins and other proteins involved in translation (e.g. translation initiation and elongation factors) were found to be similar in both conditions. As for EVs isolated under OptiMEM conditions, they showed significant enrichment of certain protein classes such as G-proteins, small GTPases and kinases. Furthermore, there was some enrichment of proteins involved in oxygen and reactive species metabolic processes in OptiMEM EVs over that of pre-spun EVs. Pre-spun EVs, on the other hand, seemed to be more enriched for ribonucleoproteins and microtubule family cytoskeletal proteins. Interestingly, we noticed an enrichment of mRNA processing and splicing factors in pre-spun EVs as compared to that in OptiMEM EVs.
In order to validate our proteomic findings, we analysed a number of highly expressed proteins in either condition as well as common EV markers as indicated by the mass spectrometry based proteomics (d) and analysed the expression by western blotting (e). There was no significant difference in expression levels of EV markers (Alix and CD9) for both EVs and cells cultured in OptiMEM or pre-spun. Although proteins selected for validation were below the detectable level in the cells, we detected slightly higher expression levels of melanocyte proliferating gene 1 (MYG1) and ARF6 (p<0.05) in the EVs from OptiMEM as opposed to pre-spun and the reverse trend for serpin F1 (SERPINF1) (p<0.05).
Discussion
In this study, we investigated the release and protein composition of EVs derived from cells cultured in 2 types of media conditions: pre-spun medium (DMEM supplemented with vesicle-depleted serum, mimicking standard culture conditions) and SF OptiMEM.
Our data here demonstrate that N2a cells release more EVs in OptiMEM compared with that in pre-spun media. Moreover, the protein compositions of EVs isolated from these 2 conditions were found to be slightly different.
The differential ultracentrifugation methodology has been reported to be operator-dependent and variable in overall EV yield recovery (Citation45). As pre-spun medium requires the removal of serum EVs by this technique, there are doubts in the reproducibility of the overall depletion of serum EVs for sequential batches of pre-spun media. Furthermore, for molecular characterization of EVs and assessing their biological function or for their use as therapy, it is more desirable to grow cells in media devoid of serum to simplify purification and avoid serum contamination. Hence, we attempted to assess a serum-free media for EV collection. Comparing SF DMEM and OptiMEM, we found that there was a higher level of apoptosis of N2a cells cultured in SF DMEM and this was accompanied with a correspondingly higher number of particles in the SF DMEM sample. Moreover, as there was an abundant expression of Calnexin detected in the sample from SF DMEM, we speculated that most of these particles were simply apoptotic bodies released from the dying cells. As OptiMEM has been used extensively as media for cellular transfections, maintaining cell viability over short periods of time, this was tested as a serum-free condition. Our results show that the level of apoptosis was much lower when cells were cultured in OptiMEM. Hence, we continued this study with EVs collected from pre-spun versus OptiMEM condition.
Generally, higher starting cell density and longer incubation periods resulted in higher EV yields in both medium conditions. However, at incubation periods longer than 48 h in OptiMEM, the cells started to look unhealthy as expected due to the lack of serum. Although a greater number of particles were isolated from these late time point cultures, the ER marker, Calnexin was detected at high levels, suggesting the presence of apoptotic body contamination in the sample. Théry et al. previously reported that EVs float at 1.15–1.19 g/mL, which is different from vesicles produced from other organelles such as the ER (1.18–1.25 g/mL) and the Golgi (1.05–1.12 g/mL) (Citation43). However, our results indicate the presence of both Calnexin and EV markers at the same sucrose gradient densities for EVs collected from N2a cells over a 3-day period. This suggests that sucrose density gradients may be insufficient to separate EVs from other particles of similar densities. We postulate that the large differences in particle counts seen between OptiMEM and pre-spun samples at longer incubation periods may be attributed partially to the presence of these apoptotic vesicles. Hence, to minimize any contamination in EV analysis, it is highly important to collect EVs from healthy cells over an incubation period of no longer than 48 h in these analysed cells.
When considering a fixed incubation period of 48 h, higher particle counts paired with greater detection of EV markers, indicating enhanced release of EVs from cells cultured under OptiMEM conditions as compared with pre-spun media. Our nano LC–MS/MS analysis on the EVs showed that 60% of the total proteins identified were common in both conditions. However, of these commonly identified proteins, only 62% were expressed at similar levels in EVs isolated from both conditions.
Based on the GO annotations, several G-protein and GTPase/Ras-related proteins such as Ras homolog enriched in brain (RheB) and Rab9 were found to be higher in OptiMEM than in pre-spun EVs. Previously, studies have reported on the direct involvement of small GTPases such as Rab27a and 27b in MVB docking at the plasma membrane prior to EV release from cells (Citation31, Citation46). Others have also showed ARF6 and its effector phospholipase D2 (PLD2) as regulators of syntenin EV biogenesis through the control of ILVs budding into MVBs (Citation47). Coincidentally, our nano LC–MS/MS showed that ARF6 is one of the most significantly up-regulated proteins in EVs under OptiMEM conditions and western blotting further validated this result. Hence, it is tempting to speculate that under OptiMEM conditions, an increased expression of ARF6 and other small GTPases might lead to greater MVB docking and increased release of EVs containing these proteins.
Besides G-proteins and kinases, GO annotations also highlighted that OptiMEM EVs showed enrichment for oxygen and reactive species metabolic processes. One major difference between pre-spun and OptiMEM is the lack of serum in the latter media that could lead to cellular stress. Previously, it has been shown that other types of cellular stress such as hypoxia, exposure to TNF-α or high glucose do not affect the physical aspects of EVs but rather change the intra-EV protein and RNA content drastically (Citation48). Similarly, in our study, we did not detect any differences in the mode sizes of EVs between the conditions. However, our proteomics data do highlight that some stress-related proteins, such as macrophage migration inhibitory factor (MIF), epoxide hydrolase 1 (EPHX1) and MYG1 (Citation49–Citation51), were up-regulated in EVs from OptiMEM compared with pre-spun conditions. Using western blotting, we validated that MYG1 expression levels were higher in both the EVs and the parental cells as compared with pre-spun conditions. As OptiMEM lacks serum, we propose that these serum-free conditions may exert a type of cellular stress on the cells and increase the release of EVs, where some encapsulate these stress-related proteins, as a response to the stress stimuli.
As for pre-spun EVs, these contained a much smaller number of proteins that were more highly expressed than in OptiMEM EVs. Most of these proteins identified are involved in mRNA binding, splicing and processing activity. We selected and validated SERPINF1, which was one of the most differently, expressed proteins in pre-spun as compared to OptiMEM EVs. SERPINF1, otherwise known as pigment epithelium derived factor (PEDF), is a serine protease inhibitor (Citation52) involved in anti-angiogenic activity and cell proliferation in neuroblastoma tumour cells (Citation53, Citation54). Previously, PEDF was found in EVs from pleural effusions (Citation55); however, its role in EVs remains unclear.
In conclusion, we here show that differences in culture media can affect the quantity and composition of released EVs. In both mouse and human neuroblastoma cell lines, more EVs were collected from cultures incubated with OptiMEM than those with pre-spun media.
Moreover, our proteomics analysis on N2a EVs showed that these 2 groups of EVs presented with different proteome profiles. EVs from OptiMEM conditions contained higher amounts of G-proteins, small GTPases and kinases. Additionally, these EVs displayed an increase in oxygen and reactive oxygen species processes, which may reflect cellular stress due to culture under serum-free conditions. On the other hand, pre-spun EVs appear to contain higher amounts of proteins involved in RNA processing. Hence, we hypothesize that under OptiMEM serum-free conditions, N2a cells respond by activating signalling cascades, including those involved in EVs biogenesis and release. These results offer insight into how the extracellular environment can affect intracellular signalling pathways, which in turn can affect EV production and content.
Authors' contributions
JHL and YL designed and performed the experiments and wrote the manuscript. IM performed apoptosis assay and data analysis. JN and OW prepared the EV samples for nano LC–MS/MS. HJ and JL performed the nano LC–MS/MS. HJ, JHL, YL, PV and IM carried out bioinformatics analysis. HJ, IM, PV, SEA and MW contributed to the experimental design and correction of the manuscript.
Conflict of interest and funding
The authors declare no conflict of interest.
Supplementary Material
Download PDF (208.6 KB)Acknowledgements
JHL, IM and the project are supported by an EU IMI funding programme (COMPACT). YL is supported by Agency for Science, Technology and Research (A*STAR), Singapore. IM was supported by a Postdoctoral MOBILITAS Fellowship of Estonian Science Foundation and by the Estonian Research Council Grant PUT618. PV is supported by a Rubicon Fellowship from the Netherlands Organisation for Scientific Research (NWO). JN and OW are both recipients of Karolinska Institutet MD/PhD grants. S.ELA is supported by the Swedish Medical Research Council (VR-Med), Swedish Society of Medical Research (SSMF) and EuroNanoMedII. HJ and JL are supported by the Swedish Research Council (VR-NT) and Swedish Cancer Society.
Notes
To access the supplementary material to this article, please see Supplementary files under ‘Article Tools’.
Related Research Data
References
- Van Niel G, Raposo G, Candalh C, Boussac M, Hershberg R, Cerf-Bensussan N et al. Intestinal epithelial cells secrete exosome-like vesicles. Gastroenterol. 2001; 121: 337–49.
- McLellan AD. Exosome release by primary B cells. Crit Rev Immunol. 2009; 29: 203–17.
- Raposo G, Tenza D, Mecheri S, Peronet R, Bonnerot C, Desaymard C. Accumulation of major histocompatibility complex class II molecules in mast cell secretory granules and their release upon degranulation. Mol Biol Cell. 1997; 8: 2631–45.
- Quah BJC, O'Neill HC. The immunogenicity of dendritic cell-derived exosomes. Blood Cells Mol Dis. 2005; 35: 94–110.
- Lachenal G, Pernet-Gallay K, Chivet M, Hemming FJ, Belly A, Bodon G et al. Release of exosomes from differentiated neurons and its regulation by synaptic glutamatergic activity. Mol Cell Neurosci. 2011; 46: 409–18.
- Théry C, Boussac M, Véron P, Ricciardi-Castagnoli P, Raposo G, Garin J et al. Proteomic analysis of dendritic cell-derived exosomes: a secreted subcellular compartment distinct from apoptotic vesicles. J Immunol. 2001; 166: 7309–18.
- Valadi H, Ekström K, Bossios A, Sjöstrand M, Lee JJ, Lötvall JO. Exosome-mediated transfer of mRNAs and microRNAs is a novel mechanism of genetic exchange between cells. Nat Cell Biol. 2007; 9: 654–9.
- Calzolari A, Raggi C, Deaglio S, Sposi NM, Stafsnes M, Fecchi K et al. TfR2 localizes in lipid raft domains and is released in exosomes to activate signal transduction along the MAPK pathway. J Cell Sci. 2006; 119: 4486–98.
- Iero M, Valenti R, Huber V, Filipazzi P, Parmiani G, Fais S et al. Tumour-released exosomes and their implications in cancer immunity. Cell Death Differ. 2008; 15: 80–8.
- Grange C, Tapparo M, Collino F, Vitillo L, Damasco C, Deregibus MC et al. Microvesicles released from human renal cancer stem cells stimulate angiogenesis and formation of lung premetastatic niche. Cancer Res. 2011; 71: 5346–56.
- Hong BS, Cho J-H, Kim H, Choi E-J, Rho S, Kim J et al. Colorectal cancer cell-derived microvesicles are enriched in cell cycle-related mRNAs that promote proliferation of endothelial cells. BMC Genomics. 2009; 10: 556.
- Bellingham SA, Guo BB, Coleman BM, Hill AF. Exosomes: vehicles for the transfer of toxic proteins associated with neurodegenerative diseases?. Front Physiol. 2012; 3: 124.
- Schneider A, Simons M. Exosomes: vesicular carriers for intercellular communication in neurodegenerative disorders. Cell Tissue Res. 2013; 352: 33–47.
- Fevrier B, Vilette D, Archer F, Loew D, Faigle W, Vidal M et al. Cells release prions in association with exosomes. Proc Natl Acad Sci U S A. 2004; 101: 9683–8.
- Alvarez-Erviti L, Seow Y, Yin H, Betts C, Lakhal S, Wood MJA. Delivery of siRNA to the mouse brain by systemic injection of targeted exosomes. Nat Biotechnol. 2011; 29: 341–5.
- Wahlgren J, Karlson TDL, Brisslert M, Vaziri Sani F, Telemo E, Sunnerhagen P et al. Plasma exosomes can deliver exogenous short interfering RNA to monocytes and lymphocytes. Nucleic Acids Res. 2012; 40: e130.
- EL Andaloussi S, Mäger I, Breakefield XO, Wood MJA. Extracellular vesicles: biology and emerging therapeutic opportunities. Nat Rev Drug Discov. 2013; 12: 347–57. [PubMed Abstract].
- Colombo M, Raposo G, Théry C. Biogenesis, secretion, and intercellular interactions of exosomes and other extracellular vesicles. Annu Rev Cell Dev Biol. 2014; 30: 255–89.
- Gould SJ, Raposo G. As we wait: coping with an imperfect nomenclature for extracellular vesicles. J Extracell Vesicles. 2013; 2 20389, doi: http://dx.doi.org/10.3402/jev.v2i0.20389.
- Phuyal S, Hessvik NP, Skotland T, Sandvig K, Llorente A. Regulation of exosome release by glycosphingolipids and flotillins. FEBS J. 2014; 281: 2214–27.
- King HW, Michael MZ, Gleadle JM. Hypoxic enhancement of exosome release by breast cancer cells. BMC Cancer. 2012; 12: 421.
- Koles K, Nunnari J, Korkut C, Barria R, Brewer C, Li Y et al. Mechanism of evenness interrupted (Evi)-exosome release at synaptic boutons. J Biol Chem. 2012; 287: 16820–34.
- Tamai K, Tanaka N, Nakano T, Kakazu E, Kondo Y, Inoue J et al. Exosome secretion of dendritic cells is regulated by Hrs, an ESCRT-0 protein. Biochem Biophys Res Commun. 2010; 399: 384–90.
- Colombo M, Moita C, van Niel G, Kowal J, Vigneron J, Benaroch P et al. Analysis of ESCRT functions in exosome biogenesis, composition and secretion highlights the heterogeneity of extracellular vesicles. J Cell Sci. 2013; 126: 5553–65.
- Kajimoto T, Okada T, Miya S, Zhang L, Nakamura S. Ongoing activation of sphingosine 1-phosphate receptors mediates maturation of exosomal multivesicular endosomes. Nat Commun. 2013; 4: 2712.
- Kosaka N, Izumi H, Sekine K, Ochiya T. microRNA as a new immune-regulatory agent in breast milk. Silence. 2010; 1: 7.
- Trajkovic K, Hsu C, Chiantia S, Rajendran L, Wenzel D, Wieland F et al. Ceramide triggers budding of exosome vesicles into multivesicular endosomes. Science. 2008; 319: 1244–7.
- Vidal MJ, Stahl PD. The small GTP-binding proteins Rab4 and ARF are associated with released exosomes during reticulocyte maturation. Eur J Cell Biol. 1993; 60: 261–7. [PubMed Abstract].
- Savina A, Fader CM, Damiani MT, Colombo MI. Rab11 promotes docking and fusion of multivesicular bodies in a calcium-dependent manner. Traffic Cph Den. 2005; 6: 131–43.
- Savina A, Vidal M, Colombo MI. The exosome pathway in K562 cells is regulated by Rab11. J Cell Sci. 2002; 115: 2505–15. [PubMed Abstract].
- Ostrowski M, Carmo NB, Krumeich S, Fanget I, Raposo G, Savina A et al. Rab27a and Rab27b control different steps of the exosome secretion pathway. Nat Cell Biol. 2010; 12: 19–30; sup 1–13.
- Hsu C, Morohashi Y, Yoshimura S-I, Manrique-Hoyos N, Jung S, Lauterbach MA et al. Regulation of exosome secretion by Rab35 and its GTPase-activating proteins TBC1D10A-C. J Cell Biol. 2010; 189: 223–32.
- Subra C, Laulagnier K, Perret B, Record M. Exosome lipidomics unravels lipid sorting at the level of multivesicular bodies. Biochimie. 2007; 89: 205–12.
- Subra C, Grand D, Laulagnier K, Stella A, Lambeau G, Paillasse M et al. Exosomes account for vesicle-mediated transcellular transport of activatable phospholipases and prostaglandins. J Lipid Res. 2010; 51: 2105–20.
- Llorente A, van Deurs B, Sandvig K. Cholesterol regulates prostasome release from secretory lysosomes in PC-3 human prostate cancer cells. Eur J Cell Biol. 2007; 86: 405–15.
- Shelke GV, Lässer C, Gho YS, Lötvall J. Importance of exosome depletion protocols to eliminate functional and RNA-containing extracellular vesicles from fetal bovine serum. J Extracell Vesicles. 2014; 3 24783, doi: http://dx.doi.org/10.3402/jev.v3.24783 [PubMed CentralFull Text].
- Potolicchio I, Carven GJ, Xu X, Stipp C, Riese RJ, Stern LJ et al. Proteomic analysis of microglia-derived exosomes: metabolic role of the aminopeptidase CD13 in neuropeptide catabolism. J Immunol. 2005; 175: 2237–43.
- Fauré J, Lachenal G, Court M, Hirrlinger J, Chatellard-Causse C, Blot B et al. Exosomes are released by cultured cortical neurones. Mol Cell Neurosci. 2006; 31: 642–8.
- Lai RC, Chen TS, Lim SK. Mesenchymal stem cell exosome: a novel stem cell-based therapy for cardiovascular disease. Regen Med. 2011; 6: 481–92.
- Mi H, Muruganujan A, Thomas PD. PANTHER in 2013: modeling the evolution of gene function, and other gene attributes, in the context of phylogenetic trees. Nucleic Acids Res. 2013; 41: D377–86.
- Lässer C, Eldh M, Lötvall J. Isolation and characterization of RNA-containing exosomes. J Vis Exp. 2012; (59): e3037.
- Saunderson SC, Schuberth PC, Dunn AC, Miller L, Hock BD, MacKay PA et al. Induction of exosome release in primary B cells stimulated via CD40 and the IL-4 receptor. J Immunol. 2008; 180: 8146–52.
- Théry C, Amigorena S, Raposo G, Clayton A. Isolation and characterization of exosomes from cell culture supernatants and biological fluids. Curr Protoc Cell Biol. 2006. Chapter 3: Unit 3.22..
- Mathivanan S, Fahner CJ, Reid GE, Simpson RJ. ExoCarta 2012: database of exosomal proteins, RNA and lipids. Nucleic Acids Res. 2012; 40: D1241–4.
- Nordin JZ, Lee Y, Vader P, Mäger I, Johansson HJ, Heusermann W et al. Ultrafiltration with size-exclusion liquid chromatography for high yield isolation of extracellular vesicles preserving intact biophysical and functional properties. Nanomed Nanotechnol Biol Med. 2015; 11: 879–83.
- Pfeffer SR. Two rabs for exosome release. Nat Cell Biol. 2010; 12: 3–4.
- Ghossoub R, Lembo F, Rubio A, Gaillard CB, Bouchet J, Vitale N et al. Syntenin-ALIX exosome biogenesis and budding into multivesicular bodies are controlled by ARF6 and PLD2. Nat Commun. 2014; 5: 3477.
- De Jong OG, Verhaar MC, Chen Y, Vader P, Gremmels H, Posthuma G et al. Cellular stress conditions are reflected in the protein and RNA content of endothelial cell-derived exosomes. J Extracell Vesicles. 2012; 1 18396, doi: http://dx.doi.org/10.3402/jev.v1i0.18396 [PubMed CentralFull Text].
- Philips M-A, Vikeså J, Luuk H, Jønson L, Lilleväli K, Rehfeld JF et al. Characterization of MYG1 gene and protein: subcellular distribution and function. Biol Cell Auspices Eur Cell Biol Organ. 2009; 101: 361–73.
- Alexander JK, Cox GM, Tian J-B, Zha AM, Wei P, Kigerl KA et al. Macrophage migration inhibitory factor (MIF) is essential for inflammatory and neuropathic pain and enhances pain in response to stress. Exp Neurol. 2012; 236: 351–62.
- Cheong AWY, Lee Y-L, Liu W-M, Yeung WSB, Lee K-F. Oviductal microsomal epoxide hydrolase (EPHX1) reduces reactive oxygen species (ROS) level and enhances preimplantation mouse embryo development. Biol Reprod. 2009; 81: 126–32.
- Steele FR, Chader GJ, Johnson LV, Tombran-Tink J. Pigment epithelium-derived factor: neurotrophic activity and identification as a member of the serine protease inhibitor gene family. Proc Natl Acad Sci U S A. 1993; 90: 1526–30.
- Crawford SE, Stellmach V, Ranalli M, Huang X, Huang L, Volpert O et al. Pigment epithelium-derived factor (PEDF) in neuroblastoma: a multifunctional mediator of Schwann cell antitumor activity. J Cell Sci. 2001; 114: 4421–8. [PubMed Abstract].
- Samkharadze T, Erkan M, Reiser-Erkan C, Demir IE, Kong B, Ceyhan GO et al. Pigment epithelium-derived factor associates with neuropathy and fibrosis in pancreatic cancer. Am J Gastroenterol. 2011; 106: 968–80.
- Bard MP, Hegmans JP, Hemmes A, Luider TM, Willemsen R, Severijnen L-AA et al. Proteomic analysis of exosomes isolated from human malignant pleural effusions. Am J Respir Cell Mol Biol. 2004; 31: 114–21.