
Abstract
Extracellular vesicles represent a rich source of novel biomarkers in the diagnosis and prognosis of disease. However, there is currently limited information elucidating the most efficient methods for obtaining high yields of pure exosomes, a subset of extracellular vesicles, from cell culture supernatant and complex biological fluids such as plasma. To this end, we comprehensively characterize a variety of exosome isolation protocols for their efficiency, yield and purity of isolated exosomes. Repeated ultracentrifugation steps can reduce the quality of exosome preparations leading to lower exosome yield. We show that concentration of cell culture conditioned media using ultrafiltration devices results in increased vesicle isolation when compared to traditional ultracentrifugation protocols. However, our data on using conditioned media isolated from the Non-Small-Cell Lung Cancer (NSCLC) SK-MES-1 cell line demonstrates that the choice of concentrating device can greatly impact the yield of isolated exosomes. We find that centrifuge-based concentrating methods are more appropriate than pressure-driven concentrating devices and allow the rapid isolation of exosomes from both NSCLC cell culture conditioned media and complex biological fluids. In fact to date, no protocol detailing exosome isolation utilizing current commercial methods from both cells and patient samples has been described. Utilizing tunable resistive pulse sensing and protein analysis, we provide a comparative analysis of 4 exosome isolation techniques, indicating their efficacy and preparation purity. Our results demonstrate that current precipitation protocols for the isolation of exosomes from cell culture conditioned media and plasma provide the least pure preparations of exosomes, whereas size exclusion isolation is comparable to density gradient purification of exosomes. We have identified current shortcomings in common extracellular vesicle isolation methods and provide a potential standardized method that is effective, reproducible and can be utilized for various starting materials. We believe this method will have extensive application in the growing field of extracellular vesicle research.
It has been recognized that critical components of intercellular communication are small membrane extracellular vesicles (EVs) (Citation1, Citation2). EVs are capable of inducing local and systemic changes, thereby promoting disease progression in a number of settings (Citation3). The functional impact of EVs is imparted by the molecular components (e.g. protein and RNA cargo) they carry, prompting the increased interest in EVs as potential novel biomarkers for the diagnosis and prognosis of disease progression (Citation4).
A current problem impeding the advancement in EV research is the lack of characterization of current methodologies evaluating their usability, vesicle purity and yield from cell culture conditioned media (CCM), and complex biological fluids such as plasma. High-throughput methods that minimize the co-isolation of protein aggregates are essential to develop accurate biomarker signatures for disease and assess the downstream biological impacts of EVs in recipient cells. The current “gold standard” for the purification of a subset of EVs (known as exosomes) is differential centrifugation, which typically consists of low-speed centrifugation to remove cells and large vesicles and high-speed ultracentrifugation to pellet exosomes (Citation5). Density gradients can then be utilized to remove contaminating impurities such as non-specific argonaute proteins (Citation6). Ultracentrifugation of large volumes of CCM can be cumbersome and results in sample loss depending on the skill of the operator. It has also been suggested in the literature that repeated ultracentrifugation steps can damage vesicles and reduce yields, thereby potentially impacting proteomic and RNA analysis of exosome content (Citation7). An alternative to ultracentrifugation is concentration of large volumes of CCM using ultrafiltration devices. Thus we have developed an optimized protocol for exosome isolation minimizing these issues.
In this study, we comprehensively detail tunable resistive pulse sensing (TRPS)-based assessments of particle size and concentration, in conjunction with protein analysis of purified exosomes in order to assess isolation efficacy. Using these analysis techniques, we address the impact of repeated ultracentrifugation steps on vesicle yield when compared to ultrafiltration of CCM. Our evaluation of particle yield and purity compares and contrasts 4 methods, including 2 commercial products that have not been assessed in the current literature: size exclusion chromatography (SEC) using qEV columns, and density gradient purification. Utilizing human plasma, we demonstrate that isolation techniques vary greatly in their ability to provide pure populations of exosomes. We find that OptiPrep™ gradient isolation provides the highest purification of exosomes from CCM, but is comparable to SEC when evaluating protein exosome markers. SEC is also shown to be exceptional in purifying exosomes from plasma and outperforms precipitation protocols that heavily co-isolate contaminating plasma proteins. This purity is essential for the comprehensive analysis of exosomes as potential biomarkers.
Materials and methods
Cell culture
The SK-MES-1 cell line was used to isolate exosomes. This cell line is an adherent human squamous Non-Small-Cell Lung Cancer (NSCLC) cell line. SK-MES-1 cells were obtained from ATCC, and authentication was carried out in-house using short tandem repeat (STR) profiling. Cells were maintained in Dulbecco's minimal essential medium (DMEM) supplemented with 10% foetal bovine serum, 100 U/mL penicillin and 100 mg/mL streptomycin and incubated at 37°C in 5% CO2. Cells were grown to 70% confluency, washed 3 times with PBS and incubated for 24 hours in serum free media. CCM was collected after 24 hours, and cell cultures were trypsinized and analyzed for the presence of necrotic cells with trypan blue staining.
Plasma preparation
All plasma collection and preparation protocols were approved by the QIMR Berghofer Human Ethics Committee (P1499) and participants provided written, informed consent. All plasma used in this investigation was obtained from one individual. Twenty millilitres of blood was obtained from a healthy volunteer in EDTA-coated tubes and allowed to sit at room temperature for 30 minutes. Whole blood was then centrifuged at 1,200 g for 10 minutes at 4°C to separate plasma. Plasma was transferred to a clean tube and centrifuged again at 1,800 g for 10 minutes at 4°C before being aliquoted, snap frozen on dry ice and stored at −80°C until use.
Ultracentrifugation
CCM was harvested from SK-MES-1 cells and centrifuged using a Beckman Coulter Allegra® X-15R centrifuge at 300 g at 4°C for 10 minutes to remove detached cells. Supernatant was collected and filtered through 0.22 µm filters (Merck Millipore) to remove contaminating apoptotic bodies, microvesicles and cell debris. Clarified CCM was then centrifuged in a Beckman Coulter Optima™ L-80XP Ultracentrifuge at 100,000 g avg at 4°C for 90 minutes with a Type 50.2 Ti rotor (k-factor: 157.7) to pellet exosomes. The supernatant was carefully removed, and crude exosome-containing pellets were resuspended in 1 mL of ice-cold PBS and pooled. A second round of ultracentrifugation [100,000 g avg at 4°C for 90 minutes with a Type 50.2 Ti rotor (k-factor: 157.7)] was carried out, and the resulting exosome pellet resuspended in 500 µL of PBS (Supplementary Fig. 1).
Ultrafiltration
Clarified CCM was prepared as described above and concentrated to 500 µL using either pressure-driven or centrifugation-based concentrating protocols (Supplementary Fig. 2). Briefly, 150 mL of CCM was concentrated to 5 mL in Stirred Cell Model 8200 with 100,000 kDa Biomax polyethersulfone or Ultracel regenerated cellulose membranes using nitrogen gas (10 psi). The 10 mL concentrate was transferred to an Amicon® Ultra-15 100,000 kDa device and concentrated further to 500 µL using an Allegra® X-15R centrifuge at 4,000 g at 4°C. After use, membranes were washed with gentle shaking in either 30 mL 70% ethanol or 0.1 M NaOH for 5 minutes and rinsed 3 times in PBS for 5 minutes. Alternatively, 150 mL of CCM was concentrated to 500 µL with the Centricon Plus-70 Centrifugal Filter (Ultracel-PL Membrane, 100 kDa) device using an Allegra® X-15R centrifuge at 3,500 g at 4°C. The concentrate was then recovered with a reverse spin at 1,000 g for 2 minutes. Centricon devices were washed with 30 mL 70% ethanol or 0.1 M NaOH by centrifugation at 3,500 g. Centricon devices were then rinsed by centrifugation at 3,500 g with 30 mL volumes of PBS (Supplementary Fig. 2).
OptiPrep TM density gradient purification
Exosomes were purified using an OptiPrep™ density gradient. Briefly, a discontinuous iodixanol gradient was prepared by diluting a stock solution of OptiPrep™ (60% w/v) with 0.25 M sucrose/10 mM Tris, pH 7.5 to generate 40%, 20%, 10% and 5% w/v iodixanol solutions. With care, the discontinuous iodixanol gradient was generated by sequentially layering 3 mL each of 40, 20 and 10% (w/v) iodixanol solutions, followed by 2.5 mL of the 5% iodixanol solution in 14×89 mm Ultra-Clear™ Beckman Coulter centrifuge tubes. A 500 µL volume of CCM containing 6×10¹¹ particles was overlaid on the discontinuous iodixanol gradient and centrifuged using a SW 40 Ti rotor for 16 hours at 100,000 g avg (k-factor: 277.5) at 4°C. Fractions of 1 mL were collected from the top of the gradient and analyzed for particle concentration with TRPS. Positive fractions (6 and 7) were diluted to 20 mL in PBS and centrifuged at 100,000 g avg for 2 hours at 4°C with a Type 50.2 Ti rotor (k-factor: 157.7). The resulting pellets were resuspended in 200 µL PBS.
ExoQuick™ precipitation
Exosome isolation from CCM
ExoQuick™ precipitation was carried out according to manufacturer's instructions (System Biosciences). Briefly, 500 µL of clarified CCM was diluted to 5 mL in PBS and mixed with 1 mL of ExoQuick-TC™ solution by inverting the tube several times. The sample was incubated overnight at 4°C then centrifuged twice at 1,500 g for 30 and 5 minutes, respectively, in order to remove the supernatant. The supernatant was discarded, and the pellet was resuspended in 200 µL of PBS.
Exosome isolation from human plasma
Plasma was thawed on ice and centrifuged at 1,500 g for 10 minutes at 4°C. The supernatant was removed, and large vesicles were removed with another centrifugation step at 10,000 g for 20 minutes at 4°C. The supernatant was transferred to a new tube, and 2.5 µL of Thrombin (System Bioscience, TMEXO-1) was added to 250 µL of plasma and incubated for 5 minutes at room temperature to remove fibrinogen. The plasma was then centrifuged at 10,000 g for 5 minutes, and the supernatant was collected. The plasma was then incubated with ExoQuick™ for 60 minutes at 4°C. The ExoQuick™/plasma sample was then centrifuged twice at 1,500 g for 30 and 5 minutes, respectively, in order to remove the supernatant. The pellet was resuspended in 200 µL of PBS and filtered through an Ultrafree® 0.22 µm centrifugal filter device (Merck Millipore) to remove any large contaminating vesicles.
Exo-spin™ precipitation
Exosome isolation from CCM
Exo-spin™ precipitation was carried out according to manufacturer's instructions (Cell Guidance Systems). Briefly, 250 µL of precipitation buffer was mixed with 500 µL of clarified CCM and incubated overnight at 4°C. The sample was then spun at 20,000 g for 30 minutes and the supernatant was discarded; the pellet was then resuspended in 100 µL of PBS. The sample was further purified using the provided columns, and exosomes were eluted in 200 µL of PBS.
Exosome isolation from human plasma
For the isolation of exosomes from human plasma, 250 µL of plasma was thawed on ice and prepared by removing platelets and large vesicles by spinning at 1,500 g and 10,000 g for 10 and 20 minutes, respectively. Two-hundred microlitres of prepared plasma was then mixed with 100 µL of precipitation reagent and incubated at 4°C for 5 minutes before pelleting exosomes at 20,000 g for 30 minutes. The supernatant was removed, and the exosome-containing pellet resuspended in 100 µL of PBS and purified on columns as before. The 200 µL exosome preparation was further filtered through an Ultrafree® 0.22 µm centrifugal filter device to remove any large contaminating vesicles.
Size exclusion purification
Five-hundred microlitres of clarified CCM, or 1 mL of processed plasma (centrifuged at 1,500 g and 10,000 g for 10 and 20 minutes, respectively) was overlaid on qEV size exclusion columns (Izon) followed by elution with PBS. Five-hundred-microlitre fractions were collected, and particle and protein concentrations determined with TRPS and the Bradford assay (Bio-Rad), respectively (Supplementary Fig. 3). High particle/low protein fractions from CCM were pooled and concentrated in Amicon® Ultra-4 10 kDa nominal molecular weight centrifugal filter units to a final volume of 200 µL. Fractions from plasma were pooled and filtered with an Ultrafree® 0.22 µm centrifugal filter device before being concentrated in an Amicon® Ultra-4 10 kDa device.
Tunable resistive pulse sensing
The concentration and size distribution of particles was analyzed with TRPS (qNano, Izon Science Ltd) using a NP100 nanopore at a 45 mm stretch. The concentration of particles was standardized using multi-pressure calibration with 70 nm carboxylated polystyrene beads at a concentration of 1.5×10¹¹ particles/mL.
Electron microscopy
Exosomes were visualized using transmission electron microscopy (TEM) according to Thery et al. (Citation5). Briefly, 3 µL of exosome suspension was fixed in 50–100 µL of 2% paraformaldehyde. Two microlitres of this mix was transferred onto each of 2 Formvar-carbon coated electron microscopy grids. Membranes were covered for 20 minutes. A 100 µL drop of PBS was placed on a sheet of parafilm and grids transferred with the sample membrane side facing down using clean forceps for 2 minutes. The grids were kept wet on the side of the membrane during all steps, but dry on the opposite side. The grids were transferred to a 50 µL drop of 1% glutaraldehyde for 5 minutes before transferring to a 100 µL drop of distilled water for 2 minutes. This was repeated 7 times for a total of 8 water washes. To contrast the samples, grids were transferred to a 50 µL drop of uranyl-oxalate solution, pH 7, for 5 minutes before transferring to a 50 µL drop of methyl-cellulose-UA (a mixture of 4% uranyl acetate and 2% methyl cellulose in a ratio of 100 µL/900 µL, respectively) for 10 minutes, placing the grids on a glass dish covered with parafilm on ice. The grids were removed with stainless steel loops and excess fluid blotted gently on Whatman no.1 filter paper. Grids were left to dry and stored in appropriate grid storage boxes. Grids were observed with JEM 1,011 transmission electron microscope at 80 kV.
Antibodies and reagents
qEV columns were purchased from Izon and stored in PBS (0.1% sodium azide) at 4°C. Exo-Spin™ and ExoQuick™ kits for blood and cell culture were purchased from Cell Guidance Systems and System Bioscience, respectively, and stored at 4°C until use. OptiPrep™ was purchased from Sigma-Aldrich. The following antibodies were used for Western blotting: TSG101 (Santa Cruz, sc-6037), CD63 (Abcam, ab8219), Flotillin-1 (BD Transduction Laboratories, 610821), HSP70 (Transduction Laboratories, 610608), Calnexin (Cell Signaling Technology, 2679S) and Albumin (Cell Signaling Technology, 4929S). Horseradish peroxidase (HRP)-conjugated secondary antibodies were purchased from Thermo Scientific.
Western blot analysis
Western blots were performed as previously described (Citation8, Citation9). Briefly, exosome isolations were lysed in reducing sample buffer [0.25 M Tris–HCl (pH 6.8), 40% glycerol, 8% SDS, 5% 2-mercaptoethanol and 0.04% bromophenol blue] or non-reducing sample buffer (without 2-mercaptoethanol) and boiled for 10 minutes at 95°C. Proteins were resolved by SDS-PAGE (SDS-polyacrylamide gel electrophoresis), transferred to polyvinylidene fluoride membranes, blocked in 5% non-fat powdered milk in PBS-T (0.5% Tween-20) and probed with antibodies. All proteins were resolved under fully denaturing and reducing conditions, apart from CD63, which was resolved under non-reducing conditions. Protein bands were detected using X-ray film and enhanced chemiluminescence reagent (Amersham ECL Select).
Statistical methods
Statistical analyses were performed using Student's t-test and one-way analysis of variance. All experiments were performed as a minimum of 3 independent repeats. Differences with p-values less than 0.05 were considered significant (*p<0.05, *p<0.001, ***p<0.0001).
Results
SK-MES-1 cells secrete exosomes
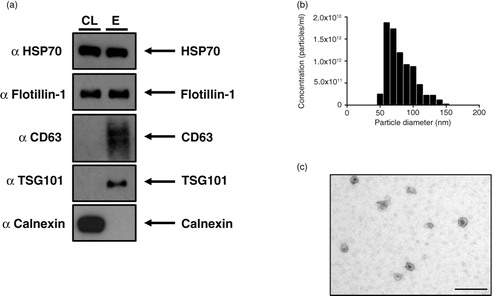
The identification of particles as exosomes relies on various criteria. Exosomes range in size from 50 to 100 nm (Citation8), they display a cup-shaped morphology by EM, and proteomic analysis reveals the presence of common proteins (Citation9–Citation11). a demonstrates the presence of canonical exosome proteins and the absence of the endoplasmic reticulum protein Calnexin from exosomes isolated using the ultrafiltration protocol (Supplementary Fig. 1). Furthermore, isolated particles exhibit expected morphology and size profiles consistent with pure exosome preparations (b and c).
Fig. 1. The NSCLC SK-MES-1 cell line produces exosomes that can be isolated with ultrafiltration of CCM. (a) 5 µg of protein was used for Western blot analysis of isolated exosomes. The presence of canonical exosome proteins, and the absence of Calnexin demonstrates a pure exosome preparation. (b) TRPS analysis demonstrates a size distribution of particles consistent with the size range of exosomes. (c) EM image of exosomes demonstrates cup-shape morphology, size bar=200 nm. CL: cell lysate; E: exosome lysate.
Centrifugal concentration provides optimal particle yield from CCM
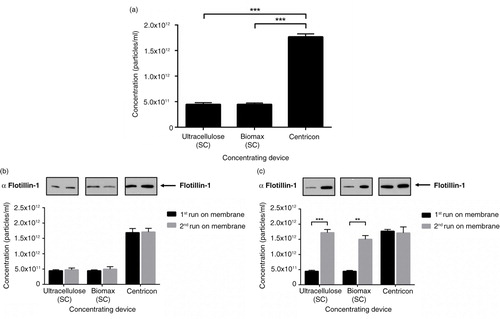
Currently, the main protein concentrating devices available are either pressure-driven (Stirred Cell) or centrifugation-based (Centricon). In order to investigate if there are differences in exosome yield between the 2 methods, we compared the Stirred Cell using a cellulose or biomax membrane with Centricon protein concentrators. Interestingly, using the Stirred Cell, both cellulose and biomax membranes recovered less particles than the Centricon device, which had an approximate 3-fold greater yield (a). This was also seen when the abundance of the canonical exosome protein Flotillin-1 (Citation9, Citation10) was assessed (b). When membranes were restored with sodium hydroxide, particle yield remained low in the Stirred Cell concentration workflow, with no impact on the yield from the Centricon (b). However, when the membranes were washed thoroughly with ethanol and PBS, the yield from the Stirred Cell increased to levels comparable to the Centricon (c). These data indicated that the Centricon method is superior in concentrating exosomes and that Stirred Cell membranes non-specifically bind a significant amount of exosomes.
Fig. 2. The choice of concentrating method impacts on particle recovery. (a) Significant reduction in the yield of <100 nm particles was observed with the first run of a membrane using the pressure-driven concentrating Stirred Cell device, but not the centrifuge-based Centricon device. (b) Particle yield from membranes restored with NaOH remained low with the Stirred Cell, but was not altered with the Centricon concentrator. (c) <100 nm particle yield from the Stirred Cell was comparable to Centricon concentration when membranes were washed with ethanol. n=3±SEM, ***p<0.001. SC: Stirred Cell.
Ultrafiltration is a faster alternative to ultracentrifugation
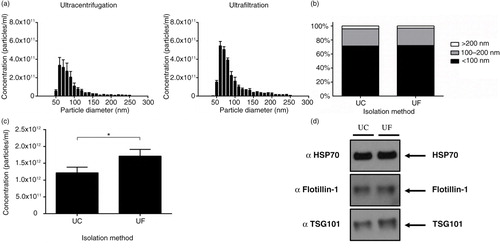
To investigate the exact differences between ultracentrifugation and ultrafiltration on exosome yield and quality, we used a combination of particle analysis and protein assessment of positive markers. Particle tracking using TRPS showed that both ultracentrifugation and ultrafiltration isolated particles ranging in size from 50 to 250 nm (a), with no difference observed in the percentage makeup of populations with defined size ranges (b). Interestingly, ultrafiltration resulted in the highest recovery of particles <100 nm compared to ultracentrifugation (c). Analysis of equal volumes of exosome preparations for HSP70 and Flotillin-1 was not sensitive enough to detect a higher ratio of exosomes between the 2 preparation methods; however, TSG101 expression was increased slightly in the ultrafiltration sample (d). Both methods were therefore comparable in recovering exosomes, yet ultrafiltration was far more time efficient taking only 20 minutes to concentrate 150 mL of CCM compared to 2 rounds of ultracentrifugation for 90 minutes each.
Fig. 3. Ultrafiltration recovers more particles compared to ultracentrifugation. (a) Size distribution of particles before density gradient purification. (b) Percentage of particle size ranges from ultracentrifugation and ultrafiltration isolations. (c) Ultrafiltration was shown to significantly increase the recovery of <100 nm particles compared to ultracentrifugation; n=3±SEM, *p<0.05. (d) Western blot analysis of equal volumes from ultracentrifugation and ultrafiltration did not show a large difference in protein markers for exosomes. UC: ultracentrifugation; UF: ultrafiltration.
Repeated ultracentrifugation reduces particle yield and recovery
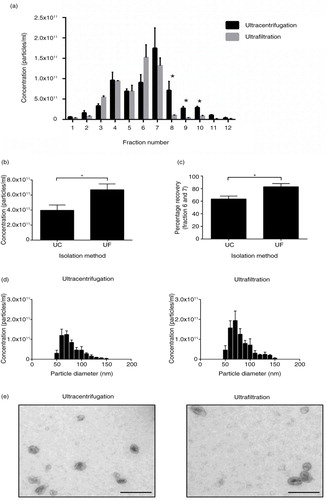
Next, we examined if repeated ultracentrifugation rounds would reduce the quality and recovery of exosomes purified with a density gradient. Interestingly, ultracentrifugation consistently resulted in significantly higher particle concentrations in fractions 8–10 (p<0.05) compared to exosomes prepared by ultrafiltration of CCM, suggesting that the different preparative methods altered particle characteristics (a). This increase in particle concentration at higher densities for ultracentrifugation was accompanied with an increase in the membrane protein Flotillin-1, but not TSG101, potentially indicating ruptured membranes (Supplementary Fig. 4). Positive protein markers for exosomes overlap in fractions 6 and 7, and these fractions were pooled and ultracentrifuged at 100,000 g for 2 hours to pellet exosomes for further analysis. Both ultracentrifugation and ultrafiltration before OptiPrep™ did not alter the size distribution, or morphology of purified exosomes (d and e). However, ultrafiltration preparations would consistently produce significantly higher particle yields (b), a result that was accompanied by a higher percentage recovery when total particles from fraction 6 and 7 were compared to total particles recovered (c).
Fig. 4. Ultrafiltration of CCM results in higher recovery of particles after density gradient purification. (a) Particle analysis of 1 mL fractions collected from density gradient. Ultracentrifugation results in a significantly higher proportion of particles at higher densities in fractions 8–10. (b) Total particles (<100 nm) isolated from ultracentrifugation and ultrafiltration. Ultrafiltration of CCM before density gradient purification results in a higher yield of <100 nm particles compared to ultracentrifugation preparation. (c) Percentage recovery of particles collected from fraction 6 and 7 is higher with the ultrafiltration protocol compared to ultracentrifugation. (d) Size distribution of particles isolated from both protocols indicates no difference in size profile of particles isolated. (e) EM images of exosomes isolated with ultracentrifugation and ultrafiltration protocols, size bar=200 nm. n=3±SEM, *p<0.05. UC: ultracentrifugation; UF: ultrafiltration.
The choice of isolation method impacts on particle concentration and protein yield
Exosomes were prepared from concentrated CCM of SK-MES-1 cells using 4 different isolation techniques. With the recent increased interest in EV research, there have been numerous commercial products being developed for the rapid isolation of exosomes. We compared 3 commercially available products: ExoQuick™, Exo-spin™ and Izon qEV columns with OptiPrep™ density gradient prepared exosomes. All 3 commercial products provided very similar size distribution profiles and morphology (a), the only difference being the presence of particles >200 nm when compared to density gradient exosome preparations (a and d). ExoQuick™ and Exo-spin™ produced significantly higher yields of <100 nm particles compared to qEV and density gradient isolation techniques (b). By contrast, when particles are expressed per µg of protein (a good indicator of particle purity (Citation12)), ExoQuick™ is shown to perform poorly, suggesting the co-isolation of contaminating proteins (c). Exo-spin™ performed significantly better compared to ExoQuick™, but both qEV and density gradient are the superior isolation techniques (c). Although there is a potential that precipitation protocols co-isolate a higher percentage of larger particles, we do not find this (d), largely due to the preparation of CCM with a 0.22 µm filtration step. The absence of larger particles is further validated with a larger nanopore (Supplementary Fig. 5). The increased ratio of particles per µg of protein seen with qEV columns compared to density gradient purification is most likely due to the loss of particles associated with density gradient purification (a). When selecting purely on size this loss is avoided, providing higher recovery of particles <100 nm in size.
Fig. 5. Alternative rapid isolation techniques of exosomes from concentrated media. (a) Size distribution and EM images of particles isolated from precipitation methods and qEV SEC columns, size bar=200 nm. (b) Precipitation methods isolate significantly more particles (<100 nm) compared to SEC and density gradient purification. (c) Concentration of particles expressed as a ratio per microgram of protein. Both SEC and DG provide superior purity as illustrated by significantly more particles per microgram of protein compared to precipitation protocols. (d) No difference was observed in the particle size composition of different isolation methods. (e) Western blot analysis of 10 µg of protein from each protocol. Exosome-positive markers were enriched in qEV and DG lysates compared to precipitation isolations, and all isolation techniques were absent for Calnexin, which was present only in the cell lystate fraction. n=3±SEM, *p<0.05, **p<0.01, ***p<0.001. CL: cell lysate; EQ: ExoQuick™; ES: Exo-spin™; qEV: size exclusion columns; DG: density gradient.
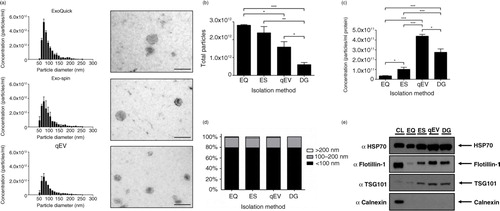
Density gradient and qEV samples are enriched for exosome markers
In order to validate the use of particles per µg of protein ratio as a measure of isolation efficacy, we assessed specific protein content by Western blot. We analyzed exosome markers using 10 µg of protein from each isolation method and found elevated levels of exosomal markers HSP70, Flotillin-1 and TSG101 in qEV and density gradient lysates compared to ExoQuick™ and Exo-spin™ (e). This further supports the idea that current precipitation techniques perform poorly in providing pure exosome preparations. Exo-spin™ yielded higher levels of exosome markers compared to ExoQuick™, indicating the importance of a post-precipitation purification step. In conclusion, both ExoQuick™ and Exo-spin™ have significantly more non-exosomal protein contamination as evidenced by the particle/protein ratio combined with increased exosome marker expression in qEV and density gradient isolations ().
SEC outperforms precipitation of exosomes isolated from human plasma
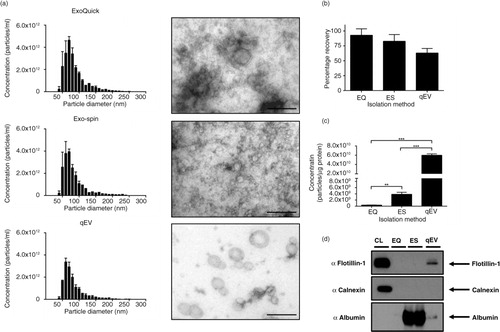
In order to assess the utility of these techniques on the isolation of exosomes from human bodily fluids, we isolated exosomes from normal human plasma using ExoQuick™, Exo-spin™ and qEV columns. Density gradient purification has been shown to provide the most pure exosome preparation from plasma (Citation13); however, due to the often-limited sample availability of plasma, we decided to assess techniques that would not require more than 1 mL of plasma. All 3 methods isolate particles with a size range equivalent to exosomes (a), but recovery of particles from plasma is dependent on the isolation process (b). At a low purity level, both precipitation protocols recover the majority of particles in relation to unprocessed plasma (b). The SEC method using qEV columns provided the lowest exosome recovery rate (b), but with the highest purity, based on the selective inclusion of eluted fractions. Similar to the isolation of exosomes from CCM, when the concentration of particles is expressed relative to protein concentration, ExoQuick™ performs very poorly (c). Exo-spin™ provides a significantly higher purification compared to ExoQuick™, but column purification alone provides the highest degree of purification (c). This is supported by EM, and Western blot analysis of 50 µg of protein. EM images indicate a high degree of contamination in exosome isolations (a), and Flotillin-1 was only detectable in the samples isolated with qEV technique (d). This was further accompanied with a high degree of albumin contamination in the ExoQuick™ and Exo-spin™ that was not present in the qEV isolation (Fig. 6d).
Fig. 6. Exosomes isolated from plasma. (a) Size distribution profiles and EM images indicated all 3 protocols isolated particles of the correct size, size bar=200 nm. (b) Percentage recovery of particles in relation to unprocessed plasma showed no difference between EQ, ES and qEV. (c) Particle/protein ratio indicated that SEC using qEV columns significantly outperformed both EQ and ES. (d) Western blot analysis of 50 µg of protein indicated that all 3 methods were absent for Calnexin; however, Flotillin-1 could only be detected in the qEV lysate. The presence of non-exosomal contaminating proteins in EQ and ES samples was demonstrated with the abundance of albumin, which was almost absent in the qEV sample. n=3±SEM, **p<0.01, ***p<0.001. CL: cell lysate; EQ: ExoQuick™; ES: Exo-spin™; qEV: size exclusion columns.
Discussion
EVs, including exosomes, are present in human biofluids such as plasma (Citation1, Citation14) (Citation15). As such, they can potentially serve as a source of novel biomarkers in the diagnosis and prognosis of diseases such as cancer or infectious diseases. As yet, the scientific community has not yet fully taken advantage of EVs which may be due to a lack of a standardized purification method. Although differential centrifugation coupled to ultracentrifugation has been the most widely adopted of methods, the impacts of repeated ultracentrifugation steps on the recovery of exosome yields has not been fully assessed. Ultracentrifugation is also not always applicable to clinical samples due to the volume of required starting material and the low throughput of this method. Moreover, standardization of purification protocols from CCM and biological fluids is necessary as disparate techniques impact on downstream protein and RNA profiling (Citation16). To this end, new rapid isolation protocols were assessed for yield and purity in order to standardize and optimize exosome purification protocols from CCM and human plasma.
Ultracentrifugation is the most widely used exosome purification protocol and has long been considered the gold standard for isolation of relatively homogenous size populations of exosomes (Citation3, Citation17) (Citation18). However, this process is lengthy and often results in variable recovery rates due to differences among researchers using different rotor types (Citation19). Further, repeated ultracentrifugation steps may damage isolated vesicles, reducing their quality. We show that ultrafiltration is capable of isolating exosomes (), and provides a higher particle yield compared to ultracentrifugation, thereby increasing exosome yield and isolation efficiency (). The increased yield of particle concentration is also coupled to a shorter processing time, thereby increasing the efficiency of sample throughput. This supports previous research that indicates that concentration methods are more suitable for producing clinical grade exosomes in time efficiency and quality compared to the classical ultracentrifugation protocol (Citation7).
Ultrafiltration is a powerful tool in optimizing exosome isolations, yet it was unclear what concentrating methods are most appropriate for exosome isolations. Particle yield can be dramatically low in pressure-driven concentrating devices compared to centrifuge concentrating devices (). Non-specific absorption to both cellulose and biomax membranes of the Stirred Cell causes this reduction. However, once the membrane has been sufficiently “blocked” with exosome particles, the yield from CCM is comparable to the Centricon. This is supported with washing the membranes with ethanol or sodium hydroxide. When the membrane was fully restored with sodium hydroxide, particle yield would remain low; however, an ethanol wash resulted in maximized particle yield (). This is most likely due to the large surface area (28.7 cm2), and contact time with the membrane of the Stirred Cell. This loss of particles does not occur with Centricons due to the lower surface area of the membrane (19 cm2), and a reverse centrifugation step allowing particles to be spun off the membrane. Given this, when working with volumes of 50–200 mL of conditioned media, a centrifuge-based concentrator is the most appropriate device. Some applications may require the use of larger volumes of CCM. We found that pressure-driven concentrating is more appropriate with volumes in excess of 400 mL due to the higher flow rate, and that exosome loss is only observed with the first 50–100 mL of CCM.
Previous studies on comparing exosome isolation techniques have been carried out (Citation6, Citation13) (Citation20), but there is limited information regarding recent precipitation-based isolation techniques. In addition to updating the analysis of these techniques, we compared preparation efficacy utilizing the NSCLC cell line SK-MES-1 for yield. Density gradient purification is a technique repeatedly shown to provide the highest degree of purity (Citation6, Citation12) (Citation13). Interestingly, separation of particles with a density gradient revealed a large abundance of particles in lower density fractions, particularly fractions 3–5 (), demonstrating a heterogeneity of particles among exosome preparations. This heterogeneity has been described by others (Citation21), showing the presence of particles with different structural and biochemical features due to different mechanisms of biogenesis. Importantly, it should be recognized that ExoQuick™, Exo-spin™ and qEV are unable to resolve this particle heterogeneity, leading to the isolation of non-exosomal particles.
For the determination of an isolation method that delivers the purest exosome isolation, the combination of both particle and protein concentration analysis is required as either alone is insufficient to determine the overall performance of an isolation technique. All methods (ExoQuick™, Exo-spin™, qEV and density gradient) were shown to isolate exosomes from CCM as indicated by EM, size profiling using TRPS and Western blot analysis. The importance of using both particle and protein concentration is indicated as precipitation protocols produced the highest yield of particles, yet had the lowest ratio of particles to protein, potentially due to co-isolation of contaminants (b and c). It is a possibility that high particle low protein measurements could be attained if exosomes were damaged during the isolation protocol and lost some protein cargo. However, given that qEV columns provided the highest number of particles per µg of protein, it is unlikely this is happening to any large degree due to the relatively “gentle” nature of this isolation method. To further support this, Western blot analysis demonstrated that qEV and density gradient fractions were enriched for exosomal markers, and to a lesser degree Exo-spin™, whereas ExoQuick™-based isolations demonstrated lower enrichment of exosomal markers (e). A key message from these data is that protein concentration is not a good measure of exosome yield, and though common organelle markers such as Calnexin are used to assess purity of exosomes they are insufficient to indicate that isolation techniques are devoid of contaminates.
The utility of all exosome isolation methods are dependent on their performance when applied to human clinical samples, particularly when the focus of exosomes as novel biomarkers is being considered. Modern precipitation protocols have been purported as alternative methods to ultracentrifugation because they require very little starting sample from human biofluids combined with high-throughput options. Isolating exosomes from plasma is further complicated due to viscosity and density issues (Citation5, Citation22), thereby limiting the purity obtained from ultracentrifugation protocols. Recently, a single-step SEC isolation of exosomes from human plasma has been described (Citation23). Using a similar approach, we find similar results in the efficiency of qEV SEC columns to separate exosome vesicles from contaminating plasma proteins. SEC, however, does not concentrate samples and therefore requires a second step. Instead of pelleting exosomes with an ultracentrifugation step, we used protein concentrating devices to rapidly concentrate exosomal fractions. This provides an efficient means of isolating and concentrating exosomes from human plasma, while avoiding ultracentrifugation (). SEC purification using qEV columns significantly outperformed both precipitation protocols when the particle protein ratio was considered (). This is also supported by analysis of Flotillin-1. Flotillin-1 could not be detected in both precipitation protocols but was present in the SEC isolation samples. Furthermore, the purity of exosome isolations is important and can be classified through a number of methods, including the presence of contaminating extracellular proteins (Citation24). Though no contaminating extracellular protein is shown in the in vitro precipitation isolations, d demonstrates the high abundance of contaminating albumin with the precipitation methods from human plasma compared to qEV columns. This furthers the assumption that precipitation protocols are prone to heavy contamination with plasma proteins and are therefore limited in their utility for proteomic analysis of exosomes from human plasma.
Isolation techniques that have been well characterized are crucial for the analysis of exosomes as biomarkers. In conclusion, we have investigated the influence of repeated ultracentrifugation of CCM on the integrity of exosomes and found that it is detrimental to achieve the highest recovery of particles. Modern ultrafiltration devices provide a more rapid and overall higher yield of exosomes when compared to ultracentrifugation. The steps of differential centrifugation also have an impact on the input before density gradient purification (Citation19, Citation25), a problem that may bias subsequent analysis that ultrafiltration avoids. Therefore, adoption of concentrating protocols will provide improved analysis of exosomes. We show that ultrafiltration coupled with SEC is a method that provides particle purity comparable to density gradient purification and is applicable to isolating a high yield of exosomes from CCM and human plasma in an efficient time frame. These data should inform the community in developing optimal techniques for exosome extraction and research.
Conflict of interest and funding
The authors declare no conflict of interest. This work was supported by a National Health and Medical Research Council project grant (APP106851), Cancer Council Queensland grant (APP1045260), a RTRTCC grant (6156) and National Breast Cancer Foundation Australia fellowship and grant (ECF-11-09; NC-13-26) to AM.
Supplementary Figure 1
Download PDF (67 KB)Supplementary Figure 2
Download PDF (10.7 KB)Supplementary Figure 3
Download PDF (44.5 KB)Supplementary Figure 4
Download PDF (35.5 KB)Supplementary Figure 5
Download PDF (95.6 KB)Supplementary Figure 6
Download PDF (287.9 KB)Acknowledgements
The authors thank all Tumour Microenvironment Laboratory members for critical advice and proof-reading of the manuscript. We thank Sarah Ellis for her assistance with the electron microscopy.
Related Research Data
References
- Vlassov AV, Magdaleno S, Setterquist R, Conrad R. Exosomes: current knowledge of their composition, biological functions, and diagnostic and therapeutic potentials. Biochim Biophys Acta. 2012; 1820: 940–8.
- Wendler F, Bota-Rabassedas N, Franch-Marro X. Cancer becomes wasteful: emerging roles of exosomes(dagger) in cell-fate determination. J Extracell Vesicles. 2013; 2: 22390. http://dx.doi.org/10.3402/jev.v2i0.22390.
- EL Andaloussi S, Mager I, Breakefield XO, Wood MJ. Extracellular vesicles: biology and emerging therapeutic opportunities. Nat Rev Drug Discov. 2013; 12: 347–57.
- Thery C, Ostrowski M, Segura E. Membrane vesicles as conveyors of immune responses. Nat Rev Immunol. 2009; 9: 581–93.
- Thery C, Amigorena S, Raposo G, Clayton A. Isolation and characterization of exosomes from cell culture supernatants and biological fluids. Curr Protoc Cell Biol. 2006. Chapter 3:Unit 3.22.
- Van Deun J, Mestdagh P, Sormunen R, Cocquyt V, Vermaelen K, Vandesompele Jet al. The impact of disparate isolation methods for extracellular vesicles on downstream RNA profiling. J Extracell Vesicles. 2014; 3: 24858. http://dx.doi.org/10.3402/jev.v3.24858.
- Lamparski HG, Metha-Damani A, Yao JY, Patel S, Hsu DH, Ruegg C et al. Production and characterization of clinical grade exosomes derived from dendritic cells. J Immunol Methods. 2002; 270: 211–26.
- Raposo G, Stoorvogel W. Extracellular vesicles: exosomes, microvesicles, and friends. J Cell Biol. 2013; 200: 373–83.
- Mathivanan S, Fahner CJ, Reid GE, Simpson RJ. ExoCarta 2012: database of exosomal proteins, RNA and lipids. Nucleic Acids Res. 2012; 40(Database issue): 1241–4.
- Simpson RJ, Kalra H, Mathivanan S. ExoCarta as a resource for exosomal research. J Extracell Vesicles. 2012; 1: 18374. http://dx.doi.org/10.3402/jev.v1i0.18374.
- Thery C, Boussac M, Veron P, Ricciardi-Castagnoli P, Raposo G, Garin J et al. Proteomic analysis of dendritic cell-derived exosomes: a secreted subcellular compartment distinct from apoptotic vesicles. J Immunol. 2001; 166: 7309–18.
- Webber J, Clayton A. How pure are your vesicles?. J Extracell Vesicles. 2013; 2: 19861. http://dx.doi.org/10.3402/jev.v2i0.19861.
- Kalra H, Adda CG, Liem M, Ang CS, Mechler A, Simpson RJ et al. Comparative proteomics evaluation of plasma exosome isolation techniques and assessment of the stability of exosomes in normal human blood plasma. Proteomics. 2013; 13: 3354–64.
- Simpson RJ, Lim JW, Moritz RL, Mathivanan S. Exosomes: proteomic insights and diagnostic potential. Expert Rev Proteomics. 2009; 6: 267–83.
- Caby MP, Lankar D, Vincendeau-Scherrer C, Raposo G, Bonnerot C. Exosomal-like vesicles are present in human blood plasma. Int Immunol. 2005; 17: 879–87.
- Witwer KW, Buzas EI, Bemis LT, Bora A, Lasser C, Lotvall Jet al. Standardization of sample collection, isolation and analysis methods in extracellular vesicle research. J Extracell Vesicles. 2013; 2: 20360. http://dx.doi.org/10.3402/jev.v2i0.20360.
- Lai RC, Chen TS, Lim SK. Mesenchymal stem cell exosome: a novel stem cell-based therapy for cardiovascular disease. Regen Med. 2011; 6: 481–92.
- Gould SJ, Raposo G. As we wait: coping with an imperfect nomenclature for extracellular vesicles. J Extracell Vesicles. 2013; 2: 20389. http://dx.doi.org/10.3402/jev.v2i0.20389.
- Cvjetkovic A, Lotvall J, Lasser C. The influence of rotor type and centrifugation time on the yield and purity of extracellular vesicles. J Extracell Vesicles. 2014; 3: 23111. http://dx.doi.org/10.3402/jev.v3.23111.
- Tauro BJ, Greening DW, Mathias RA, Ji H, Mathivanan S, Scott AM et al. Comparison of ultracentrifugation, density gradient separation, and immunoaffinity capture methods for isolating human colon cancer cell line LIM1863-derived exosomes. Methods. 56; 2012: 293–304.
- Bobrie A, Colombo M, Krumeich S, Raposo G, Thery C. Diverse subpopulations of vesicles secreted by different intracellular mechanisms are present in exosome preparations obtained by differential ultracentrifugation. J Extracell Vesicles. 2012; 1: 18397. http://dx.doi.org/10.3402/jev.v1i0.18397.
- Momen-Heravi F, Balaj L, Alian S, Trachtenberg AJ, Hochberg FH, Skog J et al. Impact of biofluid viscosity on size and sedimentation efficiency of the isolated microvesicles. Front Physiol. 2012; 3: 162.
- Boing AN, van der Pol E, Grootemaat AE, Coumans FA, Sturk A, Nieuwland R. Single-step isolation of extracellular vesicles by size-exclusion chromatography. J Extracell Vesicles. 2014; 3: 23430. http://dx.doi.org/10.3402/jev.v3.23430.
- Lotvall J, Hill AF, Hochberg F, Buzas EI, Di Vizio D, Gardiner Cet al. Minimal experimental requirements for definition of extracellular vesicles and their functions: a position statement from the International Society for Extracellular Vesicles. J Extracell Vesicles. 2014; 3: 26913. http://dx.doi.org/10.3402/jev.v3.26913.
- Jeppesen DK, Hvam ML, Primdahl-Bengtson B, Boysen AT, Whitehead B, Dyrskjot Let al. Comparative analysis of discrete exosome fractions obtained by differential centrifugation. J Extracell Vesicles. 2014; 3: 25011. http://dx.doi.org/10.3402/jev.v3.25011.