
Abstract
Proteomic studies of circulating vesicles are hampered by difficulties in purifying vesicles from plasma and serum. Isolations are contaminated with high-abundance blood proteins that may mask genuine vesicular-associated proteins and/or simply provide misleading data. In this brief report, we explored the potential utility of a commercially available size exclusion chromatography column for rapid vesicle purification. We evaluated the performance of the column, with cancer cell line conditioned medium or healthy donor plasma, in terms of removing non-vesicular protein and enriching for vesicles exhibiting exosome characteristics. Serial fractions revealed a peak for typical exosomal proteins (CD9, CD81 etc.) that preceded the peak for highly abundant proteins, including albumin, for either sample type, and harvesting only this peak would represent elimination of >95% of protein from the sample. The columns showed good reproducibility, and streamlining the workflow would allow the exosome-relevant material to be collected in less than 10 minutes. Surprisingly, however, subsequent post-column vesicle concentration steps whilst resulting in some protein loss also lead to low vesicle recoveries, with a net effect of reducing sample purity (assessed by the particle-to-protein ratio). The columns provide a convenient, reproducible and highly effective means of eliminating >95% of non-vesicular protein from biological fluid samples such as plasma.
To access the supplementary material to this article, please see Supplementary files under ‘Article Tools’.
Arecent report by Böing and colleagues (Citation1) detailed the value of a simple size exclusion chromatographic approach for the separation of vesicles present in platelet-depleted plasma from non-vesicular blood proteins. Although these authors acknowledge that their method is not the first description of this approach for vesicle isolation (Citation2) or as part of a vesicle isolation workflow (Citation3), the manuscript has nicely detailed some of the advantages of a chromatographic method compared to other approaches such as ultracentrifugation. This one-step method involves a “homemade” Sepharose CL-2B column and the collection of serial fractions, following the addition of platelet-free supernatant, from platelet concentrates. Early along the fraction series, vesicles (and vesicularly associated markers such as CD63) appear to precede fractions containing the bulk of the blood proteins. Hence, this could provide a very effective approach for simplifying the complexity of vesicle preparations that would thereafter undergo detailed “omics” analyses.
Handling tens or hundreds of clinical specimens through this system, however, is somewhat time-consuming and cumbersome, with potential for great variation in the performance of the method due to pouring “homemade” columns. We have in this report therefore examined the potential utility of commercially available, ready-made columns based on a proprietary separation medium for this application. Specifically, we tested the columns developed by Cell Guidance Systems (CellGS; Cambridge, UK), termed Exo-Spin™ Midi Columns, for their efficacy in vesicle purification from a cell culture source or from healthy donor plasma. By analysing the column eluent for molecular markers of vesicles, and by using our previously described approach of quantifying the particle-to-protein ratio (based on nanoparticle tracking) as we previously described (Citation4), we explored the efficacy of this approach for vesicle purification.
In summary, the CellGS columns appear as effective as the sepharose column approach, in eliminating the vast majority of protein such as albumin from the specimen, but they offer a vastly more convenient means of doing so compared to self-made columns. The workflow can be simplified, and by careful selection of elution volumes, vesicles can be recovered in the second wash step within 10 minutes. Due to consistent manufacturing, these columns should aid in reducing variance in future clinical studies that rely on this approach for sample cleanup, and they can accelerate the sample preparation process dramatically compared to other approaches. However, attempts to subsequently concentrate and further enrich for vesicles, such as the use of precipitants or ultracentrifugation, require careful attention as these steps give surprisingly poor recoveries and result in a greater loss of vesicles compared to protein contaminants negatively impacting vesicle purity.
Materials and methods
Cell culture
A prostate cancer cell line (Du145; purchased from ATCC, LGC Standards, Middlesex, UK) was maintained in bioreactor flasks (Integra, Nottingham, UK), as we previously described (Citation5), and cell-conditioned medium harvested after 7 days of culturing. This was centrifuged to remove cells and debris (400×g for 10 minutes and 2,000×g for 15 minutes, respectively), and filtered through a 0.22 µm filter (Millipore, Hertfordshire, UK). Samples were stored at −80°C until needed. A volume of 1 ml of defrosted cell-conditioned medium was used for each chromatographic column.
Preparation of plasma
Fresh venous blood was collected into vacuette K3 EDTA tubes (Greiner Bio-One Ltd., Stonehouse, UK), and centrifuged at 400×g for 7 minutes at 20°C to remove cells. The plasma layer was collected and centrifuged in high-recovery 2 ml tubes at 6,000×g for 10 minutes. The resulting platelet-free plasma was filtered through a 0.22 µm syringe filter (Millipore, Hertfordshire, UK), and 1.5 ml aliquots were stored at −80°C. Blood was collected from healthy, consented individuals, and ethical approval for this was obtained from the Cardiff University ethics committee.
Use of CellGS-Exo-Spin™ Midi Columns
Exo-Spin™ Midi Columns, provided by CellGS, were prepacked in a preservative-containing buffer. This buffer was removed, and the columns were washed twice with 10 ml of 1.8 mg/ml ethylenediaminetetraacetic acid (EDTA) in phosphate buffered saline (PBS) (0.1 µm filtered). Plasma (up to 1.5 ml) or cell-conditioned medium (1 ml), freshly defrosted at room temperature, was added to the column prior to elution with EDTA–PBS buffer, and up to 30 separate 500 µl fractions were collected.
Analysis of column fractions by immunostaining
Immunostaining was performed as we described (Citation6). Briefly, 50 µl of each fraction was diluted 1:1 with PBS and then added to high-binding enzyme-linked immunosorbent assay (ELISA) strips (Greiner Bio-One Ltd). After an overnight incubation at 4°C, the plates were washed 3× in Delphia wash buffer (PerkinElmer, Cambridge, UK) using an automated washer (Fisher Scientific UK Ltd., Leicestershire, UK), and blocked for 2 hours at room temperature using 1% bovine serum albumin (BSA) in PBS. Plates were then washed as above, and primary antibodies added at 1 µg/ml, except for anti-HSA (human serum albumin) which was used at a lower concentration of 0.2 µg/ml. These included anti-CD9, HSA, Apo-B (R&D Systems, Abingdon, UK), CD81, CD63 (AbD Serotec, Bio-Rad Laboratories Inc., Kidlington, UK), CD31 (Santa Cruz Biotechnology, Santa Cruz, CA, USA), MHC Class-I and isotype controls (eBioscience, Hatfield, UK). After 2 hours at room temperature, the strips were washed, and goat anti-mouse IgG–biotin conjugated antibody was added (1:2,500; PerkinElmer) and incubated for an hour. After another wash, a streptavidin–Europium conjugate was added (1:1,000; PerkinElmer) in Delphia assay buffer (PerkinElmer) and incubated for 40–60 minutes. The strips were washed 6× prior to addition of enhancement solution (PerkinElmer), and time-resolved fluorimetry (TRF) was performed on a Wallac Victor2 multi-label plate reader (PerkinElmer).
Western blotting
An equal volume of selected fractions was boiled in SDS-containing sample buffer (Life Technologies, Paisley, UK) with 20 mM dithiothreitol (DTT). Samples were subject to electrophoresis on NuPAGE precast 4–20% gradient gels (Life Technologies), and transferred to polyvinylidene difluoride (PVDF) membranes. After blocking in PBS containing 0.5% (w/v) Tween-20 and 3% (w/v) non-fat powdered milk, anti-TSG101 antibody at 1 μg/ml was added with gentle rolling overnight. After washing, goat anti-mouse horseradish peroxidase (HRP) conjugate was added (1:15,000 dilution; Santa Cruz) for 1 hour, and bands were detected using X-ray film (GE Healthcare, Buckinghamshire, UK) and chemiluminescence reagent (Super Signal West Pico, Pierce/Thermo).
Protein assay by microBCA or NanoDrop™
Aliquots from column fractions (20 µl needed for duplicate measurements) were used for protein assessment by microBCA assay (Thermo Scientific., Northumberland, UK), as we described (Citation4), or by NanoDrop™ (Thermo Scientific) – measuring absorbance at 280 nm, where only 1 µl was needed per replicate. For some experiments, both assays were performed on the same sample sets for comparison. For plasma-derived material, given the broad dynamic range of the NanoDrop™ instrument, this was the preferred choice for estimating protein without consuming a great deal of the sample.
Nanoparticle tracking analysis (by NanoSight™)
Column fractions were diluted in particle-free water (Fresenius Kabi, Runcorn, UK) to concentrations up to 2×10⁹ particles/ml. For cell culture material, this was typically around 1:1,000 dilution for fractions containing the majority of particles. For plasma, the same fractions were diluted ~1:10,000. In fractions with barely detectable particle numbers, a minimum dilution of 1:100 was performed. Analysis was performed on a NanoSight™ LM10 system as previously described (Citation4), but configured with a temperature-controlled LM14 laser module with a 488 nm laser and a high-sensitivity scientific complementary metal–oxide semiconductor (sCMOS) camera system (OrcaFlash2.8, No. C11440, Hamamatsu Photonics, Hamamatsu City, Japan) and a syringe–pump system (Malvern Instruments, Malvern, UK). Three videos of 30 s were taken under controlled fluid flow with a pump speed set to 80. Videos were analysed using the batch analysis tool of NTA 2.3 software, where minimum particle size, track length and blur were set at “automatic.” The camera gain was wet at 500 with a variable shutter length at 25 frames per second. The area under the histogram for each triplicate measurement was averaged, and these are the presented data.
Results
Fractionation of cell-conditioned medium using the CellGS 10 ml columns
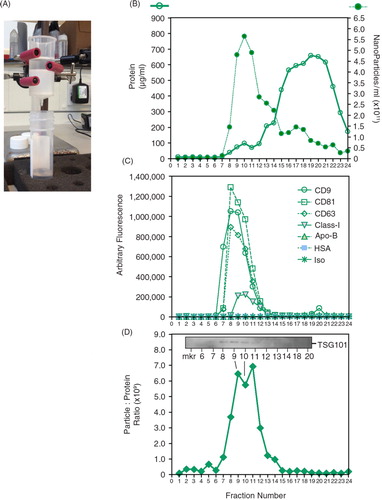
The column under investigation is shown (A), and it constitutes a proprietary resin bed of approximately 10 ml volume within a plastic column. The column was pre-washed twice in 10 ml PBS before the addition of 1 ml of cell-conditioned medium. This was derived from a bioreactor flask (Integra) containing Du145 prostate cancer cells, and this medium was pre-cleared by centrifugation (400×g for 10 minutes, followed by 2,000×g for 15 minutes) and filtration through a 0.22 µm filter. We collected 24 fractions of 500 µl into 1.5 ml Eppendorf-style tubes, taking approximately 25 minutes to complete. A proportion of each fraction was assayed for protein (using the microBCA assay or, where specified, by absorbance at 280 nm using the NanoDrop device), and a proportion was assessed by nanoparticle tracking analysis using the NanoSight platform as we described (Citation4) (B). This revealed a small protein hump at around fractions 8–12 (B, open circles), which escalated thereafter. This hump coincided with the peak for nanoparticles (B, closed circles); however, this latter peak had a broad spread of measureable but decreasing particulate from fractions 13 to 24 (B). A proportion of each fraction was directly coupled to protein-binding ELISA plates and stained for a number of markers. This revealed a strong signal at fractions 7–12 for the tetraspanins CD9, CD81 and CD63, and a weaker signal for MHC Class-I. Signals for Apo-B and HSA and isotype control antibody were negligible (C). Plotting the particle-to-protein ratio revealed alignment with fractions staining positively for the exosome markers, with a principal peak at fractions 7–13. Western blotting for TSG101 revealed bands, albeit weak ones, within this fraction range (D). The uncropped image is depicted in Supplementary Fig. 1. From these data, exosomal markers and the particle–protein ratio coincide in the same fractions, and collecting only these fractions (F7–13) would result in the removal of around 95% of the protein from the sample. There appeared, however, to be nanoparticulate material that was present in fractions that test negative for exosome markers, which accounted for one-third of the particles in the sample. In the control experiment, such particles were not present in column eluates containing no specimen, and hence were not particles leaching from the column resin (not shown). We do not know the origin or nature of these particles, but as they exhibit a chromatographic mobility that is distinct from that of the exosome markers, we suggest these are non-exosomal particles that are present in the culture medium.
Fig. 1. Characterizing a column-based separation of vesicles in cell culture–derived medium. (A) A commercially obtained chromatography column (Cell Guidance Systems, Cambridge, UK) was loaded with 1 ml pre-cleared cell-conditioned medium, and washed with PBS. (B) A total of 24 fractions of 500 µl were collected. An aliquot of 5 µl was used to determine nanoparticle concentration (by NanoSight™), and 20 µl was used for the microBCA protein assay. (C) Equal volumes (50 µl) from each fraction were also immobilized onto high-protein-binding ELISA plates overnight, and after blocking they were stained with antibodies against CD9, CD81, CD63, MHC Class-I, Apo-B, HSA or an isotype control, as depicted. (D) From the protein and NanoSight™ data, the particle-to-protein ratio was calculated. (D, inset) The Western blot panel (inset) was performed using 15 µl of selected fractions and shows weak but visible bands for TSG101.
Reproducibility of column fractionation
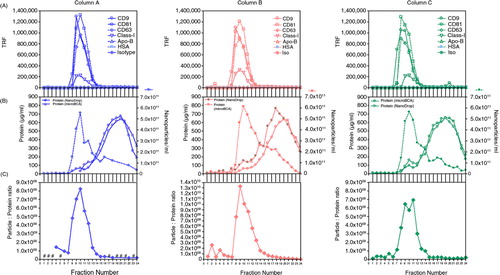
The above column () was performed in parallel with an additional 2 columns using the same input sample on the same occasion. The full set of assays were performed (with the exception of Western blot) in order to evaluate the reproducibility of the system. In certain circumstances, quick protein estimation without consuming a lot of sample is advantageous, especially with scant clinical samples; we therefore examined the utility of NanoDrop™ for protein estimation across these specimens, comparing this with the standard microBCA approach. The full dataset for the 3 columns are shown (), revealing very similar data across all columns, with good agreement between the NanoDrop™ and microBCA protein assays. One of the 3 columns ran with a faster flow rate compared to the others, but this was not obvious from the data. This column (column A) had a slight impact on the position of the peak for CD9 and CD81, being earlier by one fraction for example. This was a minor concern, however, as the performance in terms of protein removal away from the vesicle-relevant fractions was equally good at 94.9, 95.4 and 93.6% for columns A, B and C, respectively.
Fig. 2. Evaluating the reproducibility of column separation. Three columns were run in parallel with the same culture medium sample, and the assorted assays performed for each column fraction series include immunostaining for exosome markers (A), nanoparticles (measured by NanoSight™) and protein assessment (measured by both microBCA assay and NanoDrop™; absorbance at 280nm) (B) and particle-to-protein ratio (C), revealing in each case comparable performance across the 3 columns tested. #denotes fractions where NTA was not performed.
Column fractionation of healthy donor plasma
We next evaluated the ability of the column to handle plasma specimens, with the expectation that vesicles would elute at an elution volume comparable to that when using cell culture medium as a sample. The plasma was pre-cleared of debris by centrifugation at 6,000× g for 10 minutes and a filtration step (0.22 µm) before loading 1.5 ml onto a pre-washed column. To inhibit coagulation, 1.8 mg/ml EDTA was added to PBS as the mobile phase. As for the aforementioned cell culture sample, collected fractions of 500 µl volume were used for multiple readouts, but we collected 30 fractions and not 24 when handling plasma.
When measuring protein and nanoparticles (A), there was a peak of nanoparticles (at fraction 8–15) preceding the major protein peak, but nanoparticles continued well into the fractions containing high protein. Staining for CD9 showed good separation from the total protein peak, and taking only fractions 7–13 would represent a removal of 96% of the protein from the sample (B). The separation of CD9 from albumin (HSA), one of the most problematic contaminants in blood-derived samples representing over 50% of blood protein, was more apparent (C). Although this appears very effective at separating HSA from CD9, the signal strength for HSA was very high, and there remains some positive signal for HSA under the CD9 peak, which indicates incomplete HSA removal. Nevertheless, collecting fractions 7–13 would represent an albumin removal of >99%. From the nanoparticle analysis data, it appears that ~75% of nanoparticles in plasma elute outside the exosome-containing fractions (F7–13) in a similar but more extreme manner as reported above for cell culture sources. Calculating the particle-to-protein ratio here was also informative and clearly focussed the fractions of greatest exosomal purity, encompassing fractions 7–13 (D), agreeing with the elution profile of cell culture–derived exosomes ( and ).
Fig. 3. Characterizing column-based separation of vesicles in plasma. A chromatography column was loaded with 1.5 ml pre-cleared plasma, and washed with PBS–EDTA, and a total of 30,500 µl fractions was collected. The concentration of nanoparticles and protein (by NanoDrop™) was assessed (A), and the fractions were stained for CD9 (B) or human serum albumin (HSA) (C). The particle-to-protein ratio measurements are shown in (D); for fractions 1–7, where proteins were below detection limits, this ratio could not be calculated.
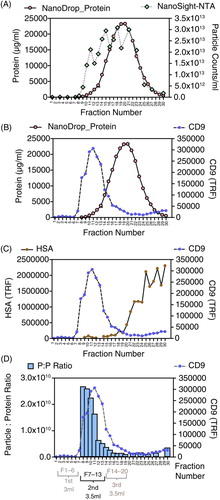
To confirm these findings, and to evaluate the presence of other exosomal markers in the relevant fractions, another column was tested (on another occasion with a different donor), staining for CD9, CD81, the lipoprotein marker Apo-B and an isotype control. These data highlight that the proteins do indeed coincide at fractions 7–13. There was no evidence, however, for the separation of the Apo-B signal from the tetraspanin signal, indicating we have co-isolated lipoproteins and exosomes in these fractions, or that this marker is unable to discriminate one type of vesicle from another. Nanoparticles were also assessed in this experiment, showing a broad distribution across the fraction series with the majority of the particles in fractions that do not stain well for tetraspanins (Supplementary Fig. 2). As an analytical tool in its own right, therefore, the column method is capable of giving new insight into the nature of particulate material within specimens, and it indicates that >70% of nanoparticles in plasma are not exosome vesicles as their chromatographic mobility is distinct and they lack tetraspanins.
A streamlined protocol for column-based vesicle enrichment
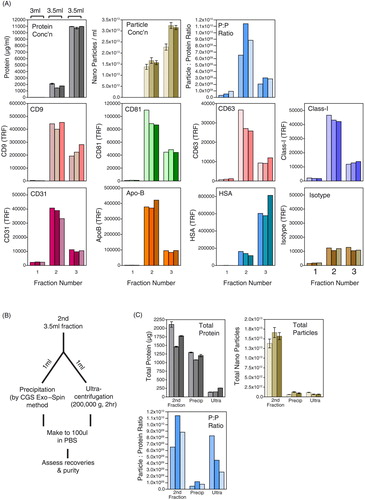
Because collection of multiple fractions is impractically laborious for a clinical study, we attempted to simplify the column protocol based on the above data. For CD9-positive fractions that did not encroach particularly into the total protein peak, we identified fractions 7–13 as being of greatest interest. Whilst taking later fractions (e.g. f14, 15 and 16) may maximally include the tetraspanin peak, these would also, however, contain significant amounts of protein and would serve ultimately to generate less pure specimens. We therefore repeated the experiment in a simpler fashion, using plasma from the same donor as in , but collecting only 3 fractions of 3, 3.5 and 3.5 ml volumes, respectively. This was performed with 3 columns in parallel to assess reproducibility.
The level of protein in these 3 fractions increased serially as expected, with around 7-fold lower protein in fraction 2 compared with fraction 3 (A, grey bars). The nanoparticle levels were also somewhat higher in fraction 3 (A, brown bars), and this would be consistent with the aforementioned observations of a broad particle distribution across the later column eluate, as we saw in . Calculating the particle-to-protein ratio identified fraction 2 as superior to the others in terms of vesicle purity (C, blue bars). Furthermore, when staining for exosome markers the strongest staining for CD9, CD81, CD63, MHC Class-I, Apo-B and the endothelial cell marker CD31 was seen in fraction 2. In contrast, 3- to 4-fold higher levels of HSA were found in fraction 3. Collectively, these data point towards a successful focussing of exosomal material of relatively high purity in the second elution wash. This is something that can be achieved in around 10 minutes.
Fig. 4. Simplifying and concentrating column-based separation of vesicles in plasma. A chromatography column was loaded with 1 ml pre-cleared plasma and washed with PBS–EDTA, and 3 large-volume fractions were collected: fraction-1 (3 ml), fraction-2 (3.5 ml) and fraction-3 (3.5 ml). Protein (by NanoDrop™; grey bars), nanoparticles (NanoSight; brown bars) and the particle-to-protein ratio (blue bars) are shown. Immunostaining for a range of specified markers was also performed (A). Fraction-2, which putatively contained the purest vesicles, was split into equal aliquots of 1 ml and concentrated by chemical precipitation or by high-speed ultracentrifugation as depicted (B). The pellets were collected, and recoveries in terms of protein, particles and purity (particle-to-protein ratio) were compared to the pre-concentration step (C).
Concentrating vesicles following column-based purification
Because the aforementioned fraction-2 (A) is of high volume (3.5 ml), a concentration step is likely to be required for further downstream applications. We therefore compared a chemical precipitation method to the use of ultracentrifugation to determine the most effective approach.
An equal volume (1 ml) was concentrated by ultracentrifugation or by a precipitation method (CellGS Exosome precipitant, from the Exo-Spin kit) for each of the 3 columns tested. The precipitation approach according to the CellGS protocol is better preformed before the columns’ cleanup step. Here, however, we did not use the established method but instead performed precipitation following the pooling of selected column fractions. This involves adding a proprietary precipitant (250 µl for each 500 µl of sample), and after 5 minutes the specimens are centrifuged for 30 minutes at 20,000×g. For the ultracentrifugation approach, 1 ml of column eluate was made (up to 4.8 ml in PBS) and centrifuged at 200,000×g for 2 hours. The workflow is depicted (B). The precipitation method gave large brown pellets that were difficult to fully resuspend, resulting in some degree of aggregated material present in the 100 µl final volume. In contrast, ultracentrifugation gave small, barely visible pellets that resuspended readily.
By measuring the total recovered protein, precipitation gave a 69% recovery (average of 3 columns), whilst in contrast ultracentrifugation showed only a 9.6% protein recovery (C). This may be due to the limited selectivity of precipitation methods for vesicles, and also partly due to the greater wash volume employed in the ultracentrifugation method. Examining particle recovery, however, revealed surprising inefficiency with either method, giving 6% vs. 5% recovery with precipitation or ultracentrifugation, respectively. Because the precipitation approach held onto more protein, this resulted in a stark drop in the particle–protein ratio. Unfortunately, however, the advantages of washing away protein by ultracentrifugation were lost due to poor recovery of particles, and again the particle–protein ratio was reduced by these additional handling steps. This experiment was repeated in a similar fashion on another occasion with a different donor, with some slight differences in input volumes and spinning times; but essentially it gave a similar result, with very poor particle recovery and a decreased overall purity as a result of either concentration strategy (Supplementary Fig. 3).
Discussion
There remains considerable interest in the utility of vesicles as a complex set of disease markers in cancer and in other settings. The proteomic assessment of extracellular vesicles in general is an aspect that has developed considerably for over a decade (Citation7), but it has been hampered by difficulties in obtaining pure vesicles from patient-derived blood or other biofluid specimens (Citation8). Approaches, including ultracentrifugation through gradients, provide an opportunity for eliminating much of the non-vesicular material in the sample (Citation8), but these methods are difficult to perform well, and they are certainly too slow and cumbersome to be a valid workflow for a large set of clinical specimens. A quicker sucrose cushion-based method, working on the same principle of isolating vesicles based on their density characteristics, also remains somewhat impractical in a translational patient-monitoring scenario, as we previously discussed (Citation9).
Column chromatographic approaches offer a much simpler and potentially quicker method for vesicle enrichment, as recently highlighted by Böing et al. (Citation1). However, pouring homemade columns can itself generate problems, such as variations from column to column, and the time needed to allow columns to settle without the formation of bubbles. These can be a little unpredictable and therefore frustrating, and they are difficult for busy researchers to robustly quality control.
The ability to purchase quality-assured, pre-made columns offers the advantages of convenience and, importantly, also of potentially reducing variation from column to column, and this was the subject of this current report. The tested columns demonstrate good utility as a simple and rapid tool for removing greater than 95% of blood proteins in a single step. We are aware that, for some downstream applications, the selected vesicle-rich, protein-low fractions will still contain measurable levels of albumin for example, and without further processing these may remain poorly suited to direct mass spectrometric analyses. Nevertheless, the capability to achieve this degree of protein elimination so quickly presents an extremely useful solution to this difficult problem. The rather arduous workflow of collecting multiple column fractions can be simplified to collecting only the eluate of interest (the second 3–3.5 ml), and this can be achieved in around 10–15 minutes, which makes this a viable method in the context of multiple clinical samples.
Our study has also emphasized, however, some issues to consider. Firstly, the column has provided an analytical tool revealing the abundance of particulate material that is consistent with the hydrodynamic diameter of extracellular vesicles like exosomes, yet remain clearly distinct from exosome vesicles as they lack the typical tetraspanin markers and exhibit a slower mobility through the column. We estimate this to account for ~70% of the nanoparticles in plasma detectable by the NanoSight™ platform. The observation certainly warns us to be cautious when inferring that particle data are equal to vesicle data when analysing biofluids.
Secondly, the ability of this simple column chromatography approach to separate exosome vesicles from other particulate components of blood such as lipoproteins is uncertain. The signal for Apo-B was very strong and coincided with tetraspanin signals, suggesting co-elution of lipoproteins with exosomes. The Sepharose CL-2B column approach is reported to generate an exosome peak and thereafter a second cholesterol-rich peak that would be consistent perhaps with lipoprotein separation from exosomes (Citation1). However, we did not see a second Apo-B peak following elution of tetraspanin proteins. Many proteomic studies of cell culture–derived exosomes do report the presence of the Apo family of proteins in association with exosomes purified by various means (Citation10), and hence our choice of Apo-B as a potential lipoprotein marker may be incapable of discriminating exosomes from lipoproteins as we had hoped. Given these issues, we are therefore cautious about the utility of straightforward chromatography of this nature for separating lipoproteins from exosomes.
Lastly, and rather surprisingly, the column has raised some technical issues about how we should concentrate and recover vesicles from the column eluate. Clearly, what is needed is a rapid and simple approach that is efficient, and ideally selective for vesicles relative to the remaining protein contaminants. A precipitation approach here may be highly attractive, assuming the method does not interfere with downstream analysis (e.g. the use of polyethylene glycol precipitants for mass spectrometric analyses). The CellGS precipitation method was very rapid and convenient and gave good (60%) recovery of protein, but there was a loss of over 94% of the nanoparticles following concentration. We acknowledge this was performed counter to the established protocol from CellGS, which recommends precipitation followed by a column-based cleanup. However, we performed this experiment differently in order to examine the utility of the column on its own as a cleanup approach, and precipitation as a modality to concentrate column fractions. Other precipitant formulations may be better suited to post-column concentration, but these remain untested currently. In contrast, ultracentrifugation was a much slower process which led to only ~10% protein recovery, but again 95% of particles were lost. The net effect was a higher purity of preparation using ultracentrifugation methods, as we expected. However, as there was greater loss in particles relative to protein with either method, this led to a negative impact on purity assessed by the particle–protein ratio. Whilst the column method is successful in significant cleanup of blood proteins, some optimizations are certainly still required to concentrate selectively, and to minimize vesicle losses during subsequent handling steps.
Conclusions
To summarize, this commercially available column provides a versatile analytical and preparative tool for the study of extracellular vesicles from highly complex biological specimens such as plasma, eliminating >95% of protein in a single 10-min protocol. Such columns are likely to facilitate future studies involving clinical-derived material in biomarker discovery, disease monitoring and potentially other important applications.
Conflict of interest and funding
MJ and LB are employees of Cell Guidance Systems, Cambridge, UK. The authors (JW, JPW and AC) have not received any funding benefits from CellGS other than the supply of the columns to test.
Acknowledgements
The Cardiff Exosome group is funded by a Programme Grant awarded from Cancer Research Wales (AC), by Prostate Cancer-UK (AC & JPW), by Movember (GAP-1) (AC) and by the MS Society (JLW).
Notes
To access the supplementary material to this article, please see Supplementary files under ‘Article Tools’.
References
- Böing AN, van der Pol E, Grootemaat AE, Coumans FAW, Sturk A, Nieuwland R. Single-step isolation of extracellular vesicles by size-exclusion chromatography. J Extracell Vesicles. 2014; 3: 23430. doi: http://dx.doi.org/10.3402/jev.v2i0.23430.
- Taylor DD, Chou I-N, Black PH. Isolation of plasma membrane fragments from cultured murine melanoma cells. Biochem Biophys Res Commun. 1983; 113: 470–6. [PubMed Abstract].
- Muller L, Hong C-S, Stolz DB, Watkins SC, Whiteside TL. Isolation of biologically-active exosomes from human plasma. J Immunol Methods. 2014; 411: 55–65. [PubMed Abstract].
- Webber J, Clayton A. How pure are your vesicles?. J Extracell Vesicles. 2013; 2: 19861. doi: http://dx.doi.org/10.3402/jev.v2i0.19861.
- Mitchell JP, Court J, Mason MD, Tabi Z, Clayton A. Increased exosome production from tumour cell cultures using the Integra CELLine Culture System. J Immunol Methods. 2008; 335: 98–105. [PubMed Abstract].
- Webber J, Stone TC, Katilius E, Smith BC, Gordon B, Mason MD et al. Proteomics analysis of cancer exosomes using a novel modified aptamer-based array (SOMAscan™) platform. Mol Cell Proteomics. 2014; 13: 1050–64. [PubMed Abstract] [PubMed CentralFull Text].
- Simpson RJ, Lim JW, Moritz RL, Mathivanan S. Exosomes: proteomic insights and diagnostic potential. Exp Rev Proteomics. 2009; 6: 267–83.
- Kalra H, Adda CG, Liem M, Ang C-S, Mechler A, Simpson RJ et al. Comparative proteomics evaluation of plasma exosome isolation techniques and assessment of the stability of exosomes in normal human blood plasma. Proteomics. 2013; 13: 3354–64. [PubMed Abstract].
- Mitchell PJ, Welton J, Staffurth J, Court J, Mason MD, Tabi Z et al. Can urinary exosomes act as treatment response markers in prostate cancer?. J Transl Med. 2009; 7: 4. [PubMed Abstract] [PubMed CentralFull Text].
- Kalra H, Simpson RJ, Ji H, Aikawa E, Altevogt P, Askenase P. Vesiclepedia: a compendium for extracellular vesicles with continuous community annotation. PLoS Biol. 2012; 10: e1001450. [PubMed Abstract] [PubMed CentralFull Text].