
Abstract
Renal biopsy is the gold-standard procedure to diagnose most of renal pathologies. However, this invasive method is of limited repeatability and often describes an irreversible renal damage. Urine is an easily accessible fluid and urinary extracellular vesicles (EVs) may be ideal to describe new biomarkers associated with renal pathologies. Several methods to enrich EVs have been described. Most of them contain a mixture of proteins, lipoproteins and cell debris that may be masking relevant biomarkers. Here, we evaluated size-exclusion chromatography (SEC) as a suitable method to isolate urinary EVs. Following a conventional centrifugation to eliminate cell debris and apoptotic bodies, urine samples were concentrated using ultrafiltration and loaded on a SEC column. Collected fractions were analysed by protein content and flow cytometry to determine the presence of tetraspanin markers (CD63 and CD9). The highest tetraspanin content was routinely detected in fractions well before the bulk of proteins eluted. These tetraspanin-peak fractions were analysed by cryo-electron microscopy (cryo-EM) and nanoparticle tracking analysis revealing the presence of EVs.
When analysed by sodium dodecyl sulphate–polyacrylamide gel electrophoresis, tetraspanin-peak fractions from urine concentrated samples contained multiple bands but the main urine proteins (such as Tamm–Horsfall protein) were absent. Furthermore, a preliminary proteomic study of these fractions revealed the presence of EV-related proteins, suggesting their enrichment in concentrated samples. In addition, RNA profiling also showed the presence of vesicular small RNA species.
To summarize, our results demonstrated that concentrated urine followed by SEC is a suitable option to isolate EVs with low presence of soluble contaminants. This methodology could permit more accurate analyses of EV-related biomarkers when further characterized by -omics technologies compared with other approaches.
To access the supplementary material to this article, please see Supplementary files under ‘Article Tools’.
Renal biopsy is still the gold-standard method used for the diagnosis of most renal diseases. Yet, it is an invasive procedure of limited repeatability and often describes irreversible renal damage. In sharp contrast, urine would be an ideal body fluid for the monitoring of patients suffering from kidney and urinary tract diseases. Thus, efforts have been focused on the definition of new biomarkers in this biological fluid. In this sense, a number of studies have investigated the possibility of using the so-called urinary proteome and transcriptome for biomarker discovery (Citation1–Citation3). However, these studies are based on total urine samples, composed by a complex mixture of proteins, salts, metabolites and other debris from the body metabolism that could conceal important biomarkers of (early) renal damage. In addition, one of the most important drawbacks is the highly variable composition between samples of the same renal patient. This variability is not only due to the kidney metabolism but also due to the presence of proteins specifically filtered through the glomeruli, which ultimately depend on multiple factors such as serum concentration, tubular reabsorption and the glomerular filtration rate of a given patient, among others (Citation4).
Extracellular vesicles (EVs) are lipid bilayers mainly containing proteins, RNAs and metabolites (Citation5). They have been described in many body fluids, including urine (Citation6, Citation7). As shown in other biological fluids, urine contains a wide diversity of EVs, including ectosomes or shedding vesicles, also referred to as microvesicles, apoptotic bodies and exosomes (Citation7, Citation8). EVs from biological fluids such as urine are increasingly seen as a potential source of biomarkers given their non-invasiveness inherent advantages and their specific composition. Furthermore, as their content is protected from the aggressive external milieu by a membrane, the possibility to explore new biomarkers based on RNA species has boosted the interest in working with EVs. In fact, a number of studies have already demonstrated the feasibility of using urinary vesicles for biomarker purposes (Citation9–Citation11). As most of these studies were intended to define biomarkers in all urinary EVs, rather than in urinary exosomes, EV-enrichment protocols routinely omitted a sucrose-gradient ultracentrifugation (UC) step, which is considered the gold-standard method for isolation of exosomes, including those from urine samples (Citation12–Citation14). However, density-gradient UC also cleaned samples from other contaminants such as soluble proteins (Citation15), thus contributing to a better definition of the specific composition of EVs. Later, precipitating agents (including PEG and commercial reagents) provided a rapid method to enrich EVs from different biological fluids, including plasma and urine (Citation7, Citation16). However, these reagents also precipitate most of the contaminants found in UC pellets. Importantly, these procedures co-isolate contaminants that may be incorrectly identified as EV-related proteins or RNAs (Citation7). This is particularly relevant in urine, where major common components of the fluid such as the Tamm–Horsfall protein (THP), or other proteins (mainly albumin) increased in proteinuric samples, may interfere with urinary EVs-related biomarkers. In urine samples, specific pre-isolation techniques are recommended to reduce or eliminate the presence of THP before any EVs isolation/determination (Citation17–Citation19).
Size-exclusion chromatography (SEC) has been widely used to separate complex mixtures of molecules of different sizes. SEC has also been standardized in protocols to enrich EVs from plasma or serum samples (Citation20, Citation21), and it has been used after UC to isolate EVs from urine samples (Citation22, Citation23). In this study, our aim was to evaluate an UC-free SEC-based method for the isolation of EVs from urine samples. Our results show that SEC allowed the enrichment of EVs without the need of UC, and efficiently separated the total protein content from EV-contained proteins in a given sample. These EVs can be further used for proteomic and transcriptomic analysis, which would allow the identification of specific urinary EV-related biomarkers.
Materials and methods
Participants and ethical approval
Samples were obtained from healthy donor volunteers. The Ethical Committee of Germans Trias i Pujol Hospital approved the study, and all subjects gave their consent according to the Declaration of Helsinki (BMJ 1991; 302:1994).
Urine processing
First morning urine (100 mL) was collected from 8 healthy donors. Urine was centrifuged at 300g for 5 min to eliminate cells and debris and immediately frozen (−80°C) in the presence of the protease inhibitor AEBSF [4-(2-Aminoethyl) benzenesulfonyl fluoride hydrochloride] (0.138 mg/mL; Roche, Basel, Switzerland).
Urine samples were thawed overnight at 4°C and centrifuged at 17,000g for 10 min to pellet protein polymers and larger vesicles. Then, supernatants were kept at 4°C while the pellet was treated with 200 mg/mL dithiothreitol (DTT; Sigma–Aldrich, St. Louis, MO) for 10 min at 37°C to release trapped EVs through depolymerization of the THP, as previously described (Citation17). Then, the DTT-treated pellet and the previous supernatant were mixed and centrifuged again (17,000g for 10 min). Up to 100 mL of the final supernatant (n=5) was concentrated using a Centricon 70 filter unit (100 kDa cut-off; Millipore, Bedford, MA). Briefly, supernatants from each sample were loaded onto a Centricon 70 filter and centrifuged at 2,800g for 20 min. This step was repeated using the same filter unit to process the total volume of supernatant from each sample. Then, the retained volume (ranging from 800 µL to 3 mL) of concentrated urine was loaded onto the SEC column.
Size-exclusion chromatography
The SEC procedure was performed as previously described (Citation20). Briefly, up to 10 mL of stacked Sepharose-CL2B (Sigma–Aldrich) was washed twice with citrate buffer (phosphate-buffered saline, PBS/0.32% citrate, filtered through 0.22 µm filter) and packed in a 10-mL syringe (BD PlasticpakcTM, San Jose, CA).
Then, non-concentrated (3 mL) or concentrated urine (up to 3 mL) samples were loaded in the column. Fraction collection (500 µL each in PBS/0.32% citrate) started immediately after loading the sample. A total of 20 fractions from each sample was collected.
Protein concentration
Ten microlitres of each fraction were used to measure protein concentration by Bradford assay (Bio-Rad, Hercules, CA). A standard linear curve was set up using BSA (Sigma–Aldrich).
Flow cytometry
Fractions containing EVs were first identified according to their tetraspanin content determined by flow cytometry analysis. First, 50 µL of each fraction were incubated with 0.2 µL aldehyde/sulphate-latex beads (4 µm; Invitrogen, Carlsbad, CA) for 15 min at room temperature. Beads were then re-suspended in 1 mL bead-coupling buffer (BCB) (PBS supplemented with 0.1% BSA and 0.01% NaN3; Sigma–Aldrich) and incubated overnight at room temperature on rotation. EV-coated beads were then spun down at 2,000g for 10 min, washed with BCB and centrifuged again at 2,000g for 10 min. EV-coated beads were then labelled at 4°C with anti-CD9 (Clone VJ1/20), anti-CD63 (Clone TEA 3/18) (both kindly provided by Dr. Francisco Sánchez-Madrid and Dr. María Yañez-Mo), or polyclonal isotype (Abcam, Cambridge, UK) antibodies for 30 min. After washing with BCB, EV-coated beads were incubated with FITC-conjugated secondary antibodies (SouthernBiotech, Birmingham, AL) for 30 min, washed twice with BCB and analysed by flow cytometry (FacsVerse; BD Biosciences, San Jose, CA) and using the Flow Jo software (Tree Star, Ashland, OR). A total of 10,000 beads/samples were acquired.
Sodium dodecyl sulphate–polyacrylamide gel electrophoresis
Protein content was profiled in polyacrylamide gel electrophoresis. Equal volumes of EV-containing fractions (10 µL) were mixed with the same volume of Laemmli buffer (2×; Bio-Rad) with β-mercaptoethanol (5%; Bio-Rad) and incubated at 70°C for 10 min. Then, 20 µL of each sample and 5 µL of Precision plus proteinTM standard (Bio-Rad) were loaded into Mini-Protean TGX gel (Bio-Rad) and the electrophoresis was performed for 30 min at 200 V. After that, gels were stained with Coomassie blue or silver with SilverQuest (both from Invitrogen). The THP band was analysed by densitometry with Image J (NIH) in the Coomassie blue gel.
Nanoparticle tracking analysis
The concentration and size distribution of EVs were determined by nanoparticle tracking analysis (NTA) in a Nanosight LM10 (Malvern Instruments Ltd, Malvern, UK) equipped with charge-coupled device (CCD) camera (model F-033) and a 638 nm laser. Analysis was performed using the NTA 3.0 software (Malvern). Detection threshold was set to 5, and blur and Max Jump Distance were set automatically. Diluted (50- to –100-fold) fractions were loaded in the NTA device and video-recorded 3 times (60 sec each) with the camera shutter at 30.02 ms and the camera gain set at 650, as recommended by the manufacturer.
Cryo-electron microscopy
SEC fractions containing EVs were selected for cryo-electron microscopy (cryo-EM). A 10-µL sample was directly laid on Formvar-Carbon EM grids, frozen and immediately analysed with Jeol JEM 2011 transmission electron microscope operating at an accelerating voltage of 200 kV. The microscope was equipped with a 626 Gatan cryoholder and the samples were maintained at −182°C during imaging. Images were recorded on a Gatan Ultrascan cooled CCD camera under low electron dose conditions, to minimize electron bean radiation. EV size was determined using the ImageJ software (NIH).
RNA analysis
Fractions containing urinary EVs were treated with RNAse (Sigma–Aldrich, 10 ng/mL for 10 min at 37°C) to remove extravesicular RNA. Then, total RNA was extracted using the mirVANA kit (Life Technologies, Carlsbad, CA) following manufacturer's instructions and previous reports (Citation24). Then, EV-associated RNA was precipitated using glycogen (20 µg/µL; Roche); 10% AcNa 3 M, pH 5.2 (Sigma–Aldrich) and 2.5 times (v/v) of absolute ethanol. RNA profiling was determined using the 2200 TapeStation for total RNA (Agilent Technologies, Santa Clara, CA). Some samples were also analysed using a Bioanalyser 2100 System (Agilent technologies) for small RNA.
Proteomic analysis
EV-enriched fractions from non-concentrated and concentrated urine were selected to analyse their protein content using liquid chromatography followed by mass spectrometry on a LTQ Orbitrap Velos (Thermo Fisher, Carlsbad, CA). The sample was reduced with DTT, alkylated with ioidoacetamide and precipitated with trichloroacetic acid. Then, the sample was washed with acetone, reconstituted in urea and digested overnight with trypsin. Raw data files were analysed against Refseq human reference including isoforms by using Proteome discovered 1.4 software (Thermoscientific, Carlsbad, CA).
Results
EVs and soluble proteins elute differentially in SEC
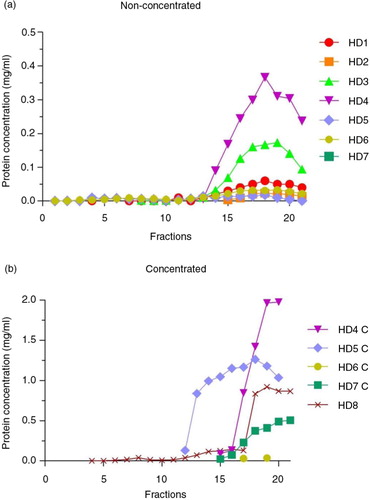
Urine samples were cleaned from debris, processed for EVs release from THP polymers and loaded into SEC columns as summarized in . To analyse the efficacy of SEC to separate EVs from urine soluble proteins, collected fractions from urine (U) or concentrated urine (C) samples were first analysed for their protein content. Fractions containing detectable amounts of proteins were eluted well after fraction 10 onwards (a). Although C samples showed higher amounts of protein (due to the previous concentration step), soluble proteins from C samples also eluted after fraction 10, as observed for U samples (b).
Fig. 1. Diagram of the isolation procedure and the initial analysis of the fractions.
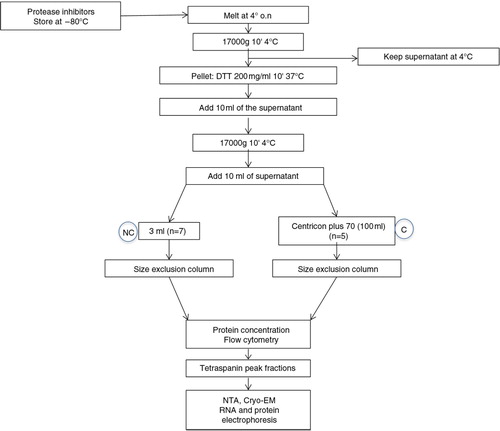
Fig. 2. Total protein concentration in SEC fractions.
Bradford assay results of non-concentrated (n=7, panel a) and concentrated (n=5, panel b) samples from healthy donors (HD). In both graphs, the x-axes show the collected fractions and the y-axes represent the protein concentration (mg/mL).
To determine which SEC fractions contained EVs, the presence of EV-associated tetraspanins CD9 and CD63 was analysed by flow cytometry. The highest median fluorescence of intensity (MFI) for tetraspanins, CD9 and CD63 was found in fractions well before any protein elution was detected (a). Consistently, fractions 7–10 showed the highest MFI value for CD9 and CD63 throughout the different samples processed (b), thus suggesting that those were the fractions containing urinary EVs. Importantly, in all experiments performed, tetraspanin-peak fractions were detected before protein elution.
Fig. 3. Urine EVs are eluted in low protein containing SEC fractions.
In panel a, a representative analyses of a SEC processed sample is shown. In each fraction (indicated on the x-axis), the expression of CD9 and CD63 and the total protein content were determined. The left axis shows the total protein content (mg/mL), whereas the right axis shows the median fluorescence intensity (MFI) data for CD9 and CD63. The isotype control for flow cytometry assay is depicted by a dotted line.
In panel b, fractions showing the highest MFI value for each CD marker (CD9 square symbols and CD63 triangle symbols) were grouped (n=10). Fractions in which protein content was first detected are also shown (circles, n=8). Higher CD9 and CD63 MFI values were routinely detected between fractions 7 and 10, well before any protein elution was detectable.

Concentration and size distribution by NTA
The concentration and size distribution of EVs were determined in tetraspanin-peak SEC fractions from U and C samples by NTA. To reduce the detection of NTA artifacts such as EV aggregates and other particles, we diluted the samples with 0.22-µm-filtered PBS and mixed vigorously the sample before and after dilution.
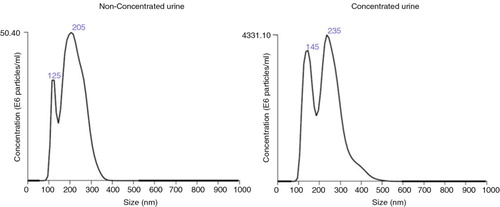
Tetraspanin-peak fractions from U samples yielded a mean of 4.1E+08 (0.63–7.85) vesicles/mL (n=5; mean, range) with an average size of 246±69 nm (mean±SD, n=5), whereas C samples rendered 4E+10 (0.09–8.01) vesicles/mL (n=4; mean, range) with an average size of 250±28 nm (mean±SD, n=4; Table and ). Thus, urine concentration yielded higher amounts of vesicles of similar size to that observed in U samples.
Table I. Size distribution and EVs concentration from NTA analyses
Cryo-electron microscopy of EVs
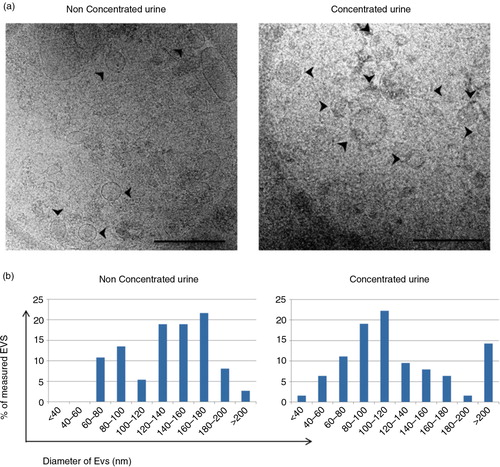
The presence of EVs in the tetraspanin-peak fraction was confirmed by cryo-EM. In both U and C samples, membrane-limited round-shaped vesicles were clearly identified (a and Supplementary Fig. 1). An additional estimation of the size of these vesicles was performed by analysing at least 5 different images taken from each sample. In these analyses, vesicles up to 140 nm in diameter represented the 49 and 69% of the counted vesicles for U and C samples, respectively (b).
Fig. 4. Analyses of the EVs obtained after SEC procedure by NTA.
Representative NTA analyses of the tetraspanin-peak fractions from HD4 (non-concentrated, left) and HD4C (concentrated, right) urine samples.
Proteomic analysis and RNA content of SEC fractions
Proteomic and transcriptomic assays are among the main screening techniques to analyse and discover new biomarkers. Therefore, we evaluated the protein and RNA content of the EVs contained in tetraspanin-peak fractions.
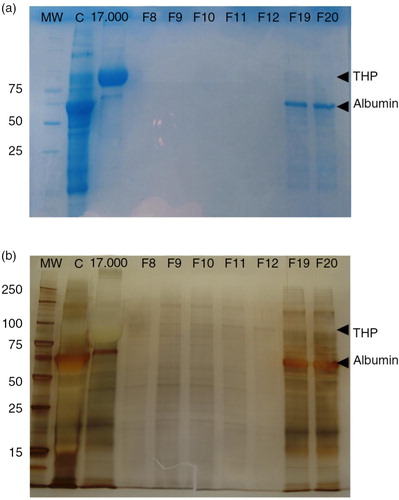
First, an SDS–PAGE was set up to compare the protein band profile of the “17,000g” pellet (, lane 17,000 g), the concentrated urine (, lane C), 5 fractions of low protein content (F8–F12, including tetraspanin-peak fractions) and 2 later fractions (F19–F20). Coomassie blue staining of the gel revealed the major presence of THP in the 17,000g pellet sample (48.38% of the total protein, a). After the concentration step, THP is largely reduced (10.5% of the total protein) and some other proteins (including albumin) are concentrated (a, lane C). Importantly, in line with the undetectable values resulting from the Bradford assay, the Coomassie staining did not reveal any substantial protein in fractions 8–12, while some albumin and traces of THP were detected in later fractions (F19 and F20). However, when silver staining was applied, a number of bands were detected in several fractions, including the tetraspanin-peak fractions (). These results suggest that many of the detected proteins in the tetraspanin-peak fractions may be specifically related to EVs, while the bulk of soluble urine proteins (including albumin) elute later after SEC.
Fig. 5. Analyses of the EVs obtained after SEC procedure by cryo-EM.
Panel a shows a cryo-EM of vesicles contained in a tetraspanin-peak fraction from non-concentrated (left) and concentrated (right) samples. Scale bar is 500 nm. Arrows pointing at EVs. In panel b, the size of these vesicles was measured (diameter in nm) from a set of images of non-concentrated (left, n=36 EVs from 10 images) and concentrated (right, n=63 EVs, from 17 images) samples using ImageJ software (NIH).
Noticeably, when a similar experiment was performed using tetraspanin-peak fractions obtained from a non-concentrated sample, protein detection by silver staining was dramatically reduced (Supplementary Fig. 2), thus suggesting the convenience of a concentration step previous to the SEC procedure.
To further confirm that proteins detected in tetraspanin-peak fractions were related to EVs, a preliminary proteomic analysis of a C sample derived from 100 mL whole urine was performed. In this preliminary analysis, up to 138 proteins were detected; from those 68% (n=94) were identified with at least 2 peptides. Focusing on these 94 proteins, 81% had been previously described in urine, such as neprilysin, podocin or aminopeptidase. In addition, 8% were specific proteins of urinary system, including specific ion channel from different parts of the kidney and tubule system, that is, vasorin, several proton-ATPases and podocin. Another 8% of the proteins detected were related to multivesicular bodies (MVBs) or the endosomal trafficking pathway. Conversely, a similar analysis performed on a U sample (from 3 mL urine) identified only 34 proteins, most of them cytoskeletal proteins. Again, this result supports the use of concentrated urine as a starting sample for the SEC procedure.
Also, several transmembrane or lipid bound proteins and cytosolic proteins related to EVs, such as galectin-3-binding protein, syntenin or annexin among others, have been detected in C samples but not in U samples (Table ). These proteins had previously been reported in urinary EVs proteomic analysis from ultracentrifuge samples (Citation12, Citation25). Conversely, proteins typically found in other vesicles or subcellular compartments (such as lysosomes, endoplasmic reticulum or mitochondria) were minimally detected (Table ). In fact, only 3 of these proteins could be found in the analysed samples. Additionally, no proteins directly related to lipoproteins were found.
Table II. Summary of proteomic results
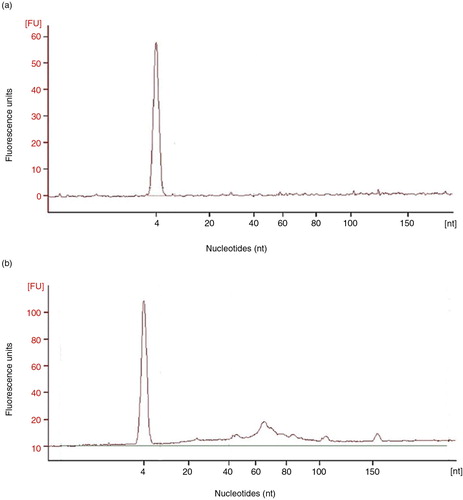
EV-associated RNA was also analysed in the tetraspanin-peak fractions from U and C samples processed by SEC. The presence of small RNA (under 200 nucleotides) was detected in C samples through gel electrophoresis of isolated EV-associated RNA. Interestingly, these small RNAs ranged from 60 to 150 nucleotides (). However, microRNA (<25 nts) species were barely detected (n=3).
Fig. 6. EV fractions from concentrated urine are enriched in protein content.
Coomassie blue stained SDS–PAGE of the concentrate urine (lane C), the 17,000g pellet (lane 17,000g) and 7 fractions including the tetraspanin-peak fractions (F8–F12) and 2 later fractions (F19 and F20) are shown in panel a. Molecular weight is indicated in the first lane (MW). THP and albumin bands are indicated in the gel.
In panel b, silver staining of the same SDS–PAGE showing the protein content of tetraspanin-peak fractions. THP and albumin bands are also indicated.
Discussion
The results presented in this manuscript demonstrate that concentrated urine followed by SEC is a suitable method for the enrichment of urinary EVs. These EVs are clearly segregated from urine soluble proteins and lipoproteins, thus permitting the specific study of EV-related proteins and vesicle content.
In the search for biomarkers of health and disease, diverse components of biological fluids have been explored, from cells to soluble proteins or nucleic acids. When identified in urine samples, EVs appeared as a new likely source of specific biomarkers associated with renal pathology (Citation4, Citation14). This is of special relevance for renal patients, currently diagnosed for kidney diseases by an invasive and non-reproducible method such as renal biopsy. Therefore, the definition of diagnostic alternatives to renal biopsy is of crucial interest in the clinical practice. The benefit of finding new biomarkers in urinary EVs would be not only the non-invasiveness of the sample, but also the opportunity to specifically analyse proteins, and RNA species mainly derived from urinary tissues and contained in a protective membrane (Citation4). EVs have been classically enriched by differential UC, a time-consuming methodology with multiple variables (Citation26). Moreover, UC pellets contain EVs and other contaminants like protein aggregates, such as THP, albumin and lipoproteins of density similar to that of EVs (Citation15, Citation22). Most of these contaminants may be removed by an additional density-gradient centrifugation, but the whole procedure is difficult to implement in the clinical practice and cannot avoid the co-isolation of high-density lipoproteins (Citation15). Other alternatives for EV isolation are based on specific resins or antibodies to EV-related proteins. Although certainly less time consuming than UC, resins have shown no specificity for MVs or exosomes and contain mixed populations of EVs, lipoproteins and lipid bilayers (Citation27, Citation28). On the other hand, monoclonal antibody-based magnetic separation is an expensive alternative that lacks a pan-EV marker for differentiating EVs, which may result in a bias on the EVs sample obtained.
SEC is a column-based technique used classically to separate mixtures of components by size. SEC has been applied in plasma samples to isolate EVs. Importantly, it has been reported that SEC may be more efficient than UC and density gradients to remove contaminant proteins and lipoproteins from plasma samples (Citation20). Also, in a previous study SEC was used after UC to improve the purity of urinary EVs from nephrotic syndrome patients, showing low protein contamination (Citation22).
Our interest in this study was to evaluate a method to isolate urinary EVs without using UC, and the results obtained suggest that SEC may be an efficient technique. Indeed, SEC is faster than UC (80 min vs. >210 min), does not require any specific expensive equipment, could be partially automatized and adapted for diagnostic and monitoring labs, and it is much more cost-efficient.
We have consistently observed that tetraspanin-containing EVs elute in fractions well before protein, even in samples from patients with high proteinuria (data not shown). Vesicles recovered from fractions show EV-compatible size and appearance as revealed by cryo-EM images. However, this is a limited observation due to the low number of particles counted (<100). When NTA analyses were performed, the NTA profiles often showed a dual size peak (at around 125 nm and at around 200 nm as shown in ). When analysed as a whole population, the estimated size of the particles was higher compared with cryo-EM measures. A possible explanation for this apparent discordance is the inability of NTA to resolve possible EVs aggregates, which would then be analysed as a single EV with bigger dimensions. Therefore, a correct dilution of the EVs is a critical point in this technique to avoid EV aggregates. Nevertheless, both NTA and cryo-EM confirmed the presence of EVs in the tetraspanin-positive SEC fractions.
Fig. 7. Analyses of the RNA content of SEC fractions.
Panel a shows a representative (n=3) bioanalyser profile of small RNA of a single tetraspanin-peak fraction obtained from a non-concentrated sample, HD5. In panel b, bioanalyser profile of a concentrated, HD5C, sample is shown.
To date, most publications on urine biomarker discovery use different volumes of urine, ranging from 1 to 200 mL (Citation29–Citation31). Although our results demonstrate that EVs may be isolated from urine (3 mL), this volume was insufficient to isolate enough EV-associated proteins or nucleic acids for further studies. Using commercially available filter units, large volumes of urine can be easily reduced after conventional centrifugation. Our results demonstrated that 100–120 mL concentrated urine could be SEC fractionated in a single column as efficiently as urine itself, but EVs concentration increased 100× compared with total urine as revealed by NTA analyses. This produced enough EVs, with reduced presence of major proteins such as THP or albumin, for further studies.
In fact, our preliminary results on the proteomic analyses of these vesicles confirmed the presence of Multivesicular Bodies (MVB)-related proteins, which could indicate their exosomal origin. Most of proteomic data on EVs derive from UC processed samples (Citation32). These analyses have identified specific proteins from the urinary system such as podocin, aminopeptidase and others (Citation12, Citation33). In our hands, as a confirmation of the successful enrichment of urinary EVs by SEC, preliminary proteomic analysis of SEC-enriched EVs from concentrated urine identified up to 138 proteins, most of them previously described, and some others being EV-related proteins such as galectin-3-binding protein, syntenin or annexin (Citation12, Citation25) (Citation33). Conversely, proteomic analysis of SEC-enriched EVs from whole urine only identified 34 proteins, most of which were not related to EVs or the urinary track, but that were previously found in total urine (Citation34).
Importantly, a recently published International Society for Extracellular Vesicles (ISEV) position statement suggests the minimal requirements for the definition of EVs (Citation35). The presence/absence of different categories of proteins are among those requirements. Our preliminary proteomic results are in line with those published before using UC (Citation12, Citation25) and match the recommendations of ISEV in terms of protein content of EV isolates, thus suggesting the applicability of the method.
In addition, the analysis of EV-contained RNA, with prior RNAse treatment, confirmed the presence of small RNAs. The small RNA species found ranged from 60 to 150 nucleotides, which differed slightly from previous studies reporting the abundance of miRNAs (Citation36, Citation37). Possibly, the different isolation method (UC vs. SEC) accounts for this discrepancy. In this sense, the low level of contaminant proteins and lipoproteins obtained in SEC-enriched EVs would guarantee a more specific EV-related RNA content.
In summary, our study has consistently shown that EVs can be isolated from concentrated urine by single-step SEC. These vesicles appear in early fractions, well before any soluble protein, and are suitable for analyses by -omic technologies. This method may be easily adapted to clinical diagnostic laboratories.
Conflict of interest and funding
This work was supported by the Spanish “Ministerio de Economía y Competitividad” through grant PI13/00050 from the “Fondo de Investigación Sanitaria” (FIS-ISCIII) to FEB. Also from the SGR programme of “Generalitat de Catalunya” (2014SGR804, Grup REMAR) and from REDinREN 2.0 (RD12/0021/0027). FEB is sponsored by the “Researchers Stabilization Program” from the Spanish “Sistema Nacional de Salud” (SNS-ISCIII) and Direcció d'Estratègia i Coordinació, Catalan Health Department (CES07/015). AOT is supported by a contract from SNS-ISCIII (CA12/00284). A. Menezes-Neto is a recipient of a postdoctoral fellowship from CNPq, Conselho Nacional de Desenvolvimento Científico e Tecnologico – Brasil.
Supplementary Figures
Download PDF (1 MB)Acknowledgements
The authors thank Dr. Francisco Sánchez-Madrid and Dr. María Yañez-Mo for kindly providing the CD9 and CD63 monoclonal antibodies. They also thank Marco A. Fernández for helpful advice in flow cytometry experiments performed at the Cytometry Unit of the IGTP.
Notes
To access the supplementary material to this article, please see Supplementary files under ‘Article Tools’.
Related Research Data
References
- Hattori S, Kojima K, Minoshima K, Yamaha M, Horie M, Sawamura T et al. Detection of bladder cancer by measuring CD44v6 expression in urine with real-time quantitative reverse transcription polymerase chain reaction. Urology. 2014; 83: 1443, e9–15. doi: 10.1016/j.urology.2014.02.013.
- Reyes-Thomas J, Blanco I, Putterman C. Urinary biomarkers in lupus nephritis. Clin Rev Allergy Immunol. 2011; 40: 138–50. [PubMed Abstract] [PubMed CentralFull Text] doi: 10.1007/s12016-010-8197-z.
- Kistler AD, Serra AL, Siwy J, Poster D, Krauer F, Torres VE et al. Urinary proteomic biomarkers for diagnosis and risk stratification of autosomal dominant polycystic kidney disease: a multicentric study. PLoS One. 2013; 8: e53016. [PubMed Abstract] [PubMed CentralFull Text] doi: 10.1371/journal.pone.0053016.
- Pisitkun T, Johnstone R, Knepper MA. Discovery of urinary biomarkers. Mol Cell Proteomics. 2006; 5: 1760–71. [PubMed Abstract] doi: 10.1074/mcp.R600004-MCP200.
- Théry C, Zitvogel L, Amigorena S. Exosomes: composition, biogenesis and function. Nat Rev Immunol. 2002; 2: 569–79. doi: 10.1038/nri855.
- Lässer C, Alikhani VS, Ekström K, Eldh M, Paredes PT, Bossios A et al. Human saliva, plasma and breast milk exosomes contain RNA: uptake by macrophages. J Transl Med. 2011; 9: 9. doi: 10.1186/1479-5876-9-9.
- Witwer KW, Buzás EI, Bemis LT, Bora A, Lässer C, Lötvall J et al. Standardization of sample collection, isolation and analysis methods in extracellular vesicle research. J Extracell Vesicles. 2013; 2: 20360. doi: http://dx.doi.org/10.3402/jev.v2i0.20360.
- Simpson RJ, Mathivanan S. Extracellular microvesicles: the need for internationally recognised nomenclature and stringent purification criteria. J Proteomics Bioinform. 2012; 5: ii–ii. doi: 10.4172/jpb.10000e10.
- Hoorn EJ, Pisitkun T, Zietse R, Gross P, Frokiaer J, Wang NS et al. Prospects for urinary proteomics: exosomes as a source of urinary biomarkers. Nephrology (Carlton). 2005; 10: 283–90. [PubMed Abstract] doi: 10.1111/j.1440-1797.2005.00387.x.
- Gutwein P, Schramme A, Abdel-Bakky MS, Doberstein K, Hauser IA, Ludwig A et al. ADAM10 is expressed in human podocytes and found in urinary vesicles of patients with glomerular kidney diseases. J Biomed Sci. 2010; 17: 3. [PubMed Abstract] [PubMed CentralFull Text] doi: 10.1186/1423-0127-17-3.
- Barutta F, Tricarico M, Corbelli A, Annaratone L, Pinach S, Grimaldi S et al. Urinary exosomal microRNAs in incipient diabetic nephropathy. PLoS One. 2013; 8: e73798. [PubMed Abstract] [PubMed CentralFull Text] doi: 10.1371/journal.pone.0073798.
- Gonzales PA, Pisitkun T, Hoffert JD, Tchapyjnikov D, Star RA, Kleta R et al. Large-scale proteomics and phosphoproteomics of urinary exosomes. J Am Soc Nephrol. 2009; 20: 363–79. [PubMed Abstract] [PubMed CentralFull Text] doi: 10.1681/ASN.2008040406.
- Lv L-L, Cao Y, Liu D, Xu M, Liu H, Tang R-N et al. Isolation and quantification of microRNAs from urinary exosomes/microvesicles for biomarker discovery. Int J Biol Sci. 2013; 9: 1021–31. [PubMed Abstract] [PubMed CentralFull Text] doi: 10.7150/ijbs.6100.
- Miranda KC, Bond DT, McKee M, Skog J, Păunescu TG, Da Silva N et al. Nucleic acids within urinary exosomes/microvesicles are potential biomarkers for renal disease. Kidney Int. 2010; 78: 191–9. [PubMed Abstract] doi: 10.1038/ki.2010.106.
- Yuana Y, Levels J, Grootemaat A, Sturk A, Nieuwland R. Co-isolation of extracellular vesicles and high-density lipoproteins using density gradient ultracentrifugation. J Extracell Vesicles. 2014; 3: 23262. http://dx.doi.org/10.3402/jev.v3.23262.
- Alvarez ML, Khosroheidari M, Kanchi Ravi R, DiStefano JK. Comparison of protein, microRNA, and mRNA yields using different methods of urinary exosome isolation for the discovery of kidney disease biomarkers. Kidney Int. 2012; 82: 1024–32. [PubMed Abstract] doi: 10.1038/ki.2012.256.
- Fernández-Llama P, Khositseth S, Gonzales PA, Star RA, Pisitkun T, Knepper MA. Tamm-Horsfall protein and urinary exosome isolation. Kidney Int. 2010; 77: 736–42. doi: 10.1038/ki.2009.550.
- Kosanović M, Janković M. Isolation of urinary extracellular vesicles from Tamm- Horsfall protein-depleted urine and their application in the development of a lectin-exosome-binding assay. Biotechniques. 2014; 57: 143–9. doi: 10.2144/000114208.
- Musante L, Saraswat M, Duriez E, Byrne B, Ravidà A, Domon B et al. Biochemical and physical characterisation of urinary nanovesicles following CHAPS treatment. PLoS One. 2012; 7: e37279. [PubMed Abstract] [PubMed CentralFull Text] doi: 10.1371/journal.pone.0037279.
- Böing AN, van der Pol E, Grootemaat AE, Coumans FAW, Sturk A, Nieuwland R. Single-step isolation of extracellular vesicles by size-exclusion chromatography. J Extracell Vesicles. 2014; 3: 23430. doi: http://dx.doi.org/10.3402/jev.v3.23430.
- Hong C-S, Muller L, Whiteside TL, Boyiadzis M. Plasma exosomes as markers of therapeutic response in patients with acute myeloid leukemia. Front Immunol. 2014; 5: 160. [PubMed Abstract] [PubMed CentralFull Text] doi: 10.3389/fimmu.2014.00160.
- Rood IM, Deegens JKJ, Merchant ML, Tamboer WPM, Wilkey DW, Wetzels JFM et al. Comparison of three methods for isolation of urinary microvesicles to identify biomarkers of nephrotic syndrome. Kidney Int. 2010; 78: 810–6. [PubMed Abstract] doi: 10.1038/ki.2010.262.
- Muller L, Hong C-S, Stolz DB, Watkins SC, Whiteside TL. Isolation of biologically-active exosomes from human plasma. J Immunol Methods. 2014; 411: 55–65. [PubMed Abstract] doi: 10.1016/j.jim.2014.06.007.
- Eldh M, Lötvall J, Malmhäll C, Ekström K. Importance of RNA isolation methods for analysis of exosomal RNA: evaluation of different methods. Mol Immunol. 2012; 50: 278–86. [PubMed Abstract] doi: 10.1016/j.molimm.2012.02.001.
- Pisitkun T, Shen R-F, Knepper MA. Identification and proteomic profiling of exosomes in human urine. Proc Natl Acad Sci USA. 2004; 101: 13368–73. [PubMed Abstract] [PubMed CentralFull Text] doi: 10.1073/pnas.0403453101.
- Cvjetkovic A, Lötvall J, Lässer C. The influence of rotor type and centrifugation time on the yield and purity of extracellular vesicles. J Extracell Vesicles. 2014; 3: 23111. http://dx.doi.org/10.3402/jev.v3.23111.
- Vickers KC, Palmisano BT, Shoucri BM, Shamburek RD, Remaley AT. MicroRNAs are transported in plasma and delivered to recipient cells by high-density lipoproteins. Nat Cell Biol. 2011; 13: 423–33. [PubMed Abstract] [PubMed CentralFull Text] doi: 10.1038/ncb2210.
- Kowal J, Tkach M, Théry C. Biogenesis and secretion of exosomes. Curr Opin Cell Biol. 2014; 29C: 116–25. doi: 10.1016/j.ceb.2014.05.004.
- Sun A, Deng J, Guan G, Chen S, Liu Y, Cheng J et al. Dipeptidyl peptidase-IV is a potential molecular biomarker in diabetic kidney disease. Diab Vasc Dis Res. 2012; 9: 301–8. [PubMed Abstract] doi: 10.1177/1479164111434318.
- Zhou H, Yuen PST, Pisitkun T, Gonzales PA, Yasuda H, Dear JW et al. Collection, storage, preservation, and normalization of human urinary exosomes for biomarker discovery. Kidney Int. 2006; 69: 1471–6. [PubMed Abstract] [PubMed CentralFull Text] doi: 10.1038/sj.ki.5000273.
- Peake PW, Pianta TJ, Succar L, Fernando M, Pugh DJ, McNamara K et al. A comparison of the ability of levels of urinary biomarker proteins and exosomal mRNA to predict outcomes after renal transplantation. PLoS One. 2014; 9: e98644. [PubMed Abstract] [PubMed CentralFull Text] doi: 10.1371/journal.pone.0098644.
- Kim D-K, Kang B, Kim OY, Choi D-S, Lee J, Kim SR et al. EVpedia: an integrated database of high-throughput data for systemic analyses of extracellular vesicles. J Extracell Vesicles. 2013; 2: 20384. doi: http://dx.doi.org/10.3402/jev.v2i0.20384.
- Wang Z, Hill S, Luther JM, Hachey DL, Schey KL. Proteomic analysis of urine exosomes by multidimensional protein identification technology (MudPIT). Proteomics. 2012; 12: 329–38. [PubMed Abstract] [PubMed CentralFull Text] doi: 10.1002/pmic.201100477.
- Adachi J, Kumar C, Zhang Y, Olsen JV, Mann M. The human urinary proteome contains more than 1500 proteins, including a large proportion of membrane proteins. Genome Biol. 2006; 7: R80. [PubMed Abstract] [PubMed CentralFull Text] doi: 10.1186/gb-2006-7-9-R80.
- Lötvall J, Hill AF, Hochberg F, Buzás EI, Di Vizio D, Gardiner C et al. Minimal experimental requirements for definition of extracellular vesicles and their functions: a position statement from the International Society for Extracellular Vesicles. J Extracell Vesicles. 2014; 3: 26913. doi: http://dx.doi.org/10.3402/jev.v3.26913.
- Cheng L, Sun X, Scicluna BJ, Coleman BM, Hill AF. Characterization and deep sequencing analysis of exosomal and non-exosomal miRNA in human urine. Kidney Int. 2014; 86: 433–44. [PubMed Abstract] doi: 10.1038/ki.2013.502.
- Channavajjhala SK, Rossato M, Morandini F, Castagna A, Pizzolo F, Bazzoni F et al. Optimizing the purification and analysis of miRNAs from urinary exosomes. Clin Chem Lab Med. 2014; 52: 345–54. [PubMed Abstract] doi: 10.1515/cclm-2013-0562.