
Abstract
Plasma-derived vesicles hold a promising potential for use in biomedical applications. Two major challenges, however, hinder their implementation into translational tools: (a) the incomplete characterization of the protein composition of plasma-derived vesicles, in the size range of exosomes, as mass spectrometric analysis of plasma sub-components is recognizably troublesome and (b) the limited reach of vesicle-based studies in settings where the infrastructural demand of ultracentrifugation, the most widely used isolation/purification methodology, is not available. In this study, we have addressed both challenges by carrying-out mass spectrometry (MS) analyses of plasma-derived vesicles, in the size range of exosomes, from healthy donors obtained by 2 alternative methodologies: size-exclusion chromatography (SEC) on sepharose columns and Exo-Spin™. No exosome markers, as opposed to the most abundant plasma proteins, were detected by Exo-Spin™. In contrast, exosomal markers were present in the early fractions of SEC where the most abundant plasma proteins have been largely excluded. Noticeably, after a cross-comparative analysis of all published studies using MS to characterize plasma-derived exosomes from healthy individuals, we also observed a paucity of “classical exosome markers.” Independent of the isolation method, however, we consistently identified 2 proteins, CD5 antigen-like (CD5L) and galectin-3-binding protein (LGALS3BP), whose presence was validated by a bead-exosome FACS assay. Altogether, our results support the use of SEC as a stand-alone methodology to obtain preparations of extracellular vesicles, in the size range of exosomes, from plasma and suggest the use of CD5L and LGALS3BP as more suitable markers of plasma-derived vesicles in MS.
To access the supplementary material to this article, please see Supplementary files under ‘Article Tools’.
Blood plasma is the most widely used specimen for biomedical applications with diagnostic purposes (Citation1). Nowadays in medicine, there are many conditions for which the boundaries of health/disease are assessed by measuring fluctuations and alterations in the composition of the wealthy mixture of biomolecules and metabolites that make up plasma. One major component of circulating plasma is extracellular vesicles (EVs) that have been studied with renewed and increasing interest in recent years (Citation2). Among EVs, plasma-derived exosomes are a promising component to be further explored. Exosomes are nanoscaled vesicles of endocytic origin that feature well-defined structure and composition (Citation3). The implication of exosomes in several intercellular communication mechanisms suggests that, in addition to their potential as biomarkers and novel therapeutical agents, these vesicles could hold precious insights into the mechanisms behind altered functionality and pathological processes (Citation4).
Current knowledge on plasma-derived exosomes is still limited. Although a few studies have undertaken the characterization of their protein content by mass spectrometry (MS), the differences on experimental designs, particularly of sample preparation and vesicle isolation methodologies, make it difficult to draw a robust comparison and determine the core elements and the molecular signatures of the circulating exosomes (Citation5–(Citation7). To further complicate matters, the proteomic analysis of plasma or plasma-derived samples by MS is recognizably troublesome due to their highly complex protein makeup, which explains why measurement or even identification of less abundant proteins from plasma may be a daunting task (Citation1).
The isolation of EVs, in particular exosomes, for their further characterization and use in downstream applications relies on a limited set of methodologies. Among these, ultracentrifugation is the most widely used, and it may be combined with differential centrifugations, density gradients, sucrose cushions and/or filtration steps (Citation8). Thus, a minimal infrastructure is demanded to perform the isolation by these means, which may prove to be an obstacle for the study of vesicles in particular given settings, such as routine clinical diagnostics laboratories in endemic regions where poverty-related diseases are prevalent. Considering the newfound role of EVs in parasitic diseases (Citation9), the field of EV research would profit greatly from isolation methodologies that could be more easily implemented and performed. Recent reports have hailed size-exclusion chromatography (SEC) as a promising alternative. SEC has been used either in combination with differential centrifugation (Citation10) or as a single-step procedure (Citation11) to isolate biologically active exosomes from plasma, and both studies have highlighted the efficient separation of the isolated vesicles from contaminating plasma proteins and other plasma components. However, a proteomics analysis of SEC-isolated vesicles is missing.
This work has a 2-fold objective: (a) contribute to the characterization of plasma-derived exosomes by providing additional data from preparations processed by 2 isolation methodologies: SEC and a commercially available kit based on exosome precipitation, Exo-Spin™, and (b) gather and cross-compare the available data on the proteomic characterization of plasma-derived exosomes by MS. Our results support the use of SEC as a stand-alone procedure to obtain purified exosomal preparations from plasma. Moreover, 2 proteins, CD5 antigen-like (UniProt: CD5L) and galectin-3 binding protein (UniProt: LGALS3BP), were consistently detected across several data sets of proteomic data on plasma-derived EVs preparations, ours included. Therefore, we propose their use as surrogate markers more suited for the proteomic study of plasma-derived EVs by MS.
Materials and methods
Blood collection and plasma processing
Peripheral blood from 3 healthy donors was collected following standard procedures that minimize contamination by platelet and platelet-derived vesicles (Citation12). Briefly, after venous puncture, 1–2 mL of blood was discarded before collection of 2–3 mL with trisodium citrate pretreated tubes, samples were gently inverted 8–10 times and processed within 30 minutes of collection by 2 consecutive centrifugation steps at 2,000×g for 10 minutes at room temperature to minimize contamination by platelets and platelet-derived vesicles. Whenever possible, plasma samples were processed for exosome isolation before being frozen at −20°C.
Exosome isolation by Exo-Spin™
Isolation of exosomes using the commercially available Exo-Spin™ Blood kit (www.cellgs.com) followed the manufacturer's standard protocol. Briefly, 0.5 mL of plasma was centrifuged at 300×g for 10 minutes at room temperature and then centrifuged at 20,000×g for 30 minutes at room temperature. The supernatant was mixed with 250 µL of “Buffer A” (from the commercial kit) and incubated for 1 hour at 4°C. Following incubation, samples were centrifuged at 20,000×g for 1 hour at room temperature, the supernatant was discarded and the pellet was resuspended in 100 µL of PBS and added to columns (supplied with the kit) previously equilibrated with PBS. Exosomes were eluted with 200 µL of PBS by centrifugation at 50×g for 1 minute at room temperature. The recovered eluate was aliquoted and stored at −80°C.
Exosome isolation by SEC
The isolation of vesicles by SEC has been described in previous works (Citation10, Citation11, Citation13–Citation15). Succinctly, Sepharose CL-2B (Sigma–Aldrich, St. Louis, MO, USA) was packed in a syringe to a final volume of 10 mL and equilibrated with PBS–citrate 0.32% (w/v). Frozen plasma samples (6 months) were thawed on ice for the first time after freezing, centrifuged at 500×g for 10 minutes at room temperature to pellet cellular debris, and 1 mL aliquots were applied to the column and collection of 30 fractions of 0.5 mL each started immediately with the PBS–citrate as the elution buffer. Protein concentrations of chromatographic fractions and Exo-Spin™ eluates were measured by Bradford assay using a standard curve of bovine serum albumin (BSA) serial dilution.
Nanoparticle Tracking Analysis
Size distribution and concentration of isolated vesicles were measured in a NanoSight LM10 instrument (Malvern Instruments Ltd, Malvern, UK) equipped with a 638 nm laser and CCD camera (model F-033), and data were analysed with the Nanoparticle Tracking Analysis (NTA) software (versions 2.3 build 0033 and 3.0 build 0060). In version 2.3, detection threshold was set to 10, blur was set to auto, Min track Length was 10 and Min Expected Particle Size was 12 pixels. In version 3.0, detection threshold was set to 5, and blur and Max Jump Distance were set to auto. To perform the measurements, samples processed by Exo-Spin™ were diluted 200 times and samples processed by SEC were diluted 10 times with PBS. Readings were taken in single capture or triplicates during 60 s at 30 frames per second (fps), at camera level set to 680 and manual monitoring of temperature.
Flow cytometry
Fractions from the SEC were analysed by flow cytometry for the presence of antigens CD9 or CD81, 2 tetraspanins that are markers for exosomes, and also for the proteins CD5L and LGALS3BP. The procedures were based on a previously published protocol (Citation8). Summarily, isolated vesicles were coupled to 4 µm latex beads (aldehyde-sulphate) for 15 minutes and then 1 mL BCB buffer (PBS–0.1% BSA) was added and incubated overnight at room temperature on rotation before incubation with primary antibodies for 30 minutes at 4°C. The primary antibodies were used at the following dilutions: anti-CD9 at 1:10, anti-CD81 at 1:10, anti-CD5L (Abcam, Cambrigde, UK, catalogue number ab45408) at 1:100 and anti-LGALS3BP (Acris Antibodies, San Diego, CA, USA, catalogue number AM33169PU-N) at 1:1,000. An isotype anti-IgG was used as the control. Unbound primary antibodies were washed off by centrifugation at 2,000×g for 10 minutes, and the secondary antibody conjugated to FITC (1:100 dilution) or Alexa 488 (1:1,000 dilution) was incubated with samples for 30 minutes at 4°C. After 2 washing steps with 150 µL of PBS–BSA 0.1% at 2,000×g for 10 minutes, the beads were resuspended in 100 µL of PBS–BSA 0.1%. Samples were analysed by flow cytometry using a LRSFortessa flow cytometer (BD Biosciences, San Jose, CA, USA), 20,000 single beads per sample were examined and mean fluorescence intensity (MFI) was used to compare different fractions.
Mass spectrometry
Liquid Chromatography (nanoLCULTRA-EKSIGENT) followed by MS (nanoLC–MS/MS) was performed on a LTQ Orbitrap Velos (Thermo Fisher, Waltham, MA, USA). Samples of isolated vesicles in PBS were reduced with 10 mM dithiothreitol, alkylated with 55 mM iodoacetamide, precipitated by 10% TCA, washed with 100% acetone and reconstituted in 2 µL of 8 M urea. Samples were brought to a concentration of 1.6 M urea, 1 µg of trypsin (Sus scrofa) was added and digestion was carried overnight at 37°C. The reaction was stopped with 1% formic acid. The amount of sample submitted to MS analyses was based on particle quantity and ranged from 9.8×10⁷ to 3.9×10⁸, among all samples analysed. Trypsinized samples were injected into a precolumn (C18 PepMap100, 5 mm, ID300 µm, 5 µm, 100 A, Thermoscientific, San Diego, CA, USA) before being flushed into the analytical column (Acclaim PepMap100 C18, 15 cm, ID75 µm, 3 µm, 100 A, Thermoscientific, San Diego, CA, USA) and eluted at a flow rate of 400 nL/min with a mobile phase gradient: 0–40% of solvent B in solvent A in the first 80–90 minutes and then 40–100% of solvent B in solvent A until the finish of the run at 100–110 minutes (A: 3% acetonitrile–0.1% formic acid in water, B: 97% acetonitrile–0.1% formic acid in water). The eluate was applied to the nanospray source of the Orbitrap spectrometer and a full scan was acquired for all spectra within the 400–1,500 m/z range with a 30,000 resolution and a maximum injection time of 500 ms. The MS/MS was performed in the LTQ using data-dependent dynamic exclusion of the top 20 most intense peptides using repeat count=1, repeat duration=30 s, exclusion list size of 500 and exclusion list duration=30 s as parameters. The top 20 most intense peptides were isolated and fragmented by low-energy collision-induced dissociation, 35% collision energy.
Database search and protein identification
Raw spectral data from Xcalibur™ (Thermo Scientific, v2.1) was searched against a custom database compiled with (a) the RefSeq human reference proteome with isoforms (88,354 entries, downloaded from www.uniprot.org on 18th July 2013), (b) the sequence for trypsin from Sus scrofa (accession P00761 from www.uniprot.org), (c) the predicted proteome of Plasmodium vivax (5,393 entries, downloaded from www.plasmodb.org release 9.2), (d) a subset of 183 reannotated Plasmodium vivax proteins, totalizing 93,931 entries. The database containing P. vivax sequences is used routinely in our laboratory, and this study, involving healthy individuals, represents an internal control of an unrelated species, helping set an appropriate level of parameter stringency. The search was done with the Sequest HT algorithm on the Proteome Discoverer™ Software version 1.4.1.14 (Thermo Scientific). Searches were performed with the following parameters: digestion by trypsin, 2 missed cleavage sites allowed, precursor mass tolerance of 10 ppm, fragment mass tolerance of 0.6 Da, oxidation of methionine as the variable modification and carbamidomethylation of cysteine as the fixed modification. The signal-to-noise (S/N) threshold was set to 1.5. Percolator was used for PSM validation at 1% false discovery rate (FDR) at peptide level. High confidence peptides (1% FDR) were further filtered at ΔCn ≤0.1 and Xcorr greater than 1.5, 2.0, 2.25, 2.5, 2.75, 3.0, 3.2 and 3.4 for charge states 1, 2, 3, 4, 5, 6, 7 and >7, respectively. Proteins identified by the same set of peptides were grouped under one master protein entry. The normalized spectrum abundance factor (NSAF) of proteins within a sample was calculated as previously described (Citation16). Finally, proteins identified with 2 or more peptides were automatically considered in the final list, and in the cases of proteins of interest identified by single peptides, their spectra were manually annotated to ensure a confident identification.
Exosome markers list
To create a set of bona fide exosome markers, we have used data from (a) 2 publications (Citation17, Citation18) that describe comprehensive lists of proteins commonly found in exosomes and (b) from 2 online open access repositories of experimental data from studies on EVs, EVpedia (Citation19–(Citation21) and ExoCarta (Citation22–(Citation24). Although Exocarta and EVpedia are mostly redundant, as they share much of their input data, they are not exactly the same. The selection criteria for composing the set were either that proteins were common to both publications or, if described in only one of the publications, that proteins were among the top 100 most common in EVpedia and were found in at least 10 different sample types in ExoCarta. The final set of “exosome markers” features a total of 34 proteins (Table ). It is less extensive and, therefore, more restrictive than the listings from which it was created.
Table I. List of 34 exosomal markers compiled from 4 sources
Abundant plasma proteins list
The quantitative dynamic range of plasma proteins spans several orders of magnitude, with 20 of the most abundant proteins representing 95% of the total protein mass (Citation1). The descriptive names of these proteins were mapped into their respective official gene symbols, giving raise to our final list of 27 abundant plasma proteins (Supplementary Table 1).
Transmission electron microscopy
Fractions showing highest MFI for exosomal markers on a FACS-based assay were selected for cryo-electron microscopy (cryo-EM). Aliquots of 10 µL of samples were laid on formvar-Carbon EM grids, frozen and immediately analysed with Jeol JEM 2011 transmission electron microscope operating at an accelerating voltage of 200 kV. Samples were kept at −182°C during imaging (626 Gatan cryoholder). Images were recorded on a Gatan Ultrascan CCD camera under low electron dose conditions to minimize electron beam radiation. For the immunogold labelling, samples were fixed in suspension with paraformaldehyde 4% (w/v) and glutaraldehyde 0.1% (v/v), placed on 200 mesh gold-grids, blocked in PBS−1% BSA for 25 minutes and incubated with anti-CD5L primary antibodies (at a 1:40 dilution in blocking solution) for 30 minutes. Grids were then washed 4 times in PBS–BSA and incubated with secondary antibodies coupled to 15 nm gold (at a 1:25 dilution in blocking solution) particles for 30 minutes. Grids were washed 4 times with PBS–BSA and 5 times in deionized water and treated with uranyl acetate and Reynolds lead citrate solutions for 15 and 1 minute, respectively, before examination on a Jeol JEM-1400 (Jeol Ltd, Tokyo, Japan) TEM equipped with a Gatan Ultrascan ES1000 CCD Camera.
Hierarchical clustering
Plasma data sets were pre-processed before clustering by removal of proteins that were detected in only one of the data sets. Then, a distance matrix was calculated, using the binary distance method, and used for complete hierarchical clustering. All clustering steps were performed with the R environment, using functions available in the “stats” package (Citation25).
Statistics
The Mann–Whitney–Wilcoxon test for non-parametric distributions was used at a level of significance of 5% (p-value<0.05), for comparing the prevalence of “exosome markers” among plasma (n=13) and non-plasma high-throughput data sets from ExoCarta (n=67) (Supplementary Table 2).
Results
Characterization of plasma-derived vesicles isolated by Exo-Spin™ and SEC
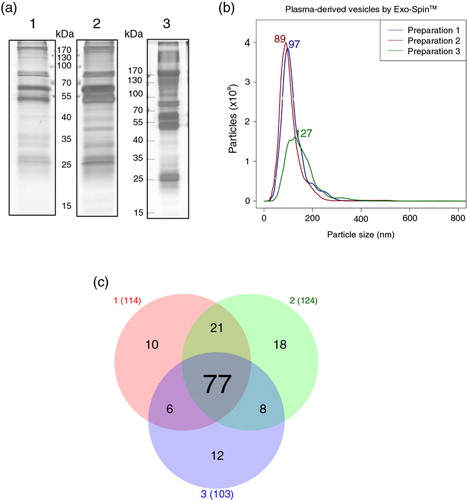
Electrophoresis of the protein content of the vesicles isolated by Exo-Spin™ revealed that the 3 preparations shared a comparable complex mixture of proteins (a). Moreover, NTA revealed that preparations from donors “1” and “2” were highly homogeneous in terms of particle size (97 and 89 nm) and concentration (1.54×10⁸ and 1.49×10⁸ particles/µL), whereas the preparation from donor “3” contained bigger modal particle size (127 nm) and a lower concentration (0.98×10⁸ particles/µL; b). Vesicle isolation from donor “3” was performed from frozen plasma (6 days), and perhaps it could account for the observed variability in this sample. In spite of these apparent differences in size, MS of Exo-Spin™ isolated vesicles revealed a substantial overlapping of identified proteins among all 3 preparations (Supplementary Table 3). Thus, from the total 152 detected proteins, 77 were common to all 3 preparations and 112 were found in at least 2 out of 3 samples (c). Strikingly, no exosome markers were detected in the Exo-Spin™ preparations, whereas several of the most abundant plasma proteins such as serum albumin, immunoglobulins, fibrinogen, plasminogen and apolipoproteins were. These results suggest that, although vesicles isolated by Exo-Spin™ were within the expected size range of exosomes according to NTA data, the carryover of abundant plasma proteins might have masked the detection of the less abundant proteins, including those that are classically associated to exosomes.
Fig. 1. Plasma-derived exosomes isolated by Exo-Spin™ from the plasma of 3 healthy donors. (a) Electrophoretic profile of proteins on silver-stained polyacrylamide gels. The following amount of proteins were loaded onto the gels: 1.05 µg (1); 1.14 µg (2) and 4.6 µg (3). (b) NTA was performed on a NanoSight LM10 (software version 2.3) after dilution of samples in PBS. (c) Venn diagram showing the overlap of proteins detected by LC–MS/MS in each preparation (red: “Preparation from donor 1”; green: “Preparation from donor 2”; blue: “Preparation from donor 3”).
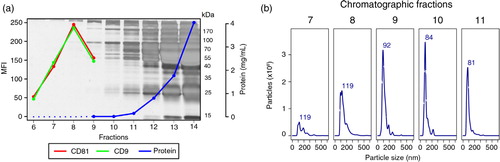
Aiming to exclude abundant plasma proteins, the 3 preparations were processed for vesicle isolation by SEC. Upon chromatographic fractionation, vesicles should elute in early fractions, prior to the bulk of plasma proteins (Citation11). We thus performed electrophoresis, protein quantification, NTA analysis and flow cytometry for early fractions. As illustrated with data from donor “1,” the complexity and total amount of protein steadily increased as the separation progressed (a). Moreover, a bead-exosome flow cytometry assay (Citation8) revealed that the highest MFIs for CD9 or CD81, 2 tetraspanins considered “classical” exosomal markers, were observed in fraction 8 (a). In addition, as detected by NTA, particles within the expected size range of exosomes began to elute in higher concentration from fraction 8 onwards (b). Remarkably, neither NTA nor flow cytometry results held any correlation to the protein content of the corresponding fractions. Thus, while virtually no protein was detected until fraction 8, it is clear that from fraction 11 onwards there was a disproportional accumulation of proteins, mainly in the mass range of 55–70 kDa, which encloses the molecular weight of serum albumin (66 kDa), the most abundant protein of plasma. Results from donors “2” and “3” were similar (Supplementary Fig. 1). Altogether, these results demonstrate that chromatographic isolation efficiently separates vesicles from non-related abundant plasma proteins that would otherwise contaminate the preparations.
Fig. 2. Isolation of plasma-derived exosomes by size-exclusion chromatography. An aliquot (1 mL) of undiluted plasma from Donor 1 was passed through a sepharose (CL-2B) column, and 30 fractions of 0.5 mL each were collected. (a) SDS–PAGE stained with silver and protein concentration values of fractions 6–14 were measured by Bradford assay (fractions 6, 7 and 8 were below the lower limit of detection) and fractions 6–9 were analysed by flow cytometry, after coupling of vesicles to 4 µm latex beads, for the presence of antigens CD9 (1:10) and CD81 (1:10). The secondary anti-mouse antibody was conjugated to FITC and was used at a 1:100 dilution. MFI: mean fluorescence intensity. (b) Fractions 7–11 were submitted to NTA on a NanoSight LM10 (software version 3.0).
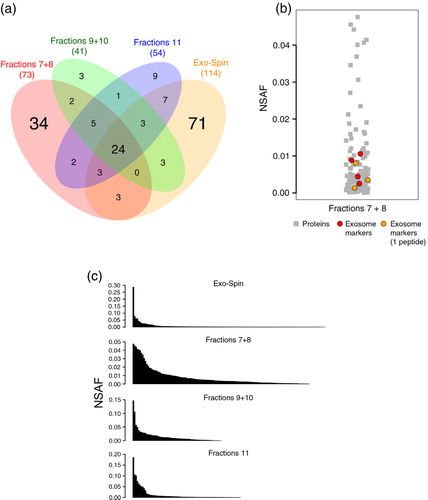
To further evaluate the impact of chromatography on the separation of vesicles from free plasma proteins, we have followed the progression of the fractionation by MS through the analysis of consecutive fractions from donor “1.” Based on flow cytometry and NTA results, we have prepared 3 samples: (a) the mix (1:1) of fractions 7 and 8, (b) fractions 9 and 10 and (c) fraction 11. The set of identified proteins were compared among the 3 preparations and also to the Exo-Spin™ preparation from the same donor (a). In total, 269 proteins were detected from donor “1,” and a set of 24 proteins were found in all 4 preparations, most of these shared proteins are known plasma components such as immunoglobulins, complement factors, apolipoproteins, fibrinogen and albumin. Among the SEC-derived preparations, “fractions 7+8” was the one featuring the highest number of unique hits and also the one sharing the least number of proteins with “Exo-Spin.” Of interest, in “fractions 7+8,” and only in this sample, the exosome markers actin (UniProt: ACTB), moesin (UniProt: MSN) and 2 proteins from the 14-3-3 family (UniProt: YWHAB and YWHAZ) were detected (Supplementary Tables 3–5). Moreover, if MS protein identification parameters were lowered to encompass proteins identified by only one high confidence peptide, 3 additional exosome markers: annexin A2 (UniProt: ANXA2), Ras-related protein Rap-1b (UniProt: RAP1B) and glyceraldehyde-3-phosphate dehydrogenase (UniProt: GAPDH) were also detected (Supplementary Table 6 and Supplementary Fig. 2). Of importance, even under these more permissive MS parameters, no exosomal markers were detected in the remaining samples. To address this question, we have calculated the relative abundance of proteins within each sample as a normalized function of their spectra counts. In “fractions 7+8,” the relative abundances of the exosome markers support the notion that these proteins are in low abundance (b). Interestingly, when the overall relative abundance of the entire protein sets was compared among the 4 samples it was evident that “fractions 7+8” had the most balanced distribution of proteins, in sharp contrast to “Exo-Spin” (c). The interpretation is that, in “fractions 7+8,” optimal conditions were met for the MS-based detection of proteins classically associated with exosomes. At this point, vesicles were already eluting while plasma proteins were mostly trapped in the column, and even though plasma proteins were still detected, their detection levels were not disproportionately high. On the other hand, in the consecutive fractions “9+10” and “11” and in the Exo-Spin™ preparation, a few proteins, in particular immunoglobulins, were over-represented and possibly interfered in the detection of less abundant proteins.
Fig. 3. Proteomic analysis of samples from donor 1. Mass spectrometry was performed on 4 preparations from the same plasma sample: (i) chromatographic fractions 7+8, (ii) chromatographic fractions 9+10, (iii) chromatographic fraction 11 and (iv) Exo-Spin™. (a) Venn diagram showing the overlap of proteins detected by nanoLC–MS/MS. (b) The relative abundance (NSAF) of the exosome markers detected in the data set of fractions 7+8 (in red) and of exosome markers identified by single peptides (orange) were compared to the relative abundance of the remaining proteins for the same sample. (c) The overall relative abundance of all proteins in each sample plotted in descending order. NSAF=normalized spectrum abundance factor.
Furthermore, MS analysis of individual SEC fractions 9 and 8 from donors “2” and “3,” respectively, showed the overall reproducibility of SEC even among early fractions coming from different donors (Supplementary Fig. 1: Results for Donors 2 and 3). These fractions were chosen based on the results from the bead-exosome FACS assay (Supplementary Fig. 1A), and were expected to keep some correspondence to SEC fraction 8 from donor “1.” Indeed, their proteomic profiles are most similar to that of “fractions 7+8” from donor “1” (Supplementary Fig. 1B and C). However, MS also failed to detect exosome markers in these fractions (Supplementary Table 3).
Comparative analysis of plasma-derived vesicle preparations characterized by MS
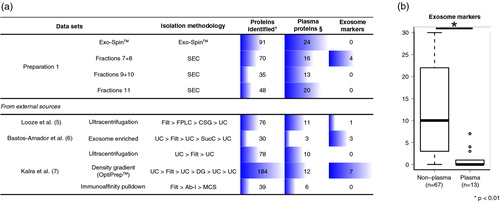
The absence of classical exosome markers detected by MS in all but one of our preparations was a puzzling result. Therefore, we compared our proteomic results to available MS data sets on plasma-derived exosomes to determine whether isolation by Exo-Spin™ or chromatography was influencing the composition of the obtained vesicles. We selected the only 3 published studies that have performed the characterization of exosomes isolated from healthy human plasma by MS (Citation5–(Citation7). The first of these studies was the work by Looze et al. (Citation5), data of which are available through either EVpedia or ExoCarta. In this study, the authors have used ultracentrifugation at 175,000×g on a continuous sucrose gradient to isolate exosomes from 2 plasma samples that had been previously filtered and separated into lipoprotein fractions by fast protein liquid chromatography. After in-gel tryptic digestion, they have performed LC–MS/MS. The second study, by Bastos-Amador et al. (Citation6), performed the MS-based proteomic characterization of plasma microvesicles (MVs) isolated by ultracentrifugation; however, some of the MV preparations were further enriched by an additional ultracentrifugation on a 30% sucrose cushion and only those were used for the comparative analysis performed. The third study, by Kalra et al. (Citation7) is, in fact, a comparative study in which different exosome isolation methodologies were evaluated. A detailed examination of the different methodological approaches from these studies reveals that the combination of ultracentrifugation to other isolation steps that explore the signature density of vesicles (e.g. OptiPrep, sucrose cushion or continuous sucrose gradient) seems to be more successful in the detection of exosome markers. Irrespective of the isolation methodology, all data sets registered a consistent presence of some of the most abundant plasma proteins. On the other hand, recovery of exosome markers was noticeably inconsistent (a). In fact, when compared to other studies in ExoCarta that have performed exosome characterization by MS from non-plasma samples (other bodily fluids or cellular culture supernatants), the number of classical markers recovered from the plasma data sets (n=13) was significantly lower than that of non-plasma datasets (n=67) (Mann–Whitney–Wilcoxon test, p-value<0.001) (b).
Fig. 4. Exosome markers in plasma-derived exosomal preparations. (a) Mass spectrometry results from Exo-Spin and SEC samples (Preparation 1) were compared to previous studies that have isolated exosomes by other methodologies. The total number of identified proteins, of abundant plasma proteins and of exosome markers, is shown. (b) A panel of 34 exosome markers are compared between high-throughput proteomic data sets of plasma-derived exosomes (n = 13) and non-plasma-derived exosomes retrieved from ExoCarta (n = 67). Statistical significance was tested for with Mann–Whitney–Wicoxon test for non-parametric distributions at a level of significance of 5% (p-value < 0.05). SEC: size-exclusion chromatography, FPLC: fast protein liquid chromatography, SCG: continuous sucrose gradient, UC: ultracentrifugation, Filt: filtration at 0.22 or 0.1 µm, SucC: sucrose cushion, DG: density gradient, Ab-I: antibody incubation, MCS: magnetic column separation, ¥according to data extracted from ExoCarta for previous publications, §list of common plasma proteins.
Hierarchical clustering reveals a subset of frequently identified proteins
Altogether, 361 proteins have been detected in the combined results from our preparations and previous studies on plasma-derived exosomes in MS studies. However, 179 (49.6%) of these proteins were detected only once, demonstrating the heterogeneity of these data sets. To determine the degree of resemblance among the preparations and whether the different isolation methodologies were influencing the final profiles, the remaining 182 proteins were used to cluster the data sets. The presence/absence of each protein in the data sets was evaluated and applied in a clustering method for binary data. Considering only our experiments, the preparations were clearly grouped by the isolation methodology rather than by sample. Interestingly, the ultracentrifugation-based preparations from 3 distinct publications did not form a separate cluster (). In fact, the 3 data sets recovered from the one study which evaluated ultracentrifugation, density gradient and immunoaffinity pulldown formed a cluster when compared to data from the other studies, whereas it would be expected that preparations sharing methodological approaches based on the same isolation principle (e.g. ultracentrifugation) would present similar results. Thus, the grouping of plasma-derived preparations could not be completely explained by either the isolation method or the individual variability among samples. We are aware that conclusions from the clustering analysis should be taken with caution as it is usual for MS proteomic data sets of plasma samples to be highly heterogeneous (Citation26).
Fig. 5. Hierarchical clustering of plasma data sets. The 13 data sets of proteomic data on plasma-derived exosomes were clustered after removal of proteins that were detected in only one of the data sets. For the remaining 182 proteins, a distance matrix based on their presence/absence was built using a binary method. The calculated distances were used to generate the hierarchical cluster. The red rectangle highlights the proteins that were more frequently detected (≥9). The red arrows indicate 2 proteins, CD5 antigen-like (CD5L) and galectin-3 binding protein (LGALS3BP).
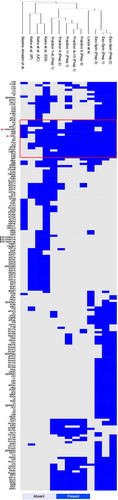
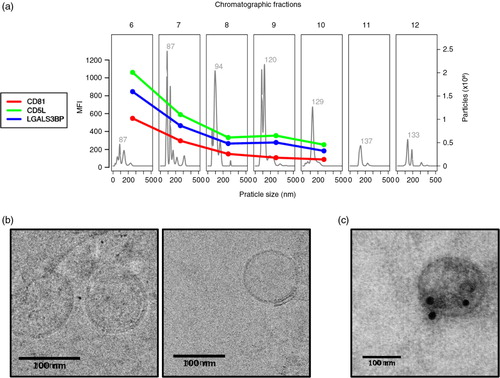
Despite the many limitations that prevent drawing a clear comparison among these data sets, it was noteworthy that there was a small set of proteins that were more frequently identified and listed in most of the preparations irrespective of the isolation method (, red box). As expected, most of the proteins in this subset are recognizably plasma contaminants such as albumin, fibrinogen, apolipoproteins and complement factors. Yet, 2 of these proteins, CD5 antigen-like (CD5L) and galectin-3 binding protein (LGALS3BP), were consistently detected and had already been associated to exosomes and EVs in previous studies (Citation6, Citation27). To demonstrate the presence of these proteins in our samples, we obtained the FACS profiles of CD5L and LGALS3BP throughout the chromatographic separation of plasma and compared them to the profile of CD81 (a and Supplementary Fig. 2: Characterization of markers present on exosomes coated to latex beads by FACs analysis). As shown in a, the expression profiles for CD5L and LGALS3BP were almost identical to that of CD81. Vesicles on fraction 6 were then submitted to transmission electron microscopy and their size as well as their morphology was confirmed (b). Moreover, immunoelectron microscopy indicates that CD5L is found in the surface of these vesicles (c). These results strongly suggest that CD5L and LGALS3BP are also associated to exosomes. Considering that CD81 has not been detected by MS in any of the plasma-derived exosome preparations, CD5L and LGALS3BP could be considered as surrogate markers for future studies involving MS-based proteomic analysis of vesicles derived from plasma.
Fig. 6. CD5L and LGALS3BP have similar elution profiles to the exosome marker CD81. Plasma from “Donor 1” was submitted to size-exclusion chromatography and fractions 6–12 were analysed by NTA, flow cytometry and transmission electron microscopy (TEM). (a) NTA was performed on a NanoSight LM10 (software version 3.0). For flow cytometry, samples were coupled to 4 µm beads and incubated with primary antibodies against CD81 (1:10), CD5L (1:100) or LGALS3BP (1:1,000). The secondary antibody was conjugated to Alexa 488 was used at a 1:1,000 dilution. MFI: mean fluorescence intensity. (b) Fraction 6 from size-exclusion chromatography was submitted to cryo-EM and (c) immunostained with anti-CD5L antibodies conjugated to gold spheres of 20 nm.
Discussion
Here, we have analysed plasma-derived EVs, in the size range of exosomes, from healthy donors obtained by 2 different methodologies that do not require ultracentrifugation: SEC on sepharose columns and Exo-Spin™. Co-isolation of contaminants, some of which sharing the same physical properties of exosomes (e.g. lipoproteins), is a common trait in the processing of plasma-derived EVs, thus we decided to perform the molecular characterization of isolated vesicles by analysing total protein content, particle population profiles (NTA), presence of exosome markers by flow cytometry and, finally, proteomic characterization by MS (nanoLC–ESI-MS/MS).
Although samples processed with Exo-Spin™ had vesicles within the expected size range of exosomes, MS detected an overabundant presence of contaminating plasma proteins that confounded the molecular composition of vesicles and may have impaired the detection of known exosome markers. In contrast, upon SEC, vesicles enriched in exosomal markers eluted prior to the bulk of plasma proteins. Previous reports demonstrated that SEC is an appropriate option for obtaining purified vesicle preparations that retain integrity and functionality (Citation10, Citation11); however, no proteomical characterization of plasma-derived SEC-isolated vesicles had been performed yet. Our data corroborate the successful enrichment of EVs by SEC isolation and shows for what we believe is the first time, the characterization of SEC preparations by MS.
The quantitative dynamic range of plasma proteins, or the relative difference in abundance between the most common and the rarest proteins, is estimated to span 10–12 orders of magnitude with the few most abundant proteins comprising approximately 99% of the protein mass (Citation1). These 2 features explain why performing MS-based proteomic studies from plasma-related samples is such a challenging task and why exosomal markers could only be detected after SEC in our samples. Although plasma proteins could still be detected in the earlier fractions, the extent of fractionation achieved between vesicles and free proteins was sufficient to allow detection of the following exosome-associated proteins: actin (UniProt: ACTB), moesin (UniProt: MSN), 2 proteins from the 14-3-3 family (UniProt: YWHAB and YWHAZ), as well as annexin A2 (UniProt: ANXA2), Ras-related protein Rap-1b (UniProt: RAP1B) and glyceraldehyde-3-phosphate dehydrogenase (UniProt: GAPDH). At first, we were concerned that no tetraspanins, the most classical markers of exosomes, were not detected by MS, even though their presence was confirmed by a bead-exosome FACS assay (a and 6a). However, it is important to highlight that we are discussing the detection of proteins by MS, and it is not unusual that proteins that are detected by immunoassays (e.g. western blot, flow cytometry, ELISA) do not show in methods for unbiased protein discovery like MS. Such is the case with the tetraspanins. Proteins belonging to this class feature 4 transmembrane domains that comprise most of their structures, and being integral membrane proteins their identification by MS is more difficult (Citation28). Even when a modified MS approach was employed for the study of tetraspanins from highly expressing cell types, the detection of CD9, for example, still relied on a limited number of peptides (Citation29). The question remained whether this failure to detect tetraspanins could be related to the isolation process, which prompted the comparison to other methodologies. We did not perform vesicle isolation by any ultracentrifugation-based method, as since the beginning we intended to circumvent this step or other pre-processing steps in search for alternatives better suited for low infrastructure settings. Thus, we opted to use the readily available data from EVpedia and ExoCarta to draw a comparative analysis among plasma-derived vesicular preparations that had been characterized by MS. The conclusion from the comparison of our results to MS-based studies that isolated vesicles from healthy plasma using more traditional protocols, mainly based on differential centrifugation, is that exosomal markers are under-represented. Thus, in 2 of the data sets, both from the same study (Citation7), no markers could be detected, whereas in ultracentrifuged preparations only 1 marker (UniProt: CTLC – Clathrin heavy chain 1) was detected in one study (Citation5), and 3 markers (UniProt: ACTB – actin cytoplasmic 1, UniProt: HSPA8 – heat shock cognate 71 kDa protein, UniProt: SDCBP – syntenin-1) in another (Citation6). Lastly, 7 markers (UniProt: MSN – moesin, UniProt: ACTB, UniProt: YWHAZ – 14-3-3 protein zeta/delta, UniProt: CFL1 – cofilin-1, UniProt: EEF1A1 – elongation factor 1-alpha 1, UniProt: GAPDH – Glyceraldehyde-3-phosphate dehydrogenase, UniProt: HSPA8) were identified using OptiPrep™ for isolation of exosomes (Citation7) (a). Importantly, MS failed to detect tetraspanins in these data sets as well.
Noticeably, SEC on a sepharose column reached similar overall results without the need for ultracentrifugation or any pre-processing steps. The current protocol for performing vesicle isolation by SEC adds an intrinsic variability to the method, especially during column setup and fraction collection, which may account for the oscillating detection of exosome markers in adjacent fractions in different preparations, even within the same donor. However, the overall results of SEC, in which early fractions are enriched in vesicles while later fractions contain the bulk of proteins and other contaminating particles (e.g. HDL lipoproteins), are highly reproducible, as shown by our preparations ( and Supplementary Fig. 1A) and in previous studies (Citation10, Citation11). We anticipate that the use of pre-packed columns tailor-made for EV isolation will greatly enhance the resolution, reproducibility and comparability of the technique in the near future.
The use of the CL-2B sepharose resin results in the fractionation of vesicles of approximately 70 nm and larger. It denotes that vesicles in the early SEC fractions are rather a mixture of vesicles than purified populations of singular vesicle types. In theory, the larger vesicles could influence in the final characterization, by contributing with their own subset of proteins. However, NTA showed that the original population of vesicles in plasma (data not shown), as well as the recovered fractions after SEC were predominantly composed of small vesicles, in a size range that is recognizably associated with exosomes. Thus, we believe that we are being cautious when we adopt the term EVs and indicate that most of our vesicle populations are within an expected size range. Moreover, the list of markers that was used to evaluate the MS results and the detection of CD9 and CD81 in a bead-based assay help to confirm that, even though not alone, exosomes are represented in our populations. Considering all the above, we believe that a pre-processing step to remove larger vesicles, such as filtration or centrifugation at 20,000×g, might be an interesting addition to the protocol in the direction of purer preparations.
Perhaps, the greatest advantage of SEC is that its low infrastructural demand and ease-of-use allows it to be applied in settings that would be prohibitive for other methodologies, making SEC the appropriate methodology to potentiate the reach of extracellular research beyond the laboratory to clinical and field settings. There are several advantages to perform on-site vesicle isolation from freshly collected plasma instead of shipping frozen samples for processing elsewhere. It has been shown that exosomes isolated from frozen plasma samples contain protein–nucleic acid aggregates which are difficult to remove (Citation10), whereas freshly harvested exosomes were more resistant to freeze/thaw cycles (Citation10, Citation15). Also, the stability of exosomal RNA to freeze/thaw cycles tends to be greater than plasma RNA (Citation30).
Finally, our comparative analysis revealed that there was a subset of proteins that were consistently detected throughout the plasma-derived vesicle data sets, regardless of the methodological approach. Most of the proteins in this subset are known plasma components; however, 2 of those proteins, CD5 antigen-like (UniProt: CD5L) and galectin-3-binding protein (UniProt: LGALS3BP), had previously been associated with EVs and prompted further examination. CD5L and LGALS3BP are described as secreted proteins from the superfamily of scavenger receptor cysteine-rich proteins (Citation31, Citation32). CD5L is expressed by cells in lymphoid tissues and may play a role in the regulation of the immune system, especially monocytes (Citation33). LGALS3BP also has an immunomodulatory role, is found in elevated levels in the serum of cancer and AIDS patients (Citation34), and may also play a role in tumour metastasis due to its interaction with galectin-3 (Citation35). Both CD5L and LGALS3BP were detected by western blots in MV preparations, and LGALS3BP was also detected in enriched-exosome preparations (Citation6). Moreover, LGALS3BP was among the 50 most abundant proteins in the proteome of trabecular meshwork exosomes (Citation27), and is among the top 100 most often-found proteins of EVs in EVpedia (Citation21), being identified in over 40 high-throughput experiments listed in this repository. In this article, we have demonstrated for the first time that, upon separation by SEC, both CD5L and LGALS3BP co-eluted with CD81. Therefore, we add supporting data to the notion that these are indeed exosomal proteins. Our results from flow cytometry in the absence of permeabilizing agents and the preliminary results of immuno-electron microscopy suggest that CD5L and LGALS3BP are likely exposed at the surface of the vesicles. Their physical association to vesicles could indeed help to explain why they are being previously described as secreted proteins. Although they are not transmembrane proteins, both CD5L and LGALS3BP have signal peptides, indicating that, at some point, they are targeted to the ER lumen. At the moment, it is unclear exactly how these proteins would be incorporated into vesicles. We can only speculate that from the ER lumen they eventually reach the endosomal pathway and then the multivesicular bodies (MVBs). An interesting hypothesis is that these proteins would be tethered to the vesicle membrane by glycosylphosphatidylinositol (GPI) anchors. The human cd59 and cd73 and the mouse prion protein (Prp) are GPI-anchored proteins which are negative for transmembrane domains and positive for signal peptides. Both cd59 and cd73 have been detected by bead-based FACS assays on the surface of exosomes from human tracheobronchial epithelial cells (Citation36) and from bladder cancer cells (Citation37), respectively, while Prp was detected in MVBs and associated with the surface of vesicles by immunoelectron microscopy (Citation38). Considering our observation of the reliable detection of CD5L and LGALS3BP in preparations of plasma-derived vesicles by MS, we propose that these proteins might be used as surrogate markers for plasma vesicles, especially for studies aiming at quantitative proteomics.
Conclusion
In summary, we have employed 2 methodologies, SEC and Exo-Spin™, that circumvent the need for ultracentrifugation steps to isolate exosomes from healthy plasma samples and subsequently performed their characterization by MS, LC–ESI-MS/MS. In our hands, Exo-Spin™ preparations contain several of the most abundant plasma proteins confounding the MS analysis of plasma-derived vesicles. The combination of Exo-Spin™ with previous steps to deplete plasma proteins might be an interesting alternative. In contrast, SEC removed the overabundant free plasma proteins and allowed the detection of classical as well as 2 novel not classical markers, CD5L and LGALS3BP, in fractions where proteins were undetected by the Bradford assay. These data thus support the use of SEC as a stand-alone technique for studies of plasma-derived exosomes and the use of CD5L and LGALS3BP as new exosomal markers of plasma-derived exosomes in MS analysis.
Conflict of interest and funding
The authors have not received any funding or benefits from industry or elsewhere to conduct this study.
Supplementary_Figure1
Download PDF (1.2 MB)Supplementary_Figure2
Download PDF (347.1 KB)Supplementary_Table1
Download PDF (65.5 KB)Supplementary_Table2
Download PDF (81.7 KB)Supplementary_Table3
Download PDF (113.9 KB)Supplementary_Table4
Download MS Excel (160 KB)Supplementary_Table5
Download MS Excel (1.5 MB)Supplementary_Table6
Download PDF (81.6 KB)Acknowledgements
We are grateful to Dr. Ernesto Nakayasu for helpful discussions and support with proteomic analyses, to Drs. Francisco Sánchez Madrid and Maria Yañez-Mo for the kind gift of anti-CD9 and anti-CD81 antibodies, and to the Microscopy Facility at the Autonomous University of Barcelona (UAB). AM-N is a recipient of a postdoctoral fellowship from CNPq, Conselho Nacional de Desenvolvimento Científico e Tecnologico – Brasil. Work in the HAP laboratory is funded by the European Community's Seventh Framework Programme and by the Ministerio Español de Economía y Competitividad.
Notes
To access the supplementary material to this article, please see Supplementary files under ‘Article Tools’.
Related Research Data
References
- Anderson NL. The human plasma proteome: history, character, and diagnostic prospects. Mol Cell Proteomics. 2002; 1: 845–67. doi: 10.1074/mcp.R200007-MCP200.
- Revenfeld ALS, Bæk R, Nielsen MH, Stensballe A, Varming K, Jørgensen M. Diagnostic and prognostic potential of extracellular vesicles in peripheral blood. Clin Ther. 2014; 36: 830–46. doi: 10.1016/j.clinthera.2014.05.008.
- Théry C, Zitvogel L, Amigorena S. Exosomes: composition, biogenesis and function. Nat Rev Immunol. 2002; 2: 569–79. doi: 10.1038/nri855.
- Valadi H, Ekström K, Bossios A, Sjöstrand M, Lee JJ, Lötvall JO. Exosome-mediated transfer of mRNAs and microRNAs is a novel mechanism of genetic exchange between cells. Nat Cell Biol. 2007; 9: 654–9. doi: 10.1038/ncb1596.
- Looze C, Yui D, Leung L, Ingham M, Kaler M, Yao X et al. Proteomic profiling of human plasma exosomes identifies PPARgamma as an exosome-associated protein. Biochem Biophys Res Commun. 2009; 378: 433–8. doi: 10.1016/j.bbrc.2008.11.050.
- Bastos-amador P, Royo F, Gonzalez E, Conde-vancells J, Palomo-diez L, Borras FE et al. Proteomic analysis of microvesicles from plasma of healthy donors reveals high individual variability. J Proteomics. 2012; 75: 3574–84. doi: 10.1016/j.jprot.2012.03.054.
- Kalra H, Adda CG, Liem M, Ang C-S, Mechler A, Simpson RJ et al. Comparative proteomics evaluation of plasma exosome isolation techniques and assessment of the stability of exosomes in normal human blood plasma. Proteomics. 2013; 13: 3354–64. doi: 10.1002/pmic.201300282.
- Théry C, Amigorena S, Raposo G, Clayton A. Isolation and characterization of exosomes from cell culture supernatants and biological fluids. Curr Protoc Cell Biol. 2006; 3: 22.1–29. doi: 10.1002/0471143030.cb0322s30.
- Marcilla A, Martin-Jaular L, Trelis M, de Menezes-Neto A, Osuna A, Bernal D et al. Extracellular vesicles in parasitic diseases. J Extracell Vesicles. 2014; 3: 25040. doi: http://dx.doi.org/10.3402/jev.v3.25040
- Muller L, Hong C-S, Stolz DB, Watkins SC, Whiteside TL. Isolation of biologically-active exosomes from human plasma. J Immunol Methods. 2014; 411: 55–65. doi: 10.1016/j.jim.2014.06.007.
- Böing AN, van der Pol E, Grootemaat AE, Coumans FAW, Sturk A, Nieuwland R. Single-step isolation of extracellular vesicles by size-exclusion chromatography. J Extracell Vesicles. 2014; 3: 1–11. doi: http://dx.doi.org/10.3402/jev.v3.23430
- Witwer KW, Buzás EI, Bemis LT, Bora A, Lässer C, Lötvall J. Standardization of sample collection, isolation and analysis methods in extracellular vesicle research. J Extracell Vesicles. 2013; 2: 20360. doi: http://dx.doi.org/10.3402/jev.v2i0.20360
- Taylor DD, Gerçel-Taylor C, Lyons KS, Stanson J, Whiteside TL. T-cell apoptosis and suppression of T-cell receptor/CD3-zeta by Fas ligand-containing membrane vesicles shed from ovarian tumors. Clin Cancer Res. 2003; 9: 5113–9.
- Trocoli Torrecilhas AC, Tonelli RR, Pavanelli WR, da Silva JS, Schumacher RI, de Souza W et al. Trypanosoma cruzi: parasite shed vesicles increase heart parasitism and generate an intense inflammatory response. Microbes Infect. 2009; 11: 29–39. doi: 10.1016/j.micinf.2008.10.003.
- Sokolova V, Ludwig A-K, Hornung S, Rotan O, Horn PA, Epple M et al. Characterisation of exosomes derived from human cells by nanoparticle tracking analysis and scanning electron microscopy. Colloids Surf B Biointerfaces. 2011; 87: 146–50. doi: 10.1016/j.colsurfb.2011.05.013.
- Zybailov B, Mosley AL, Sardiu ME, Coleman MK, Florens L, Washburn MP. Statistical analysis of membrane proteome expression changes in Saccharomyces cerevisiae. J Proteome Res. 2006; 5: 2339–47. doi: 10.1021/pr060161n.
- Simpson RJ, Jensen SS, Lim JWE. Proteomic profiling of exosomes: current perspectives. Proteomics. 2008; 8: 4083–99. doi: 10.1002/pmic.200800109.
- Schorey JS, Bhatnagar S. Exosome function: from tumor immunology to pathogen biology. Traffic. 2008; 9: 871–81. doi: 10.1111/j.1600-0854.2008.00734.x.
- Kim D-K, Kang B, Kim OY, Choi D-S, Lee J, Kim SR et al. EVpedia: an integrated database of high-throughput data for systemic analyses of extracellular vesicles. J Extracell Vesicles. 2013; 2: 20384. doi: http://dx.doi.org/10.3402/jev.v2i0.20384
- Choi D-S, Kim D-K, Kim Y-K, Gho YS. Proteomics, transcriptomics and lipidomics of exosomes and ectosomes. Proteomics. 2013; 13: 1554–71. doi: 10.1002/pmic.201200329.
- Choi D-S, Kim D-K, Kim Y-K, Gho YS. Proteomics of extracellular vesicles: exosomes and ectosomes. Mass Spectrom Rev. 2015; 34(4): 474–90. doi: 10.1002/mas.21420.
- Mathivanan S, Simpson RJ. ExoCarta: a compendium of exosomal proteins and RNA. Proteomics. 2009; 9: 4997–5000. doi: 10.1002/pmic.200900351.
- Mathivanan S, Fahner CJ, Reid GE, Simpson RJ. ExoCarta 2012: database of exosomal proteins, RNA and lipids. Nucleic Acids Res. 2012; 40: 1241–4. doi: 10.1093/nar/gkr828.
- Simpson RJ, Kalra H, Mathivanan S. ExoCarta as a resource for exosomal research. J Extracell Vesicles. 2012; 1: 18374. doi: http://dx.doi.org/10.3402/jev.v1i0.18374
- R Development Core Team. R: a language and environment for statistical computing. 2012; Vienna, Austria: R Foundation for Statistical Computing.
- Anderson NL. Counting the proteins in plasma. Clin Chem. 2010; 56: 1775–6. doi: 10.1373/clinchem.2010.146167.
- Stamer WD, Hoffman EA, Luther JM, Hachey DL, Schey KL. Protein profile of exosomes from trabecular meshwork cells. J Proteomics. 2011; 74: 796–804. doi: 10.1016/j.jprot.2011.02.024.
- Rabilloud T. Membrane proteins ride shotgun. Nat Biotechnol. 2003; 21: 508–10. doi: 10.1038/nbt0503-508.
- André M, Le Caer J-P, Greco C, Planchon S, El Nemer W, Boucheix C et al. Proteomic analysis of the tetraspanin web using LC-ESI-MS/MS and MALDI-FTICR-MS. Proteomics. 2006; 6: 1437–49. doi: 10.1002/pmic.200500180.
- Ge Q, Zhou Y, Lu J, Bai Y, Xie X, Lu Z. miRNA in plasma exosome is stable under different storage conditions. Molecules. 2014; 19: 1568–75. doi: 10.3390/molecules19021568.
- Gebe JA, Kiener PA, Ring HZ, Li X, Francke U, Aruffo A. Molecular cloning, mapping to human chromosome 1 q21-q23, and cell binding characteristics of Sp alpha, a new member of the scavenger receptor cysteine-rich (SRCR) family of proteins. J Biol Chem. 1997; 272: 6151–8. doi: 10.1074/jbc.272.10.6151.
- Koths K, Taylor E, Halenbeck R, Casipit C, Wang A. Cloning and characterization of a human Mac-2-binding protein, a new member of the superfamily defined by the macrophage scavenger receptor cysteine-rich domain. J Biol Chem. 1993; 268: 14245–9.
- Tissot J-D, Sanchez J-C, Vuadens F, Scherl A, Schifferli JA, Hochstrasser DF et al. IgM are associated to Sp alpha (CD5 antigen-like). Electrophoresis. 2002; 23: 1203–6. doi: 10.1002/1522-2683(200204)23:7/8<1203::AID-ELPS1203>3.0.CO;2-1.
- Ullrich A, Sures I, D'Egidio M, Jallal B, Powell TJ, Herbst R et al. The secreted tumour-associated antigen 90K is a potent immune stimulator. J Biol Chem. 1994; 269: 18401–7.
- Inohara H, Akahani S, Koths K, Raz A. Interactions between galectin-3 and Mac-2-binding protein mediate cell-cell adhesion. Cancer Res. 1996; 56: 4530–4.
- Kesimer M, Scull M, Brighton B, DeMaria G, Burns K, O'Neal W et al. Characterization of exosome-like vesicles released from human tracheobronchial ciliated epithelium: a possible role in innate defense. FASEB J. 2009; 23: 1858–68. doi: 10.1096/fj.08-119131.
- Welton JL, Khanna S, Giles PJ, Brennan P, Brewis IA, Staffurth J et al. Proteomics analysis of bladder cancer exosomes. Mol Cell Proteomics. 2010; 9: 1324–38. doi: 10.1074/mcp.M000063-MCP201.
- Fevrier B, Vilette D, Archer F, Loew D, Faigle W, Vidal M et al. Cells release prions in association with exosomes. Proc Natl Acad Sci USA. 2004; 101: 9683–8. doi: 10.1073/pnas.0308413101.