Abstract
Introduction
Circulating microparticles (MP) have been described in sickle cell anaemia (SCA); however, their interaction with endothelial markers remains unclear. We investigated the relationship between MP, protein C (PC), free protein S (PS), nitric oxide (NO), endothelin-1 (ET-1) and adrenomedullin (ADM) in a large cohort of paediatric patients.
Method
A total of 111 children of African ethnicity with SCA: 51 in steady state; 15 in crises; 30 on hydroxyurea (HU) therapy; 15 on transfusion; 17 controls (HbAA) of similar age/ethnicity. MP were analysed by flow cytometry using: Annexin V (AV), CD61, CD42a, CD62P, CD235a, CD14, CD142 (tissue factor), CD201 (endothelial PC receptor), CD62E, CD36 (TSP-1), CD47 (TSP-1 receptor), CD31 (PECAM), CD144 (VE-cadherin). Protein C, free PS, NO, pro-ADM and C-terminal ET-1 were also measured.
Results
Total MP AV was lower in crisis (1.26×10⁶ ml−1; 0.56–2.44×10⁶) and steady state (1.35×10⁶ ml−1; 0.71–3.0×10⁶) compared to transfusion (4.33×10⁶ ml−1; 1.6–9.2×10⁶, p<0.01). Protein C levels were significantly lower in crisis (median 0.52 IU ml−1; interquartile range 0.43–0.62) compared with all other groups: HbAA (0.72 IU ml−1; 0.66–0.82, p<0.001); HU (0.67 IU ml−1; 0.58–0.77, p<0.001); steady state (0.63 IU ml−1; 0.54–0.70, p<0.05) and transfusion (0.60 IU ml−1; 0.54–0.70, p<0.05). In addition, levels were significantly reduced in steady state (0.63 IU ml−1; 0.54–0.70) compared with HbAA (0.72 IU ml−1; 0.66–0.80, p<0.01). PS levels were significantly higher in HbAA (0.85 IU ml−1; 0.72–0.97) compared with crisis (0.49 IU ml−1; 0.42–0.64, p<0.001), HU (0.65 IU ml−1; 0.56–0.74, p<0.01) and transfusion (0.59 IU ml−1; 0.47–0.71, p<0.01). There was also a significant difference in crisis patients compared with steady state (0.49 IU ml−1; 0.42–0.64 vs. 0.68 IU ml−1; 0.58–0.79, p<0.05). There was high correlation (R>0.9, p<0.05) between total numbers of AV-positive MP (MP AV) and platelet MP expressing non-activation platelet markers. There was a lower correlation between MP AV and MP CD62P (R=0.73, p<0.05) (platelet activation marker), and also a lower correlation between percentage of MP expressing CD201 (%MP CD201) and %MP CD14 (R=0.627, p<0.001). %MP CD201 was higher in crisis (11.6%) compared with HbAA (3.2%, p<0.05); %MP CD144 was higher in crisis (7.6%) compared with transfusion (2.1%, p<0.05); %CD14 (0.77%) was higher in crisis compared with transfusion (0.0%, p<0.05) and steady state (0.0%, p<0.01); MP CD14 was detectable in a higher number of samples (92%) in crisis compared with the rest (40%); %MP CD235a was higher in crisis (17.9%) compared with transfusion (8.9%), HU (8.7%) and steady state (9.9%, p<0.05); %CD62E did not differ significantly across the groups and CD142 was undetectable. Pro-ADM levels were raised in chest crisis: 0.38 nmol L−1 (0.31–0.49) versus steady state: 0.27 nmol L−1 (0.25–0.32; p<0.01) and control: 0.28 nmol L−1 (0.27–0.31; p<0.01). CT-proET-1 levels were reduced in patients on HU therapy: 43.6 pmol L−1 (12.6–49.6) versus control: 55.1 pmol L−1 (45.2–63.9; p<0.05). NO levels were significantly lower in chest crisis (19.3 mmol L−1 plasma; 10.7–19.9) compared with HU (22.2 mmol L−1 plasma; 18.3–28.4; p<0.05), and HbSC (30.6 mmol L−1 plasma; 20.8–39.5; p<0.05) and approach significance when compared with steady state (22.5mmol L−1 plasma; 16.9–28.2; p=0.07).
Conclusion
Protein C and free PS are reduced in crisis with lower numbers of platelet MP and higher percentage of markers of endothelial damage and of red cell origin. During chest crisis, ADM and ET-1 were elevated suggesting a role for therapy inhibiting ET-1 in chest crisis.
Microparticles (MP) are intact vesicles derived from cell membranes; they vary in size from 0.2 to 2.0 µm. The majority of studies suggest that MP generation arise from cell membrane activation or apoptosis (Citation1–Citation3). The process has been associated with deregulation of important transmembrane protein deputized to ensure cell membrane phospholipid asymmetry. The activation of calpain enzyme will further facilitate MP generation disrupting cytoskeletal structure (Citation4). Once aminophospholipids distribution changes, phosphatidylserine is exposed on the external membrane layer. The lack of phospholipids asymmetry, with phosphatidylserine on the external lipid raft, has been suggested to support coagulation processes in particular thrombin generation. In this context, platelet-derived microparticles (PMP) and endothelial-derived MP (EMP) have been shown to provide binding sites for factors IXa, VIII, Va and IIa (Citation5). Furthermore, a defect in PMP generation, known as Scott Syndrome, has been associated with increased bleeding, supporting the general view that MP are procoagulants (Citation6). Satta et al. (Citation7) also demonstrated in vitro that tumour necrosis factor (TNF) and lipopolysaccharide (LPS) induce tissue factor (TF) expression in monocytes lineage and also facilitate generation of MP carrying TF. Therefore, MP procoagulant activity should also be considered TF-VIIa related (Citation8). However, studies by Dahlbäck et al. (Citation9) have suggested that MP may also carry protein S (PS) and thrombomodulin supporting anticoagulation through protein C (PC) pathway; similar findings have been also shown for PMP (Citation10–Citation12). The role of MP has been investigated in several vascular conditions: acute myocardial infarction, antiphospholipid syndrome, pre-eclampsia, thrombotic thrombocytopenic purpura, hemolytic uraemic syndrome, vasculitis, heparin-induced thrombocytopenia and paroxysmal nocturnal hemoglobinuria (PNH) (Citation4).
Sickle cell anaemia (SCA) is a condition where ongoing endothelial vascular damage is present. In addition, the rate of polymerization of sickle hemoglobin sustains chronic red blood cell (RBC) membrane damage with associated hemolysis. This suggests that SCA represents a valid model for studying endothelial/RBC MP interactions in vivo. Moreover, in SCA, the vaso-occlusive events leading to sickle cell crises are unpredictable and currently no laboratory marker that correlates the clinical with the disease status exists. Therefore, the identification of activation/apoptotic markers correlating with the disease phenotype (e.g. steady state, crisis) could be relevant. However, to date only general studies on MP in SCA exist and have lacked clarification on the role of MP in SCA during crisis, steady state or while on disease modifying treatment (Citation13–Citation17). We previously showed the role of naturally occurring anticoagulants such as PC and PS in SCA (Citation18). The mechanisms of action of MP, PC and PS in SCA should also be considered in the context of other vasoconstrictor and vasodilator agents involved in leucocyte endothelial adhesion and vaso-occlusion including nitric oxide (NO), endothelin-1 (ET-1) and adrenomedullin (ADM) (Citation19–Citation21). Hydroxyurea (HU) in SCA impairs sickle hemoglobin production favouring foetal hemoglobin, reducing crisis incidence. HU is a strong NO donor, in addition free hemoglobin (Hb) derived from hemolysis scavenges NO. Recent studies have suggested that NO/ET-1 regulation may have a link with the renin–angiotensin–aldosterone (RAA) system (Citation22). ADM, an endothelial modulator, may also participate. To shed light on vaso-occlusion mechanisms of SCA, we studied a large cohort of paediatric patients in different clinical status (in steady state with hemoglobin SS [HbSS] without history of crises; in steady state with HbSC without history of crises; on HU therapy; on transfusion; during crises). Within these clinical sub-categories, we evaluated several blood parameters such as MP, PC, PS, ADM, ET-1 and NO.
Materials, patients and methods
Subjects
Patients and controls were of sub-Saharan African ethnicity and were recruited from Our Lady's Children's Hospital, Dublin. Parents of all patients and controls gave informed consent, and the study was approved by the medical ethics committee of Our Lady's Children's Hospital, Dublin. All SCA patients (n=116) had HbSS. Sixty-six were males and 50 females. Fifty-six were untreated steady state (mean age 5.3 years) out of which 31 never suffered crises and 15 suffered crises subsequent to sampling; however, no patients in steady-state group had ever had a crisis event previous to sampling; 14 patients in sickle cell crisis (mean age 5.4 years) were divided into 2 sub-groups: chest crisis (n=9) and non-chest crisis (n=5); 30 suffered recurrent crisis and were undergoing HU treatment (mean age 7.2 years); 16 had recurrent crisis and were receiving blood transfusion (6.5 years); 13 patients with sickle hemoglobin and hemoglobin C disease (HbSC) (mean age 6.1 years); 17 children of sub-Saharan African ethnicity of similar age (mean age 4.6 years) were used as control group (hemoglobin AA).
Samples
Blood samples were drawn using a 19-G needle into citrate (0.32% final concentration) after discarding the first 3 ml and blood was gently mixed with the anticoagulant. Platelet poor plasma (PPP) was prepared by centrifugation within 15 minutes at 1,550×g for 20 minutes at 20°C to pellet the cells. Plasma containing MP was carefully aspirated, leaving a layer of about 1 cm undisturbed on top of the cells. The cell-free plasma was immediately aliquoted (250 µl) and stored at −80°C for future flow cytometric experiments. Patients and controls were assessed for the following: total Hb content, white cell count (WCC), neutrophil count (ANC), platelet count, reticulocyte count, mean cellular volume (MCV), mean hemoglobin concentration (MCH), bilirubin and lactate dehydrogenase (LDH). Hemoglobin F (HbF) and hemoglobin S (HbS) percentages were measured in SCA patients by high-performance liquid chromatography (HPLC).
Reagents and assays
Monoclonal antibodies were fluorescent-labelled specifically against the following cell surface antigens: (a) Annexin V (AV) for MP detection, (b) CD61, CD62P (P-selectin, platelet activation marker) for platelet-derived MP (PMP); (c) CD144 (VE-cadherin) and CD62E (E-selectin) for EMP; (d) CD14 for white cells derived MP; (e) CD235a (glycophorin) for red cell derived microparticles (RMP). Samples containing MP were also tested for CD36 and CD47 (thrombospondin receptors), CD42a (glycoprotein IX), CD31 (PECAM-1 or platelet endothelial cell adhesion molecule), CD142 (TF), CD201 (endothelial PC receptor). All antibodies were obtained from Becton Dickinson®, and CD144 FITC from Abcam®. Chemicals were supplied by Sigma®, unless otherwise stated.
Protein C and protein S
PC and PS were measured in the plasma. Protein C was analysed by a chromogenic method, and free PS was measured by latex-based assay.
Microparticles
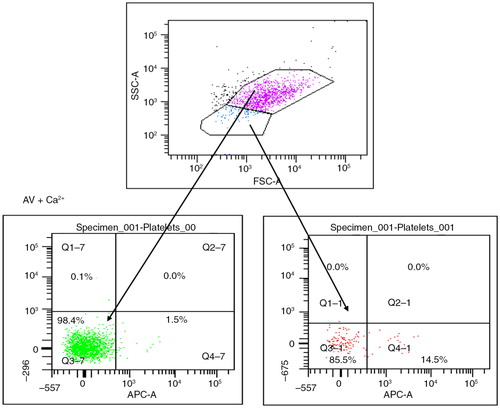
MP were prepared according to the method reported by Biró et al. (Citation23). Briefly, PPP was thawed for 1 hour on melting ice. MP were pelleted by centrifugation at 18,890×g for 30 minutes at 20°C. The upper 90% of plasma (225 µl) was removed and replaced by phosphate-buffered saline (154 mM NaCl and 1.4 mM phosphate) containing 0.32% citrate (PBS–citrate) (pH 7.4). MP were resuspended by agitation and centrifuged for a second time. This step was repeated once, and the MP pellet and the remaining 25 µl of solution were resuspended in 75 µl PBS–citrate. From these MP samples, 5 µl aliquots were incubated with monoclonal antibodies and/or AV activated protein C (APC) (BD Biosciences) in a final volume of 55 µl PBS containing 2.5 mmol L−1 CaCl2 (PBS-Ca) (pH 7.4), for 30 minutes at room temperature in the dark. PBS–Ca (900 µl) was added and the samples were measured by flow cytometry. Appropriate isotype controls were also included in the panel at similar concentrations to the antibodies and samples containing PBS–citrate (3.8%) (PBS–cit) instead of PBS–Ca were used as negative control for AV-stained MP ().
Fig. 1. Microparticles (MP) are gated on their size and ability to express phosphatidylserine when stained by Annexin V in the presence of calcium. Platelets (pink) show no expression of phosphatidylserine after staining by AV conjugated with APC, while MP (blue) show >95% positivity.
Flow cytometric detection of MP
MP samples were acquired using a 6-colour FACSCanto flow cytometer and analysed by FACSDiva software (BD Biosciences). Forward scatter (FSC) and side scatter (SSC) of light was set on a log scale with bi-exponential correction for events close to zero. MP were gated based on size and their ability to bind AV. Initially, platelet-rich plasma (PRP) in PBS–citrate was acquired for size exclusion of platelets. AV-stained PPP in PBS–Ca was then acquired and the majority of events occurred in a region lower in FSC compared with platelets. MP were gated as AV-positive events occurring in this region, excluding any background noise and non-AV binding MP. An unstained sample and a sample stained with AV in the absence of calcium were used as controls. Acquisition was performed for 30 seconds per sample, during which time the flow cytometer analysed approximately 30 µl of the suspension (the flow rate was measured on every day MP samples were run). In order to measure antibody-positive events, thresholds were set based on MP samples incubated with similar concentrations of isotype-matched control antibodies (). Cellular origin of MP and activation markers was investigated using the list of antibodies above. Data analysis was performed using FACS-Diva software. Positive events exhibited higher fluorescent intensity than the isotype controls (mouse IgGs FITC/PE, rat IgG FITC and rabbit IgG FITC) (all Becton Dickinson®, UK, apart from rabbit IgG FITC from ABCAM®, UK). Numbers of MP per litre of plasma were estimated by the number (N) of MP events per minute (double our count): N×2× [100/5]×[955/60]×[106/250].
Nitric oxide
NO was measured in the plasma using a microplate assay based on the enzymatic conversion of nitrate to nitrite by nitrate reductase and subsequent colorimetric development using Griess reagent (R&D Systems®, UK). Plasma was filtered through 0.2-µm filter and diluted 1:2 in diluent supplied by the manufacturer prior to measurement. The plate was read at 690 nm using a Versamax™ plate reader and Softmax pro™ software®.
Pre-pro-ADM
Pre-pro-ADM was measured in the plasma using the MR-proADM LIA assay (B.R.A.H.M.S. AG®, Germany) as described by Morgenthaler et al. (Citation24). Tubes were coated with purified polyclonal antibody against the amino acid sequences 83–94 of pre-pro-ADM. After labelling with methylacridinium n-hydroxysuccinimide ester and diluting, another purified polyclonal antibody against amino acids 68–86 of pre-pro-ADM was used as a tracer. Dilutions of peptides representing amino acids 45–92 of pre-pro-ADM in normal horse serum served as normal calibrators. The immunoassay was performed by incubating 10 µl samples/calibrators and 200 µl tracer in coated tubes under agitation for 2 hours at room temperature. Tubes were washed 4 times in 1 ml wash solution (B.R.A.H.M.S. AG®, Germany), and bound chemiluminescence was measured with a LB952T luminometer. The lower detection limit of the assay is 0.08 nmol L−1. The functional sensitivity of the assay is 0.12 nmol L−1.
Pre-pro-endothelin-1
Pre-pro-endothelin-1 was measured in the plasma using the CT-proET-1 LIA ELISA assay (B.R.A.H.M.S.) as described by Papassotiriou et al. (Citation25). Tubes were coated with purified polyclonal antibody against the amino acid sequences 168–181 of pre-pro-endothelin-1. After labelling with methylacridinium n-hydroxysuccinimide ester and diluting, another purified polyclonal antibody against amino acids 200–212 of pre-pro-endothelin-1 was used as a tracer. Dilutions of peptides representing amino acids 169–212 in normal horse serum served as normal calibrators. The immunoassay was performed by incubating 50 µl samples/calibrators and 200 µl tracer in coated tubes under agitation for 2 hours at room temperature. Tubes were washed 4 times in 1 ml wash solution, and bound chemiluminescence was measured with a LB952T luminometer.
Statistical analysis
Conducted using 1-way ANOVA with correction for non-Gaussian distribution followed by Tukey's multicomparison test and using unpaired Student's t-test. To better assess how MP interacted with each other and with other variables, Pearson's correlation test was run between all variables: blood values (Hb, MCV, MCH, WCC, N, PLT, HbF%, HbS%, bilirubin, LDH and reticulocytes), CD values (expressed in absolute number and percentage), PC, PS, NO, ET-1 and ADM values. Mann–Whitney analysis was performed between subgroups (control; HbSC; steady state; crises; HU; transfusion) with non-Gaussian distributions (Prism™ GraphPad Software, San Diego, CA, USA® and SPSS®).
Results
Blood parameters
Hb (median; interquartile range) values were significantly decreased in crises: 71.0 dl−1 (61.0–81.5, p<0.01) compared with HbAA 110.0 dl−1 (106.0–121.0, p<0.001), HU 102.0 dl−1 (99.5–109.0, p<0.001), to steady state 83.0 g dl−1 (47.8–93.8, p<0.01), transfusion 100.0 dl−1 (92.8–107.8, p<0.001) and HbSC 111.0 dl−1 (101.5–113.5, p<0.001), were significantly decreased in steady state compared with all other groups (p<0.001) and in transfusion compared with HbAA (p<0.05). HbS percentage values were similar in crises 76.9% (72.2–86.7) and steady state 74.9% (67.1–85.8), were significantly decreased in the HU subgroup 63.65% (59.6–70.3) versus steady state, versus transfusion 25.9% (16.2–35.4), versus HbSC 44.7% (43.9–45.5) (p<0.001). The MCV values were significantly lower in crisis 77.8 fl (73.1–81.3) versus HU 92.9 fl (89.7–102.8, p<0.001) and transfusion 87.1 fl (83.8–90.5, p<0.05). MCV was significantly lower in steady state 80.8 fl (72.8–85.8) versus HU (p<0.001), transfusion (p<0.05) and higher than HbSC 70.6 fl (65.1–74.6, p<0.05), higher (p<0.001) in HU versus HbAA 77.3 fl (72.7–81.0) and HbSC, and higher in transfusion versus HbAA (p<0.01) and HbSC (p<0.001). The MCH values were lower in crisis 25.2 (24.3–27.9) versus HU 34.9 pg cell−1 (31.1–36.8, p<0.001) and transfusion 30.0 pg cell−1 (29.3–31.0, p<0.05), and were also lower in steady state 27.1 pg cell−1 (24.9–29.6) versus HU (p<0.001). MCH was higher (p<0.001) in HU versus HbAA 26.7 pg cell−1 (24.6–28.1) and HbSC 24.3 pg cell−1 (22.9–26.6) and in transfusion versus HbSC (p<0.001). HbF% levels were increased in the HU 27.7% (19.1–32.0) compared with crisis 15.3% (5.6–17.6, p<0.01), steady state, 16.2% (7.0–27.7, p<0.05) and transfusion 5.0% (2.6–7.9, p<0.001). Bilirubin was lower in HbAA 11.0 µmol L−1 (6.0–14.5) versus crisis 30.0 µmol L−1 (21.0–41.0, p<0.01), steady state 31.5 µmol L−1 (19.0–43.0, p<0.001) and transfusion 27.0 µmol L−1 (18.5–43.0, p<0.01). LDH levels were higher in crisis 1,083 IU L−1 (866–1,719) versus HbAA 397.5 IU L−1 (384–571; p<0.001), HU 731 IU L−1 (664–894; p<0.001), transfusion 780 IU L−1 (649–1,075; p<0.05) and HbSC 497 IU L−1 (420–562; p<0.001). WCC was significantly higher in crisis 16.0×10⁹ L−1 (12.9–19.3; p<0.001) and steady state 13.4×10⁹ L−1 (8.67–15.7×10⁹; p<0.001) versus HbAA 7.25×10⁹ L−1 (5.40–8.98×10⁹; p<0.001) and HU 7.90×10⁹ L−1 (6.15–9.63×10⁹; p<0.001). Neutrophils levels were higher in crisis 9.40×10⁹ L−1 (5.70–12.4×10⁹) versus HbAA, 2.40×10⁹ L−1 (1.80–3.25×10⁹; p<0.001), steady state 4.50×10⁹ L−1 (3.25–6.83×10⁹; p<0.05) and HU 3.0×10⁹ L−1 (2.20–3.93×10⁹; p<0.001). Reticulocytes numbers were significantly lower in HbAA samples 49.3 µl–1 (40.5–61.1) versus crisis 251 µl−1 (105–328; p<0.001), steady state 285 µl−1 (230–348; p<0.001) and transfusion 225 µl−1 (128–258; p<0.001), and reduced in HU 131 µl−1 (90.8–164) versus crisis (p<0.05) and steady state (p<0.001) (results are summarised in Table –III and in Figs. (Citation2–Citation4).
Fig. 2. Blood values (total Hb, HbS percentage Hct, MCV) in the different subgroups (control with HbAA, crises, steady state, HbSC, on treatment with hydroxyurea and transfusion).
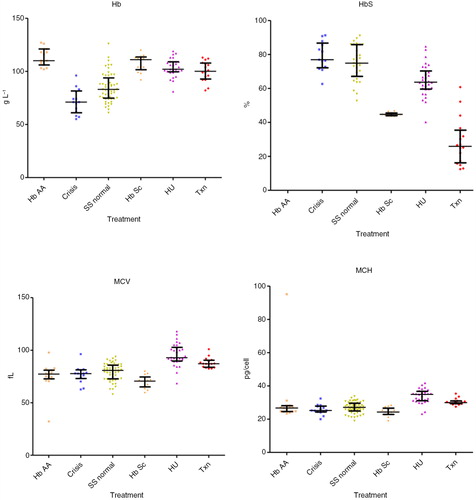
Fig. 3. Markers of hemolysis in all subgroups: reticulocytes, LDH and total-bilirubin.
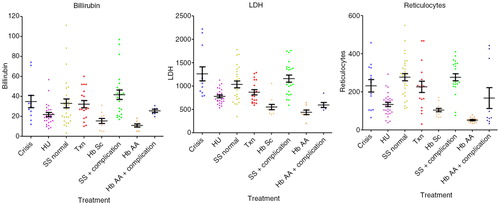
Fig. 4. Values of WCC, N and PLT in the different subgroups.
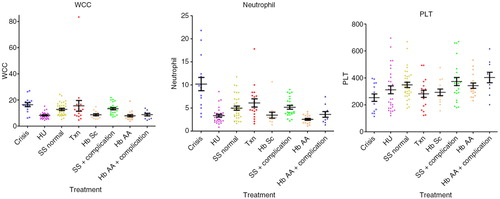
Table I. Hemoglobin levels, red cell indices, white cell count (WCC), platelet counts, bilirubin, lactate dehydrogenase (LDH) and reticulocyte counts
MP results
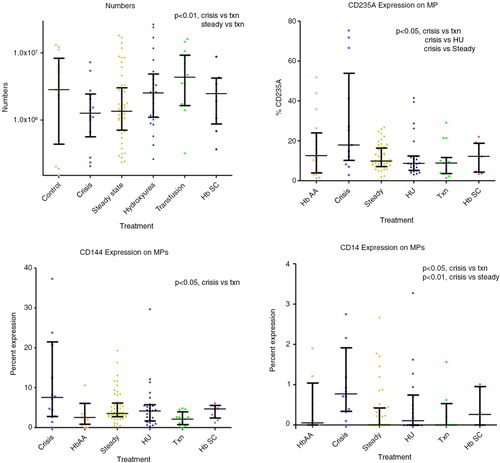
Total MP AV were lower in crisis 1.26×10⁶ ml−1 (0.56–2.44×10⁶) and steady state 1.35×10⁶ ml−1 (0.71–3.0×10⁶) compared with transfusion 4.33×10⁶ ml−1 (1.6–9.2×10⁶, p<0.01). There was high correlation (R>0.9, p<0.05) between total numbers of AV-positive MP and platelet MP expressing non-activation platelet markers. There was a lower correlation between MP AV and MP CD62P (R=0.73, p<0.05), and also a lower correlation between percentage of MP expressing CD201 (%MP CD201) and %MP CD14 (R=0.627, p<0.001). %MP CD201 was higher in crisis 11.6% (2.7–15.8) compared with HbAA 3.2% (1.2–4.3, p<0.05); %MP CD144 was higher in crisis 7.6% (2.8–21.5) compared with transfusion 2.1% (0.7–2.9, p<0.05); % MP CD14 0.77% (0.3–1.9) was higher in crisis compared with steady state 0.0% (0.0–0.4, p<0.01) and transfusion 0.0% (0.0–0.5, p<0.05); MP CD14 was detectable in a higher number of samples (92%) in crisis compared with the rest (40%); %MP CD235a was higher in crisis 17.9% (10.2–53.9) compared with transfusion 8.9% (3.6–11.6, p<0.05), HU 8.7% (5.2–12.4, p<0.05) and steady state 9.9% (7.1–16.4, p<0.05); %MP CD62E did not differ significantly across the groups and CD142 was undetectable ().
Fig. 5. MP numbers and percentages.
Statistical correlation
%MP CD235A correlated with %MP CD14, R=0.49, p<0.001 and %MP CD144 R=0.66, p<0.001, and %MP CD201 R=0.48, p<0.001, while it inversely correlated with %MP CD61 R=−0.47, p<0.001. There was also a higher correlation between %MP CD201 and %MP CD14, R=0.63, p<0.001.
Protein C
Protein C levels were significantly reduced in crisis 0.52 IU ml−1 (0.43–0.62) compared with all other groups: HbAA 0.72 IU ml−1 (0.66–0.82, p<0.001); HU 0.67 IU ml−1 (0.58–0.77, p<0.001); steady state 0.63 IU ml−1 (0.53–0.70, p<0.05) and transfusion therapy 0.60 IU ml−1 (0.54–0.70, p<0.05). In addition, levels were significantly reduced in steady state compared with HbAA 0.72 IU ml−1 (p<0.01). These data were also previously published (Citation18).
Free protein S
Free PS values were significantly lower in crisis 0.49 IU ml−1 (0.42–0.64, p<0.001) compared with HbAA 0.85 IU ml−1 (0.72–0.97) and steady-state 0.65 IU ml−1 (0.58–0.79, p<0.05). Steady state (p<0.01), HU 0.65 IU ml−1 (0.56–0.74, p<0.01) and transfusion 0.59 IU ml−1 (0.47–0.71, p<0.01) were also lower than HbAA. These data were also previously published (Citation18).
Endothelin-1
Big ET-1 levels were significantly reduced in crisis 40.5 pmol L−1 (9.25–46.3) and HU 43.6 pmol L−1 (12.6–49.6,) compared with HbAA 55.1 pmol L−1 (45.2–63.9, p<0.05). Upon observing a clear division within the crisis group above and below 30 pmol L−1, subsequently this group was subdivided into chest-related and non-chest-related crisis sub-groups. This resulted in a significant difference between chest crisis 41.5 pmol L−1 (38.3–47.1) and non-chest crisis 7.5 pmol L−1 (5.3–33.7, p<0.05) ( and ).
Adrenomedullin
Overall, pro-ADM levels were raised in chest crisis: 0.38 nmol L−1 (0.31–0.49) versus steady state: 0.27 nmol L−1 (0.25–0.32; p<0.01) and control: 0.28 nmol L−1 (0.27–0.31; p<0.01). CT-proET-1 levels were reduced in patients on HU therapy: 43.6 pmol L−1 (12.6–49.6) versus control: 55.1 pmol L−1 (45.2–63.9; p<0.05) ( and and Table ).
Fig. 6. ADM and ET-1, NO and ADM crises by type.
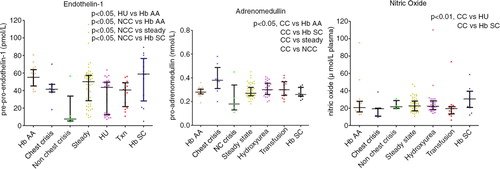
Fig. 7. NO, ET-1 and ADM subdivided by crises type (chest crises versus other).
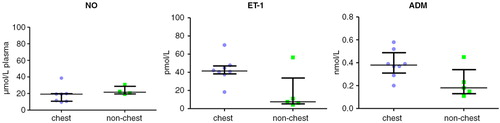
Table II. Statistical analysis of indicators of efficacy
Nitric oxide
NO levels were significantly lower in chest crisis 19.3 µmol L−1 plasma (10.7–19.9) compared with HU 22.2 µmol L−1 plasma (18.3–28.4; p<0.05), HbSC 30.6 µmol L−1 plasma (20.8–39.5; p<0.05) and approach significance when compared with steady state 22.5µmol L−1 plasma (16.9–28.2; p=0.07) ( and ).
Discussion
The pathophysiology of the vaso-occlusive mechanisms in SCA is only partially understood. Moreover, the disease clinical phenotype is quite variable within subjects: for instance, it is not clear why some patients have a low degree of disease developing only mild crises or even none, while others manifest life-threatening events, such as chest crises. The aetiology of crises in SCA is multifactorial and is supported by stochastically dynamic events; therefore, the understanding of crises mechanisms has to take into consideration more aspects (Citation26). Our study is an attempt to explore further the SCA pathophysiology: MP generation, anticoagulant pathway and endothelial vascular markers.
Microparticles
MP participate in the pathophysiology of numerous vascular conditions (Citation4). Moreover, studies on SCA have shown that monocyte–PLT aggregates (Citation13) and PLT–RBC aggregates (Citation15) are increased during crises, suggesting that cell-derived MP may be involved in SCA pathophysiology. Nonetheless, the knowledge on cell-derived MP and MP-cell aggregates in SCA are confined to few studies, none of them on children. A previous study conducted by Shet et al. (Citation16) reported elevated levels of MP positive for AV (a phosphatidylserine marker) and the presence of monocyte-derived MP (MoMP) bearing TF during sickle cell crisis, suggesting an on-going procoagulant activity in SCA. Shet et al., reported increased MP total numbers in crises compared with steady state and controls, and showed increased levels of MoMP bearing TF during crises, suggesting a MP procoagulant activity in SCA. Comparing ours results with these previous studies, a relevant discrepancy on absolute MP numbers in crises is seen, with significant reduction in crises in our study. In the study by Shet et al., the control group that was heterogeneous (subjects with HbAS, autoimmune hemolytic anaemia and pyruvate kinase deficiency), similar to the study group (patients in crises and steady state) were considered together. The remaining patients were observed in steady-state only, but all of those had a previous history of crises and all were on treatment with HU, which indeed we shown that they increase MP numbers.
Conversely, our study showed a reduced number of MP in crises. Also, our crises patients were not on HU treatment, suggesting that the 2 studies are not comparable as shown in Appendix 1. In our study the finding of reduced MP numbers in crises was consistent through all our analysis. Also, in TXN and HU subgroups, MP numbers were higher and similar to those of healthy (HbAA) controls, suggesting that both treatments (HU and TXN) return MP within normal values. Our finding is further supported by the recent work of Brunetta et al. (Citation27) showing increased MP in patients on HU treatment. In keeping with our finding, Nouboussie and colleagues recently showed a higher number of PMP in steady state versus control (Citation28).
Both these studies have stringent definitions for control and study groups.
Kasar et al. (Citation29) reported increased number of MP in SCA versus healthy controls; however, once again the SCA group was not homogeneous (including adult patients with HbSS and HbSβ+/0 together). Simak et al. (Citation30) showed increased EMP (CD105+; CD144+) levels in SCA, but again only patients with a history of crises on HU treatment were considered and the group was too heterogeneous including healthy subjects with HbAA and others with a diagnosis of aplastic anaemia and PNH, not age or ethnicity matched.
Joop et al. (Citation31), in a multiorgan failure study, reported on reduced numbers of MP and also suggested that MP adhesion to EC and circulating blood cells may occur. Similar findings have been reported by Chirinos et al. (Citation32). Furthermore, Keuren et al. (Citation33) demonstrated MP aggregation to surface coated with fibrinogen, von Willebrand factor (vWF) and collagen, supporting the idea of MP–endothelial adhesion. Reduced MP numbers may therefore be the result of aggregates formation between EMP, PLT and other cells. Indeed, Jy et al. (Citation34) reported that EMP express ultra large von Willebrand multimers, which promote EMP–PLT aggregates formation. These hypothesis may certainly explain our findings and in part explain SCA pathophysiology.
A key issue on MP study has been the methodology. The flow-cytometry methodology for MP detection is based on accurate gating area setting (Citation8). Another relevant difference between our study and previous MP studies was in respect of MP samples preparation. Ultracentrifugation has been employed successfully in the study of intracellular proteins involved in MP generation (e.g. calpain) (Citation35, Citation36), but not in clinical studies on MP. Conversely, our centrifugation steps and MP methodology had been previously validated (Citation37), and findings on MP analogous to ours had been already reported in other vascular-prothrombotic conditions (Citation38).
MP functional markers
When functional MP markers were analysed, we saw a high correlation between PMP (CD61+ and CD42+) numbers and total MP numbers (Annexin V+), with PMP numbers overall decreased in crises. PMP level may be reduced in crises because of increased PMP adhesion to collagen, fibrinogen and vWF. As already reported, PMP-collagen binding via αIIbβ3 integrin and PMP-vWF binding via GPIα may occur (Citation32). These studies support our findings of reduced PMP during crises, suggesting that PMP would be rapidly cleared from circulation as also shown in an in vitro experiment by Rand et al. (Citation39).
Blood-borne TF
Circulating MP have been suggested to behave as a reservoir for TF (CD142), also known as blood-borne TF (Citation12). In our study, all samples were tested for CD142 (data not shown); however, this marker was not consistently detected. In a recent overview, Morel et al. (Citation12) highlighted that MP–TF+ are marginally present, unless endothelial activation occurs, such as in the case of LPS, antiphospholipid antibodies for Chlamydia pneumoniae infections. The same author suggested that PMP CD62P+ bind TF at sites of endothelium injury. Therefore, PMP may carry TF, but TF expression on PMP surface may not necessarily occur, as TF may be encrypted in MP (Citation12). TF may simply be transferred from PLT by interactions of PSGL-1/P-selectin mediated without exposure on cell surface. For these reasons, MP-TF+ would be unlikely to be detected measuring MP-CD142. As PLT-WCC or PLT–RBC aggregates have been reported in SCA (Citation10), we speculate that MP aggregates of different cell types are generated during crises, reflecting the overlap in percentages from different MP markers, which occurs in this study. These MP aggregates would have higher size than MP and remain excluded during MP flow cytometry gating. Also, MP aggregates may participate in the adhesion process to vWF and collagen as already discussed.
Protein C
As part of this study involved measuring PC and PS, the expression of endothelial PC receptor (EPCR; CD201) was measured in all subgroups and previously reported (Citation18). Interestingly, a correlation was seen between percentage of MP CD201+ and MP CD14+ (R=0.627, p<0.001), supporting previous reports on MoMP bearing EPCR, released in the presence of APC (Citation40). MP CD201+ percentage was higher in crisis (11.6%) compared with all other subgroups, and this was significant when compared with control HbAA (3.2%, p<0.05). Moreover, the finding of a significant correlation between MP CD235a versus CD201 (R=0.48; p<0.001) and even higher within the crises subgroup (R=0.66 and p<0.001) suggests that when crises occur the increased production of red cell derived MP would enhance PC activation pathway. Our finding of reduced PC and free-PS levels in crises very likely reflects an accelerated consumption of APC. APC generation may be accelerated by raised MP EPCR+. We have shown that in patients with crises history who received transfusions or HU treatment, PC and PS levels are returned to normal ranges, suggesting that the consumption of these proteins during crises is alleviated by both treatments (18). Other groups (Citation41–Citation43) reported significant reduction of PC and PS levels in adult patients with SCA in steady state, compared with controls. Our group already showed reduced PC and free-PS levels in children in steady state with further reduction in crisis (Citation18). Although reduced PC levels are not as dramatic as those reported in sepsis (Citation44), nevertheless this warrants further investigations. Early reports of a benefit of tinzaparin in SCA patients also support these findings (Citation45). Another hypothesis that could explain these findings is that MP in SCA may, overall, have an anti-coagulant effect: MP diminution during crises would facilitate procoagulant events and vaso-occlusion. The possibility that MP sustain anticoagulation was first highlighted by Berckmans et al. (Citation5). This author reported an inverse correlation between MP numbers, associated thrombin-generation and thrombin–antithrombin complex in plasma, MP would promote low amounts of thrombin generation and this in turn would activate PC into APC.
ADM, NO and ET-1 relationships
Other aspects considered in this study focused on the comprehension of vascular NO/ET-1-dependent mechanisms. The notion that free-Hb scavenge NO is currently believed to be the primum movens in the pathophysiology of SCA vaso-occlusion (Citation46). Our findings of reduced NO values during crisis are in keeping with the literature. Moreover, the presence of raised NO values in patients on HU confirms the early hypotheses that HU behaves as NO donor (Citation47). Similarly, lower NO values in patients on regular transfusions suggest that this approach is not as efficacious as HU. However, our study suffers limitations because NO measurements have been performed on one occasion only and none sequentially before, during and after treatment. Nonetheless, it is intriguing to note that recent studies have suggested that red-cell transfusion may reduce NO and increase mortality in patients with acute coronary syndromes MI (Citation48).
The finding of raised bilirubin, LDH and reticulocytes during crisis is in keeping with the current notions of SCA and confirms that our subgroups’ samples were correctly taken (Table –III ).
Table III. Adrenomedullin (ADM), endothelin-1 (ET-1) and nitric oxide (NO) levels in SCA patients and controls
The possibility of a link between hemolysis/free-Hb oxidation and the RAA pathway is intriguing. Studies on artificial blood and on hemoglobin oxygen carriers have shown that free-Hb is further oxidized into ferryl-Hb (Fe4+) (Citation49, Citation50) and have suggested that ferryl-Hb (Fe4+) endorse an angiotensin-converting enzyme (ACE)-like action and is therefore capable of generating angiotensin II and ET-1 production.
In our study, the measurements of pre-big ET-1 reflect its conversion in ET-1. As expected, a strong conversion of pre-ET-1 into ET-1 was found in crisis and was significantly different compared with all other subgroups (p=0.01). The finding of reduced values in the therapy groups (HU and transfusion) could be interpreted in a similar manner suggesting that therapy slows down pre-ET-1 conversion in ET-1. Alternatively, it could be inferred that pre-ET-1 production is down-regulated by disease-modifying agents.
ADM counterbalances ET-1 effects (Citation51). Also, over time SCA patients are prone to develop kidney tubular papilla necrosis, because of vaso-occlusive renal events. This chronic renal damage impairs tubular Na+ re-adsorption mediated by aldosterone/angiotensin-II, leading sickle cell patients to hyposthenuria and to have a salty diet. The impossibility to concentrate urine generate a vicious circle with on-going RAA/ET-1 activation. The loss of urinary Na+ is followed by water loss and dehydration, red cell sickling, endothelial cells adhesion and crisis (Citation52). In physiological conditions, aldosterone, ET-1, angiotensin II and hypernatremia stimulate ADM release (Citation22). Therefore, it is tempting to speculate that in SCA the above-described vicious circle further raises ADM production. Our findings of raised ADM values in patients in crises support these hypotheses. Moreover, the presence of highly raised ADM values during chest crisis is intriguing. Raised ADM values have already been reported in diseases where increased pulmonary vascular resistance is found, the possibility of ADM induced ETB clearance of ET-1 receptor in pulmonary vessel has been suggested (Citation53). Furthermore, ADM has been reported to act as a bronchodilator (Citation54, Citation55).
If other groups confirm our finding, ADM might be indicated as a useful marker for monitoring SCA and possibly for predicting chest crisis. Further studies are therefore warranted to better clarify these new aspects of SCA physiopathology.
Conflict of interest and funding
The authors have not received any funding or benefits from industry or elsewhere to conduct this study.
Acknowledgements
We are grateful to Ms Ruth Larraghy (Haematology Laboratory, UCD, Dublin) for the MP sample preparation. We are also very grateful to Dr Rienke Nieuwland and M Anita Boing from AMC Amsterdam for their kind support in facilitating the use of ultracentrifugation and the comparison methodologies study (see Appendix 1). We are deeply grateful to the Onlus Butterfly, Ms Wirth Birgit and the community of Kaltern South Tyrol, Italy and to Ms Sara Endrizzi and the Charity Association Onlus Chernobil Alto Adige – for helping with fund raising and all the support they have given to our research. This work is also part of the PhD thesis of Dr Andrea Piccin entitled “New insights in Sickle Cell Anaemia Pathophysiology”. This thesis was discussed and fully approved at Trinity College University, Dublin, Ireland.
Related Research Data
References
- Jimenez JJ, Jy W, Mauro LM, Soderland C, Horstman LL, Ahn YS. Endothelial cells release phenotypically and quantitatively distinct microparticles in activation and apoptosis. Thromb Res. 2003; 109: 175–80.
- Shcherbina A, Remold-O'Donnell E. Role of caspase in a subset of human platelet activation responses. Blood. 1999; 93: 4222–31.
- Hugel B, Weltin D, Holl V, Marchal J, Dufour P, Freyssinet JM et al. Assessment of apoptosis occurring in spleen cells from nitrogen mustard-treated or gamma-irradiated mice. Anticancer Res. 1998; 18: 3289–94.
- Piccin A, Murphy WG, Smith OP. Circulating microparticles: pathophysiology and clinical implications. Blood Rev. 2007; 21: 157–71.
- Berckmans RJ, Neiuwland R, Böing AN, Romijn FP, Hack CE, Sturk A. Cell-derived microparticles circulate in healthy humans and support low grade thrombin generation. Thromb Haemost. 2001; 85: 639–46.
- Sims PJ, Wiedmer T, Esmon CT, Weiss HJ, Shattil SJ. Assembly of the platelet prothrombinase complex is linked to vesiculation of the platelet plasma membrane. Studies in Scott syndrome: an isolated defect in platelet procoagulant activity. J Biol Chem. 1989; 264: 17049–57.
- Satta N, Toti F, Feugeas O, Bohbot A, Dachary-Prigent J, Eschwège V et al. Monocyte vesiculation is a possible mechanism for dissemination of membrane-associated procoagulant activities and adhesion molecules after stimulation by lipopolysaccharide. J Immunol. 1994; 153: 3245–55.
- Nieuwland R, Berckmans RJ, McGregor S, Böing AN, Romijn FP, Westendorp RG et al. Cellular origin and procoagulant properties of microparticles in meningococcal sepsis. Blood. 2000; 95: 930–5.
- Dahlbäck B, Wiedmer T, Sims PJ. Binding of anticoagulant vitamin K-dependent protein S to platelet-derived microparticles. Biochemistry. 1992; 31: 12769–77.
- Tans G, Rosing J, Thomassen MC, Heeb MJ, Zwaal RF, Griffin JH. Comparison of anticoagulant and procoagulant activities of stimulated platelets and platelet-derived microparticles. Blood. 1991; 77: 2641–8.
- Horstman LL, Jy W, Jimenez JJ, Bidot C, Ahn YS. New horizons in the analysis of circulating cell-derived microparticles. Keio J Med. 2004; 53: 210–30.
- Morel O, Morel N, Freyssinet JM, Toti F. Platelet microparticles and vascular cells interactions: a checkpoint between the haemostatic and thrombotic responses. Platelets. 2008; 19: 9–23.
- Wun T, Paglieroni T, Tablin F, Welborn J, Nelson K, Cheung A. Platelet activation and platelet-erythrocyte aggregates in patients with sickle cell anemia. J Lab Clin Med. 1997; 129: 507–16.
- Wun T, Paglieroni T, Rangaswami A, Franklin PH, Welborn J, Cheung A et al. Platelet activation in patients with sickle cell disease. Br J Haematol. 1998; 100: 741–9.
- Wun T, Cordoba M, Rangaswami A, Cheung AW, Paglieroni T. Activated monocytes and platelet-monocyte aggregates in patients with sickle cell disease. Clin Lab Haematol. 2002; 24: 81–8.
- Shet AS, Aras O, Gupta K, Hass MJ, Rausch DJ, Saba N et al. Sickle blood contains tissue factor-positive microparticles derived from endothelial cells and monocytes. Blood. 2003; 102: 2678–83.
- Tomer A, Harker LA, Kasey S, Eckman JR. Thrombogenesis in sickle cell disease. J Lab Clin Med. 2001; 137: 398–407.
- Piccin A, Murphy C, Eakins E, Kinsella A, McMahon C, Smith OP et al. Protein C and free protein S in children with sickle cell anemia. Ann Hematol. 2012; 91: 1669–71.
- Telen MJ. Role of adhesion molecules and vascular endothelium in the pathogenesis of sickle cell disease. Hematology Am Soc Hematol Educ Program. 2007; 84–90.
- Gladwin MT, Crawford JH, Patel RP. The biochemistry of nitric oxide, nitrite, and hemoglobin: role in blood flow regulation. Free Radic Biol Med. 2004; 36: 707–17.
- Chaar V, Tarer V, Etienne-Julan M, Diara JP, Elion J, Romana M. ET-1 and eNOS gene polymorphisms and susceptibility to acute chest syndrome and painful vaso-occlusive crises in children with sickle cell anemia. Haematologica. 2006; 91: 1277–8.
- Rossi GP, Sacchetto A, Cesari M, Pessina AC. Interactions between endothelin-1 and the renin-angiotensin-aldosterone system. Cardiovasc Res. 1999; 43: 300–7.
- Biró E, Sturk-Maquelin KN, Vogel GM, Meuleman DG, Smit MJ, Hack CE et al. Human cell-derived microparticles promote thrombus formation in vivo in a tissue factor-dependent manner. J Thromb Haemost. 2003; 1: 2561–8.
- Morgenthaler NG, Struck J, Alonso C, Bergmann A. Measurement of midregional proadrenomedullin in plasma with an immunoluminometric assay. Clin Chem. 2005; 51: 1823–9.
- Papassotiriou J, Morgenthaler NG, Struck J, Alonso C, Bergmann A. Immunoluminometric assay for measurement of the C-terminal endthelin-1 precursor fragment in human plasma. Clin Chem. 2006; 52: 1144–51.
- McMahon RP, Waclawiw MA, Geller NL, Barton FB, Terrin ML, Bonds DR. An extension of stochastic curtailment for incompletely reported and classified recurrent events: the multicenter study of hydroxyurea in sickle cell anemia (MSH). Control Clin Trials. 1997; 18: 420–30.
- Brunetta DM, De Santis GC, Silva-Pinto AC, Oliveira de Oliveira LC, Covas DT. Hydroxyurea increases plasma concentrations of microparticles and reduces coagulation activation and fibrinolysis in patients with sickle cell anemia. Acta Haematol. 2015; 133: 287–94.
- Noubouossie DC, Lê PQ, Rozen L, Debaugnies F, Ferster A, Demulder A. Evaluation of the procoagulant activity of endogenous phospholipids in the platelet-free plasma of children with sickle cell disease using functional assays. Thromb Res. 2012; 130: 259–64.
- Kasar M, Boğa C, Yeral M, Asma S, Kozanoglu I, Ozdogu H. Clinical significance of circulating blood and endothelial cell microparticles in sickle-cell disease. J Thromb Thrombolysis. 2014; 38: 167–75.
- Simak J, Holada K, Risitano AM, Zivny JH, Young NS, Vostal JG. Elevated circulating endothelial membrane microparticles in paroxysmal nocturnal haemoglobinuria. Br J Haematol. 2004; 125: 804–13.
- Joop K, Berckmans RJ, Nieuwland R, Berkhout J, Romijn FP, Hack CE et al. Microparticles from patients with multiple organ dysfunction syndrome and sepsis support coagulation through multiple mechanisms. Thromb Haemost. 2001; 85: 810–20.
- Chirinos JA, Heresi GA, Velasquez H, Jy W, Jimenez JJ, Ahn E et al. Elevation of endothelial microparticles, platelets, and leukocyte activation in patients with venous thromboembolism. J Am Coll Cardiol. 2005; 45: 1467–71.
- Keuren JF, Magdeleyns EJ, Bennaghmouch A, Bevers EM, Curvers J, Lindhout T. Microparticles adhere to collagen type I, fibrinogen, von Willebrand factor and surface immobilised platelets at physiological shear rates. Br J Haematol. 2007; 138: 527–33.
- Jy W, Jimenez JJ, Mauro LM, Horstman LL, Cheng P, Ahn ER et al. Endothelial microparticles induce formation of platelet aggregates via a von Willebrand factor/ristocetin dependent pathway, rendering them resistant to dissociation. J Thromb Haemost. 2005; 3: 1301–8.
- Kelton JG, Warkentin TE, Hayward CP, Murphy WG, Moore JC. Calpain activity in patients with thrombotic thrombocytopenic purpura is associated with platelet microparticles. Blood. 1992; 80: 2246–51.
- Ljungsted I, Ekman B, Sjöholm I. Detection and separation of lymphocytes with specific surface receptors, by using microparticles. Biochem J. 1978; 170: 161–5.
- Nieuwland R, Berckmans RJ, Rotteveel-Eijkman RC, Maquelin KN, Roozendaal KJ, Jansen PG et al. Cell-derived microparticles generated in patients during cardiopulmonary bypass are highly procoagulant. Circulation. 1997; 96: 3534–41.
- VanWijk MJ, Boer K, Berckmans RJ, Meijers JC, van der Post JA, Sturk A et al. Enhanced coagulation activation in preeclampsia: the role of APC resistance, microparticles and other plasma constituents. Thromb Haemost. 2002; 88: 415–20.
- Rand ML, Wang H, Bang KW, Packham MA, Freedman J. Rapid clearance of procoagulant platelet-derived microparticles from the circulation of rabbits. J Thromb Haemost. 2006; 4: 1621–39.
- Pérez-Casal M, Downey C, Fukudome K, Marx G, Toh CH. Activated protein C induces the release of microparticle-associated endothelial protein C receptor. Blood. 2005; 105: 1515–22.
- Francis RB Jr. Protein S deficiency in sickle cell anemia. J Lab Clin Med. 1988; 111: 571–6.
- Schnog JB, Mac Gillavry MR, van Zanten AP, Meijers JC, Rojer RA, Duits AJ et al. Protein C and S and inflammation in sickle cell disease. Am J Hematol. 2004; 76: 26–32.
- Wright JG, Malia R, Cooper P, Thomas P, Preston FE, Serjeant GR. Protein C and protein S in homozygous sickle cell disease: does hepatic dysfunction contribute to low levels?. Br J Haematol. 1997; 98: 627–31.
- Piccin A, O'Marcaigh A, Mc Mahon C, Murphy C, Okafor I, Marcheselli L et al. Non-activated plasma-derived PC improves amputation rate of children undergoing sepsis. Thromb Res. 2014; 134: 63–7.
- Qari MH, Aljaouni SK, Alardawi MS, Fatani H, Alsayes FM, Zografos P et al. Reduction of painful vaso-occlusive crisis of sickle cell anaemia by tinzaparin in a double-blind randomized trial. Thromb Haemost. 2007; 98: 392–6.
- Wood KC, Hsu LL, Gladwin MT. Sickle cell disease vasculopathy: a state of nitric oxide resistance. Free Radic Biol Med. 2008; 44: 1506–28.
- King SB. Nitric oxide production from hydroxyurea. Free Radic Biol Med. 2004; 37: 737–44.
- Rao SV, Jollis JG, Harrington RA, Granger CB, Newby LK, Armstrong PW et al. Relationship of blood transfusion and clinical outcomes in patients with acute coronary syndromes. JAMA. 2004; 292: 1555–62.
- Alayash AI. Hemoglobin-based blood substitutes and the hazards of blood radicals. Free Radic Res. 2000; 33: 341–8.
- Simoni J, Simoni G, Moeller JF, Tsikouris JP, Wesson DE. Evaluation of angiotensin converting enzyme (ACE)-like activity of acellular hemoglobin. Artif Cells Blood Substit Immobil Biotechnol. 2007; 35: 191–210.
- Schuetz P, Christ-Crain M, Morgenthaler NG, Struck J, Bergmann A, Müller B. Circulating precursor levels of endothelin-1 and adrenomedullin, two endothelium-derived, counteracting substances, in sepsis. Endothelium. 2007; 14: 345–51.
- Bookchin RM, Balazs T, Landau LC. Determinants of red cell sickling. Effects of varying pH and of increasing intracellular hemoglobin concentration by osmotic shrinkage. J Lab Clin Med. 1976; 87: 597–616.
- Dschietzig T, Richter C, Asswad L, Baumann G, Stangl K. Hypoxic induction of receptor activity-modifying protein 2 alters regulation of pulmonary endothelin-1 by adrenomedullin: induction under normoxia versus inhibition under hypoxia. J Pharmacol Exp Ther. 2007; 321: 409–19.
- von der Hardt K, Kandler MA, Chada M, Cubra A, Schoof E, Amann K et al. Brief adrenomedullin inhalation leads to sustained reduction of pulmonary artery pressure. Eur Respir J. 2004; 24: 615–23.
- Nagaya N, Kyotani S, Uematsu M, Ueno K, Oya H, Nakanishi N et al. Effects of adrenomedullin inhalation on hemodynamics and exercise capacity in patients with idiopathic pulmonary arterial hypertension. Circulation. 2004; 109: 351–6.
Appendix 1
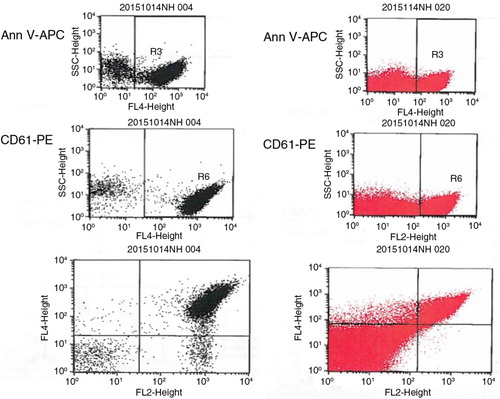
We performed an additional study to compare our methodology by Biró et al. (Citation23) versus the previous one reported by Shet et al. (Citation16), which was also used for the first study published on MP in SCA. To perform this analysis, plasma aliquots obtained from the same children with SCA were processed for comparison. Samples were then analysed using the same FACS instrument. The following key differences were seen:
(a) In the Shet's study, ultracentrifugation at 100,000×g twice for 60 minutes was used, while in our study the centrifugation procedures were performed at 18,890×g twice for 30 minutes at 20°C.
(b) The gating area in the method used by Shet et al. is quite large. Moreover, a clear demarcation between MP and noise is lacking.
(c) MP numbers. We processed the same amount of plasma (250 µl) with both methods. According to Shet et al., a volume of 90 µl is taken from a final volume of 1,250 µl before FACS analysis (without taking into account 10 µl for each antibody). According to Biró et al., a volume of 5 µl is taken from a final volume of 100 µl before FACS analysis (without taking into account 5 µl for each antibody). This processing difference should account for an approximate numerical difference in MP 6 times higher using the Shet et al. method, as reported below:
Biró et al. calculation:
N×(955/27.5)×(100/5)×(1,000/250)
N=events=(events for each Ab – number of events for each isotype)
955=total µl
27.5=µl/30 seconds=reading time
100/250=Ab dilution in µl
1,000/250=plasma dilution in µl
Shet et al. calculation:
N×(310/31)×(1,000/90)×(1,000/250)
N=events=(events for each Ab – number of events for each Isotype)
955=total µl
31=µl/30 seconds=reading time
1,000/90=Ab dilution in µl
1,000/250=plasma dilution in µl
We run plasma samples of SCA children using both methods. When we looked at PMP staining for CD61 and AnnV, we found the following values:
with Biró et al., N=1,786=(1,807–21); giving a final value of PMP/ml=49,618
with Shet et al., N=1,011=(1,023–12); giving a final value of PMP/ml=4,493
Note the same FACS Calibur flow cytometer with CellQuest pro software (Becton Dickinson) was used to compare methods.
In conclusion, this analysis shows that the methodologies used for MP identification by Biró et al. (Citation23) and Shet et al. (Citation16) produce different and not comparable results.
Fig. A1. From the top to the bottom: staining for AV, for CD61 and for AV & CD61 (PMP). Gating area using the methodology by Shet et al. (Citation16) (red, right) and this by Biró et al. (Citation23) (black, left). No clear demarcation is seen between MP and noise.