
Abstract
Daily exposure of humans to nanoparticles from edible plants is inevitable, but significant advances are required to determine whether edible plant nanoparticles are beneficial to our health. Additionally, strategies are needed to elucidate the molecular mechanisms underlying any beneficial effects. Here, as a proof of concept, we used a mouse model to show that orally given nanoparticles isolated from ginger extracts using a sucrose gradient centrifugation procedure resulted in protecting mice against alcohol-induced liver damage. The ginger-derived nanoparticle (GDN)–mediated activation of nuclear factor erythroid 2-related factor 2 (Nrf2) led to the expression of a group of liver detoxifying/antioxidant genes and inhibited the production of reactive oxygen species, which partially contributes to the liver protection. Using lipid knock-out and knock-in strategies, we further identified that shogaol in the GDN plays a role in the induction of Nrf2 in a TLR4/TRIF-dependent manner. Given the critical role of Nrf2 in modulating numerous cellular processes, including hepatocyte homeostasis, drug metabolism, antioxidant defenses, and cell-cycle progression of liver, this finding not only opens up a new avenue for investigating GDN as a means to protect against the development of liver-related diseases such as alcohol-induced liver damage but sheds light on studying the cellular and molecular mechanisms underlying interspecies communication in the liver via edible plant–derived nanoparticles.
To access the supplementary material to this article, please see Supplementary files under ‘Article Tools’.
Recently, nanoparticles have been isolated and identified from edible plants including ginger (Citation1, Citation2) and lemon (Citation3). Numerous naturally occurring nanoparticles exist in our diet and are absorbed through the intestine daily. Whether nanoparticles from plants we eat daily can pass from the intestine to the liver, and subsequently, have a biological effect on the liver is poorly defined.
Studies show that ginger has a hepatoprotective effect against ethanol, carbon tetrachloride and acetaminophen-induced hepatotoxicity (Citation2). Shogaols, dehydrated analogues of the gingerols, have been a major focus of in vitro research related to the anti-inflammatory effects of ginger (Citation3). To date, however, most of the data presented are derived from using shogaol-enriched ginger extract. The biological effect of shogaols in the context of ginger has not been investigated.
Edible plant–derived nanoparticles are present in the extracts of ginger and consist of proteins, lipids and RNAs (Citation2). Emerging evidence suggests that exosomes can transfer information including lipids into recipient cells (Citation4–Citation6). Exosomes including mammalian cell–derived exosomes encapsulate more than 100 different lipids, and the biological effects of exosomal lipids on recipient cells have not been studied in detail. In addition, it is very difficult in determining the biological effect of individual exosomal lipids on the recipient cells with current approaches in general.
The liver receives numerous and varied biological insults daily. The induction of cytoprotective enzymes, including antioxidant and carcinogen-detoxification enzymes, is critical for maintaining hepatic homeostasis and preventing injury from absorbed endotoxin. Nuclear factor erythroid 2-related factor 2 (Nrf2) transcriptionally controls the gene expression of many cytoprotective enzymes and plays an important role in protecting liver against insults (Citation7–Citation9).
We have recently shown that nanoparticles isolated from grape and grapefruit can modulate mouse stem cell and macrophage behaviour and protect mice against dextran sulphate sodium (DSS)–induced colitis. In this study, we hypothesized that unlike the free form of shogaols, shogaols carried by ginger-derived nanoparticles (GDNs) can be target-delivered to hepatocytes and protect mice from alcohol-induced liver injury.
Materials and methods
Isolation and characterization of GDENs
Fresh ginger rhizome roots were purchased from a local market and washed 3× with PBS. A total of 200 g of washed roots were ground in a mixer (Osterizer 12-speed blender) at the highest speed for 10 min (pause 1 min for every 1 min blending). Ginger juice was then sequentially centrifuged at 1,000g for 10 min, 3,000g for 20 min and 10,000g for 40 min. After 10,000g centrifugation, the pellet was resuspended in PBS and referred to as microparticles. The supernatant was then centrifuged at 150,000g for 90 min, the pellet was resuspended in PBS and transferred to a sucrose step gradient (8%/30%/45%/60%) and centrifuged at 150,000g for 120 min. The bands between the 8%/30% layer and the 30%/45% layer were harvested separately and noted as GDN and GDEN2. The protein concentration of the samples was determined using a BCA assay kit (Thermo Scientific).
Mice
C57BL/6j mice, 6–8 weeks of age, were obtained from Jackson Laboratories. MyD88, TRIF, and TLR4 KO mice on a B6 background were kindly provided by Dr. Shizuo Akira (University of Osaka, Osaka, Japan). All animal procedures were approved by the University of Louisville Institutional Animal Care and Use Committee. For the mice alcoholic liver disease model, 8-week-old male C57BL/6j mice were fed a liquid diet containing 5% ethanol for 13 days and on day 14 the mice were gavaged with a single dose of ethanol (5 g/kg body weight, 30% ethanol). The GDN treatment studies were conducted by gavage administering GDN (50 mg/mouse/day) or PBS as a control for 7 days prior to the ethanol diet and then continuously giving the GDN or PBS to the mice after they were fed the 5% ethanol diet. On day 14, after the 30% ethanol feeding, and 9 h post-gavaged with the last GDN treatment, the mice were euthanized, and serum and liver were harvested for examination.
Lipid extraction, TLC and lipidomic analysis
Total lipid extraction of GDENs was performed according to the method of Bligh and Dyer (Citation10), and the lipids were dissolved in chloroform for analysis. The lipid composition was analysed on a triple quadrupole tandem mass spectrometer (API 4000, Applied Biosystems, CA) as previously described (Citation11). The data were reported as percentage of total signal of the molecular species after normalization of the signals to internal standards of the same lipid class.
For TLC analysis, lipids extracted as described above and stranded 6-Shogaol (Sigma-Aldrich, 10 pMol) and 6-Gignerol (Sigma-Aldrich, 10 pMol) were applied on a Silic gel 60Å TLC plate (Whatman) and developed in a mixture of hexane/ethyl acetate/formic acid=55:40:5. For analysis of lipids extracted from ginger, ginger micro-particles, and GDN, TLC was developed with a mixture of toluene–ethyl acetate (3:1, v/v). Developed plates were initially air-dried, then sprayed with CuSO4–phosphoric acid reagent (10% CuSO4 in 8% phosphoric acid), and followed by charring at 100°C for 10 min.
To KO shogaol from GDN lipids, duplicated GDN-derived lipid samples were loaded on the same TLC plate. A standard control of shogaol (Sigma) was loaded next to GDN lipid samples and used to determine the position of shogaol in the GDN lipids loaded on the same TLC plate. After separation on the TLC plate, one of the duplicate GDN-derived lipid samples and the shogaol standard were developed as a reference for the location of GDN shogaol on the TLC plate. The band that had migrated to the same position as the standard shogaol was removed for high-performance liquid chromatography (HPLC) analysis, and the rest of the fractions of GDN lipids in the TLC were collected and extracted with 2 mL of chloroform/methanol (1:1, v/v) and 0.9 mL water. The organic phase samples were aliquoted and dried by heat under nitrogen (0.2 psi). Total lipids were determined using the phosphate assay as described in Ref. (Citation12). For assembling liposome-like nanoparticles (LN), the dried lipids were immediately suspended in distilled water (150–200 µL). After bath-sonication (FS60 bath sonicator, Fisher Scientific, Pittsburgh, PA) for 5 min, an equal volume of buffer (308 mM NaCl, 40 mM HEPES, pH 7.4) was added and sonicated for another 5 min. The charges and sizes of liposome-like nanoparticles were examined using a method as described in Ref. 8.
Particle size and surface charge analysis
The particle size and zeta potential were measured by using Zetasizer Nano S90 as previously described (Citation8).
Atomic force microscope
Specimens were prepared for AFM using a conventional procedure (Citation13). In brief, the GDN was fixed with 2% glutaraldehyde in 0.1 M cacodylate buffer (pH 7.4) for 4 h, at 4°C. After extensively washing with 0.1 M cacodylate buffer (pH 7.4), samples were fixed with 1% osmium tetroxide in 0.1 M cacodylate buffer (pH 7.4) for 1 h at 4°C and dehydrated in a graded ethanol (25% for 20 min, 50% for 20 min, 75% for 20 min, 95% for 20 min, 100% for 30 min and 100% for 30 min). The samples were then examined using a MFP-3D™ AFM scope (Oxford Instrument).
In vitro digestion of GDN
In vitro digestion conditions were based on a previous description (Citation14). In brief, 1 mL of GDN in a water solution was incubated with slow rotation at 37°C for 60 min after the addition of 1.34 µL of 18.5% w/v HCl and 24 µL of a pepsin solution (80 mg/mL in 0.1 N of HCl, pH 2.0, Sigma) to form a stomach-like solution. Then, 80 µL of a mixture containing 24 mg/mL of bile extract and 4 mg/mL of pancreatin (Sigma) in 0.1 M of NaHCO3 was added to the stomach-like solution. The pH of the bulk solution was adjusted to 6.5 with 1 M NaHCO3, which was referred to as an intestinal solution. GDN was incubated for an additional 60 min in the intestinal solution. The stability of GDN was evaluated by measuring particle size and surface charge.
HPLC analysis for shogaol
Lipid extracts from GDN or banded lipids from TLC plate were dried under nitrogen gas and dissolved in methanol. Chromatography was performed on an Agilent 1120 system using an Eclipse plus C18 column. The mobile phase consisted of 20 mM HCl (A)/acetonitrile (B). An aliquot (100 µL, sample or shogaol) was injected and eluted with reagent B (25%) for 6 min, then with a continuous gradient of reagent B from 25 to 100% in 24 min, reagent B (100%) for 2 min, and finally reagent B (25%) for 5 min. The UV detector was set at 283 nm. The analyses were performed at 25°C with a 1 mL/min flow rate.
GDN labelling
For DiR labelling, GDNs (50 mg in 1 mL PBS) were mixed with 1 µL near-infrared lipophilic carbocyanine dye (1,1′-dioctadecyl-3,3,3′,3′-tetramethyl-indotricarbocyanine-iodide, DiR; Invitrogen, Carlsbad, CA, 5 mM in DMSO) and incubated at 22°C for 20 min.
For PKH67 labelling, GDNs (50 mg in 1 mL dilute C) were mixed with 2 µL PKH67 (Sigma, 1 mM in ethanol) and incubated at 37°C for 5 min. Labelling was stopped by adding 1 mL of exosomes-depleted FBS (supernatant of centrifuging at 150,000g for overnight).
For IRDye-700DX labelling, GDNs (5 mg in 1 mL PBS) were mixed with 1 µL IRDye-700DX NHS Ester (5 mg/mL in DMSO) and incubated at 37°C for 2 h.
All unlabelled dye was washed away by centrifugation at 150,000g for 90 min, and labelled GDN pellets were re-suspended in PBS.
Biodistribution and cellular targeting of orally administrated GDN
After orally administering 50 mg of either DiR or PKH26 fluorescent dye (Sigma) labelled GDN, mice were sacrificed at different time points and small intestine, colon, MLN, spleen and liver tissues were used for imaging. DiR fluorescent signal was detected and measured using the Imaging Station 4,000 mm PRO (Kodak Carestream) and quantified using the Carestream MI software. PKH26 signal in frozen tissue sections was observed using the Nikon A1R Confocal system.
For tracing GDN traffic in blood, IRDye-700DX and PKH67 double-labelled GDN (200 µg) were orally administrated into naïve mice or mice fed with liquid alcoholic diet (6 h after final binge). Plasma samples were collected at different time points. Each of the plasma samples (40 µL) collected was mixed with 60 µL PBS, loaded into 96-well plates and scanned by LI-COR Scanner. The amount of GDN in plasma was calculated based on the standard curve made from IRDye-700DX labelled GDN. A standard curve was created by plotting the mean absorbance for each IRDye-700DX labelled GDN standard diluted in naïve mouse plasma against the GDN protein concentration. The amount of GDN in plasma after intravenous injection of IRDye-700DX labelled GDN (10 µg) was determined using the same method as described above for gavage administration.
To further validate the data generated from the protocol described above, mice were gavage-given IRDye-700DX and DiR double-labelled GDN (200 µg) or PBS as a control. Forty-five minutes after the oral administration, plasma was collected and diluted in PBS at 1:10 and pelleted by ultracentrifugation at 150,000g for 2 h. The pellets were scanned for measuring the intensity of the fluorescence signal of IRDye-700DX and DiR using the LI-COR. The fold changes of fluorescent intensity are expressed as fluorescent intensity of the pellets purified from GDN-treated mice/PBS-treated mice.
AST and ALT measurement
To test for hepatotoxicity, levels of ALT and AST activity in serum were measured using the Infinity Enzymatic Assay Reagent (Thermo Scientific).
H&E staining and immunofluorescence staining
For histopathology, H&E staining was performed on paraffin-embedded liver sections. For immunofluorescence analysis, intestinal tissues or liver tissues were fixed in cold 2% paraformaldehyde solution for 2 h at 4°C. Fixed tissues were dehydrated in graded sucrose solution in PBS (5% for 2 h, 10% for 2 h and 20% overnight) at 4°C. OCT (TissueTek)-embedded tissues were frozen fixed at −80°C. Slides were hydrated in PBS and stained with a rat monoclonal anti-CD31 (390, eBioscience), a goat polyclonal anti-Lyve-1 (R&D system), a mouse anti-albumin antibody (R&D system) or a rat anti-mouse F4/80 (Biolegend). After washing, cells were stained with an Alexa Fluor 488 labelled rabbit anti-mouse, a goat anti-rat or a donkey anti-goat antibody (Invitrogen Life Sciences). For staining with Nrf2 antibody, primary hepatocytes fixed in cold 4% paraformaldehyde for 20 min were permeabilized with 1% Triton-X 100 in PBS for 2 min on ice, followed by blocking with 5% BSA in PBS containing 0.1% Triton-X 100 for 1 h. The hepatocytes were then stained with a rabbit anti-mouse Nrf2 polyclonal antibody (Santa Cruz Biotechnology) for 2 h at 22°C. After washing, cells were stained with an Alexa Fluor 488 labelled goat anti-rabbit antibody (Invitrogen Life Sciences). Slides were stained with DAPI (4,6-diamidino-2-phenylindole; S36938; Molecular Probes and Invitrogen Life Sciences) for 90 s and mounted using fluorogel with Tris buffer (Electron Microscopy Science). The stained hepatocytes or the stained sliced liver or intestinal tissues were assessed using a Nikon A1R Confocal system. Fold changes in Nrf2 nuclear translocation between treatments and controls were determined by the following method. To quantify the nuclear to cytoplasmic ratios of Nrf2 distribution, we used the DAPI image of nuclei and applied a mask to segment the Nrf2 image to obtain nuclear Nrf2 content. Then, the intensity of Nrf2 florescent imaging from the cell minus its nuclear Nrf2 content was taken as the cytoplasmic Nrf2. The ratios were then obtained for each nucleus–cytoplasm pair of a hepatocyte. Using a confocal microscope, a total of 5 fields for each treatment were analysed. Mean ratios of each treatment were then calculated using the following formula: mean ratios=the sum of ratios obtained from Nrf2 florescent intensity of nucleus/cytoplasm of each cell divided by the total numbers of cell analysed. Data are represented as mean fold change obtained from comparing GDENs or LN treated to PBS-treated hepatocytes. Data are mean±SEM (n=5) (*p<0.05, *p<0.01).
Primary hepatocyte isolation, culture and uptake of GDENs
Hepatocytes were isolated from 8-week-old adult C57/B6 and TLR4, TRIF, MyD88 KO mice using a 2-step collagenase perfusion procedure. Each liver was perfused via portal vein with 30 mL 37°C pre-warmed perfusion buffer [HBSS without Ca2+ and Mg2+ (Thermo Scientific), containing 0.2 mM EDTA and 20 mM glucose] and followed by 30 mL 37°C pre-warmed digestion buffer [HBSS with Ca2+ and Mg2+ (Thermo Scientific) containing 20 mM glucose and 100 U/L collagenase type I (Worthington-Biochem]. Digested livers were transferred to a chilled dish and dissociated cells were isolated by gentle teasing apart of the liver with 1 mL pipette tips. Hepatocytes were washed twice with DMEM/D-12 (1:1) (Thermo Scientific) media at 100g for 4 min at 4°C. The washed hepatocytes were purified on a 40%/90% Percoll gradient centrifuged at 700g for 20 min at 20°C. Hepatocytes were plated at a density of 3.5×10⁴/well (96-well plate) or 1.5×10⁵/well (24-well plate) in cell culture plates pre-coated with collagen (Type I from rat nail, BD Biosciences, 50 µg in 1 mL 30% ethanol, dried under air for more than 12 h) and incubated in 5% CO2 at 37°C.
To study the effect of endocytosis inhibitors [amiloride (50 µM), bafilomycin A1 (10 nM), chlorpromazine (5 µM), cytochalasin D (1 µM), indomethacin (50 µM) or nocodazole (25 µM)] (all of them purchased from Sigma–Aldrich) on GDN and GDEN2 uptake, hepatocytes were cultured at 37°C in the presence of an endocytosis inhibitor for 1 h prior to the addition of PKH26-labelled GDN or GDEN2 for an additional 3 h culture period. After washing with PBS 3×, cells were fixed in a cold 4% paraformaldehyde solution for 20 min and blocked with 5% BSA in PBS. Cells were then stained with a mouse anti-albumin antibody (R&D system) for 1 h at 22°C. After washing, the cells were stained with an Alexa Fluor 488 labelled rabbit anti-mouse antibody (Invitrogen Life Sciences). The cells were washed and counterstained with DAPI, and images were captured using a Nikon A1R confocal microscope equipped with a digital image analysis system (Pixera).
To determine the effects of temperature on GDN uptake, primary hepatocytes were isolated and cultured overnight at 37°C in a CO2 incubator. The next day, cultured hepatocytes were treated with PKH26-labelled GDN and continued in culture at 37°C, 20°C or 4°C for an additional 6 h. Then, the cells were washed in PBS and stained with anti-albumin antibody and imaged with a confocal microscopy.
Quantification of ROS production
Hepatocytes in 96-well plates were cultured for 24 h in the presence of GDN or GDEN2 (100 µg/mL) or liposomes assembled from GDN or GDEN2, and then stimulated by adding ethanol (150 mM). Twelve hours after stimulation, the culture media was replaced with carboxyl-H2DCFDA (5 µM in PBS; Molecular Probes) and continued in culture for 30 min at 37°C, in a 5% CO2 incubator. Unincorporated dye was removed by washing with PBS for 2×. Accumulation of DCF in hepatocytes was measured by an increase in fluorescence of ROS oxidation product, DCF. DCF can be measured at a 485±10 nm excitation and a 528±10 nm emission with a Synergy HT Multi-Mode Microplate Reader (BioTek) or analysed with a flow cytometer (BD FACSCalibur; BD Biosciences) after hepatocyte trypsinization. Mean DCF fluorescence intensity was calculated based on measurements of 20,000 cells using the FL1-H channel.
Cytoplasmic and nuclear protein extraction
To prepare nuclear protein extracts, hepatocytes were washed with a cold perfusion buffer [HBSS without Ca2+ and Mg2+ (Thermo Scientific), containing 0.2 mM EDTA and 20 mM glucose], harvested by adding a digestion buffer (HBSS) with Ca2+ and Mg2+ containing 20 mM glucose and 100 U/L collagenase type I (Worthington-Biochem) followed by gentle scraping. After washing with cold PBS at 100g for 4 min, the cell pellets were resuspended in cold cytoplasmic extract buffer (10 mM HEPES, 60 mM KCl, 1 mM EDTA, 1 mM DTT and 1 mM PMSF, pH 7.6) containing 0.075% (v/v) NP40. After incubating on ice for 3 min, the cell suspension was centrifuged at 400g for 4 min, the supernatant (cytoplasmic protein) was collected and the pellet was washed with cytoplasmic extract buffer without NP40 one more time. Nuclear protein was extracted from the pellet with nuclear extract buffer [20 mM Tris Cl, 420 mM NaCl, 1.5 mM MgCl2, 0.2 mM EDTA, 1 mM PMSF and 25% (v/v) glycerol, pH 8.0]. The proteins were quantified using a method as described in Ref. 15.
Oil red O staining
Cryosections of liver were air-dried, rinsed with distilled water, stained with Oil Red O (Sigma–Aldrich) in 60% isopropanol for 15 min and counterstained with haematoxylin for 10 min. An Aperio Sanscoper system was used to capture and analyse stained sections.
Hepatic triglyceride
Triglyceride in liver was measured according to the manufacturer's instruction using the triglyceride assay kit from Cayman.
RNA extraction and PCR
Total RNA was isolated from liver tissue with Trizol agent according to the manufacturer's instructions (Invitrogen). Total RNA (1 µg) was reverse transcribed with Superscript III and random primers (Invitrogen). For the quantitation of genes of interest, cDNA samples were amplified in a CFX96 Realtime System Bio-Rad Laboratories using a method described in Ref. 24. Fold changes in mRNA expression between treatments and controls were determined by the dCT method as described. Differences between groups were normalized to a GAPDH reference. All primers were purchased from Eurofins MWG Operon. The primer pairs for analysis are provided as a Supplementary Table II.
Western blot analysis
Western blots were carried out as described previously (Citation16). In brief, proteins were separated on 10% polyacrylamide gels using SDS–PAGE and transferred to nitrocellulose membranes. Membranes were probed with specific antibodies: rabbit anti-mouse Nrf2 polyclonal antibody (Santa Cruz Biotechnology), rabbit monoclonal anti-GAPDH antibody (D16H11, from Cell Signalling Technology) or mouse monoclonal anti-PCNA antibody (PC10, from Santa Cruz). After washing, membrane was stained by Alexa fluor 680 labelled secondary antibody and signal intensity was quantified with an Odyssey instrument (Li-CoR Bioscience, Lincoln, NE) and a previously described protocol (Citation15).
Statistical analysis
One-way, 2-way analysis of variance (ANOVA) and t-test were used to determine statistical significance (*p<0.05 and **p<0.01).
Results
Characterization of GDNs
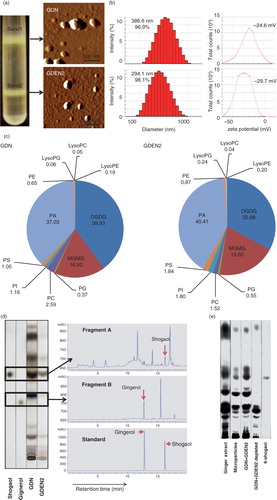
GDNs were isolated from homogenized ginger using a sucrose gradient centrifugation method (Citation1). The majority of the GDNs accumulated at the 8%/30% interface (band 1, referred it to as GDN, 3.79±0.27 mg/g of ginger protein) and at the 30%/45% interface (band 2, 0.31±0.01 mg/g of ginger protein) of the sucrose gradient. Band 2 has been characterized in the manuscript we published (Citation2) and the particles in this band were referred to as ginger-derived exosome-like nanoparticles (GDEN2) and used as a reference. GDN and GDEN2 integrity and size were evaluated by atomic force microscopy (AFM; a) and a nano zetasizer (b). The results showed that the size distribution of the nanoparticles of isolated GDN ranged from 102.3 to 998.3 nm in diameter, with an average diameter of 386.6 nm for GDN and 294.1 nm for the GDEN2 population. Zeta potential measurements indicated that ginger nanoparticles had a negative zeta potential value ranging from −24.6 mV (GDN) to −29.7 mV (GDEN2). Lipidomic data (c) indicated that both GDN and GDEN2 were enriched with phosphatidic acids (37.03 and 40.41%, respectively), digalactosyldiacylglycerol (39.93 and 32.88%, respectively), and monogalactosyl monoacylglycerol (16.92 and 19.65%, respectively). Interestingly, among the lipids we analysed, shogaols were much higher in GDN than in GDEN2 (d), even though the total lipids extracted from equal amount of ginger nanoparticles used were loaded on the thin-layer chromatography (TLC) plate. The other lipids, as indicated in Supplementary Table I, were also much higher in GDN than in GDEN2. TLC analysis further indicates that most of the shogaols in the ginger extracts are not present in a free form but are associated with either ginger nanoparticles or microparticles isolated from ginger extracts (e) as indicated by the fact that depletion of GDN and GDEN2 from ginger extracts led to no visible shogaol on the developed TLC plate.
Fig. 1. (Continued)
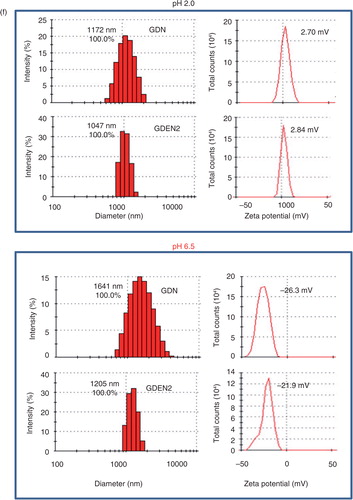
To test the stability of ginger nanoparticles under physiological conditions, we mimicked in vivo conditions by suspending ginger nanoparticles in a stomach-like solution (pH 2.0) or a small intestinal-like solution (pH 6.5). Interestingly, the results showed that compared to the size of ginger nanoparticles in PBS (b), the diameter of ginger nanoparticles was increased in a stomach-like solution and was further enlarged in a small intestine–like solution. Moreover, the ginger nanoparticles surface charge in a stomach-like solution changed from negative to a positive charge, whereas in a small intestine–like solution, the ginger nanoparticles shifted back from a positive- to a negative-charged surface (f).
An in vivo distribution of orally administered ginger nanoparticles
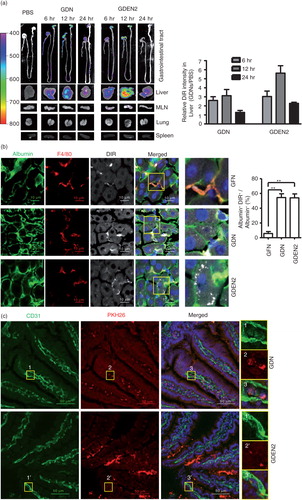
To determine the tissue distribution of ginger nanoparticles, in vivo biodistribution of DiR-labelled ginger nanoparticles was evaluated in mice using a Kodak Image Station 4,000 MM Pro system. After oral administration, DiR fluorescent signals were predominantly detected in liver with a peak intensity at 12 h and in mesenteric lymph nodes (MLNs); however, fluorescent signals were not detected in the lung, spleen (a) or other organs (data not shown). The presence of DiR-labelled ginger nanoparticles in the liver was further confirmed by confocal immune-staining for albumin (b), suggesting that hepatocytes are the primary cells targeted by ginger nanoparticles. Albumin+ hepatocytes are ginger nanoparticles specific, whereas most of the nanoparticles from grapefruit are co-localized with F4/80+ liver Kupffer cells but not albumin+ hepatocytes (b, top panels). The co-localization of the PKH26 signals with CD31, a marker of endothelial cells (c), but not LYVE1, a marker of lymphatic capillaries (d), along the length of the intestinal endothelial vessels within 6 h of administration of ginger nanoparticles suggests that the ginger nanoparticles migrate into the liver from the gut primarily through vascular vessels. Thus, the ginger nanoparticles can gain access and traffic within the vascular system of the liver.
Fig. 1. Identification and characterization of ginger-derived nanoparticles (GDNs). (a) Two bands from sucrose-banded ginger rhizome root–derived samples were formed after gradient ultracentrifugation (left). GDN and GDEN2 particles were visualized by atomic force microscopy (AFM, right). (b) Size distribution (left) and surface zeta-potential (right) of the particles were determined using a Zetasizer Nano ZS. (c) Pie chart with a summary of the putative lipid species in GDN and GDEN2, reported as the percentage of total GDENs lipids. Major details are reported in Supplementary Table I. PA: phosphatidic acids; PS: phosphatidyl serine; PI: phosphatidyl inositol; PE: phosphatidyl ethanolamines; PC: phosphatidyl choline; PG: phosphatidyl glycerol; MG/DG: mono/di/glycerols. LysoPG: lysophosphatidyl glycerol; LysoPC: lysophosphatidyl choline; LysoPE: lysophosphatidyl ethanolamines. (d) TLCs (left) and HPLC (right) analysis of the lipid extracts from GDN and GDEN2. A standard shogaol (left panel, the 1st lane) or gingerol (left panel, the 2nd lane) were used as markers, (e) TLCs analysis of the lipid extracts from ginger extracts, ginger microparticles, pellet including GDN plus GDEN2, and ginger extracts with GDN and GDEN2 depleted, (f) GDN or GDEN2 was incubated in a stomach-like solution (top panel) for 60 min at 37°C and subsequently in small intestinal-like solution (bottom panel) for an additional 60 min at 37°C. Size distribution and surface zeta-potential changes were measured by Zetasizer Nano ZS. Results (a–f) represent at least 3 independent experiments.
To further examine the mechanism of GDNs internalization, primary hepatocytes were treated with endocytosis inhibitors. Uptake of PKH26-GDN (e) was markedly inhibited by amiloride, an inhibitor of macropinocytosis, and uptake of PKH26-GDEN2 was inhibited by the nocodazole, an inhibitor of the polymerization of microtubules. Uptake of PKH26-GDN and PKH26-GDEN2 was not greatly diminished by the treatment of primary hepatocytes with other inhibitors as listed (Supplementary Fig. 1a and b), suggesting the specificity of endocytosis pathways of GDN and GDEN2.
We further demonstrated that the efficiency of uptake of GDN was a temperature-dependent process. Uptake rates were very slow at 4°C and increased as the temperature was raised (Supplementary Fig. 2), suggesting that metabolic energy is required for this process.
Activation of Nrf2 is dependent on GDN 6-shogaol through TLR4/TRIF pathway
Our data suggest that shogaol content in GDN was higher than in GDEN2 (d). A shogaol-rich ginger extract may enhance antioxidant defense mechanisms through the induction of Nrf2 (Citation4). To determine whether shogaol-rich GDNs have a different effect on Nrf2 activation when compared to GDEN2, primary hepatocytes were treated with GDENs. The nuclear translocation of Nrf2 was analysed. The results from immune-staining of Nrf2 (a) showed that primary hepatocytes treated with GDN have a significantly increased nuclear translocation of Nrf2 when compared to cells treated with PBS. This result is also consistent with the results showing that the production of reactive oxygen species (ROS), which is negatively regulated by Nrf2 (Citation5–Citation7), was also reduced at 24 h after hepatocytes were treated with GDN (b).
Fig. 2. (Continued)
Next, using knock-out (KO) and knock-in strategies, we determined whether shogaol in the GDN plays a role in the activation of Nrf2 in the context of lipids extracted from GDN. For KO, lipids of GDN without shogaol were carefully recovered from TLC silica gel plates, then liposome-like nanoparticles (LN) with shogaol KO were generated using previously described technology (Citation8). For knock-in, commercial 6-shogaol was added to shogaol KO lipid to make knock-in liposome-like nanoparticles (c).
Although KO of shogaol in GDN-derived LN has no effect on the range of size of reassembled nanoparticles, an additional subpopulation with a peak size of 54.33 nm was observed (Supplementary Fig. 3). Knock-in of 6-shogaol led to elimination of this subpopulation. Zeta potential measurements indicated that LNs had a negative zeta potential value ranging from −76.2 to −33.5 mV (Supplementary Fig. 3).
The effect(s) of KO of shogaol was further evaluated in terms of nuclear translocation of Nrf2. As the western blot analysis results for Nrf2 indicated, more nuclear Nrf2 was detected in the primary hepatocytes treated with GDN or GDN-derived LN than in PBS-treated hepatocytes (d). Moreover, KO of shogaol in GDN-derived LN led to the reduction of Nrf2 detected in the nucleus, whereas knock-in of 6-shogaol resulted in the restoration of the levels of nuclear Nrf2 (e). This result is also consistent with the results showing that the production of ROS was also reduced 24 h after hepatocytes were treated with GDN or GDN-derived LN with shogaol knock-in (f). Collectively, these data support the idea that GDN shogaol has a role in increasing nuclear translocation of Nrf2 in GDN-targeted hepatocytes.
Nrf2 is anti-inflammatory, as evidenced by the fact that Nrf2 KO mice have a tendency to develop autoimmune and inflammatory lesions in multiple tissues (Citation9, Citation17). The data from an in vitro cell culture study suggest that 6-shogaol suppressed LPS-induced inflammation through Toll-like receptors (TLRs) mediated pathway (Citation18, Citation19). The TLRs are a major class of transmembrane proteins of the mammalian innate immune system and play a critical role in the inflammatory response. The major adaptors that bind to the intracellular domain of TLRs to activate the pro-inflammatory response are the myeloid differentiation primary response (MyD) 88 and TIR-domain-containing adapter-inducing interferon-β (TRIF). Together, MyD88 and TRIF lead to the expression of numerous inflammatory factors through transcriptional factors such as NF-κβ, AP-1 and IRF-3 activation. Therefore, using hepatocytes from either MyD88 or TRIF KO mice, we determine the role of MyD88 and TRIF in the GDN-mediated activation of Nrf2. Western blot analysis indicates that primary hepatocytes from either TLR4 or TRIF KO mice have no increase in nuclear Nrf2 after stimulation with LN derived from GDN (100 µg/mL) or shogaol knock-in LN derived from GDN (100 µg/mL) when compared with cells treated with GDN and Shogaol KO LN (g). However, primary hepatocytes from MyD88 KO mice have no impairment in an increase in nuclear Nrf2 after stimulation with shogaol knock-in GDN derived LN (g, right panel) in comparison with stimulation with Shogaol KO LN. In summary, these results suggest that the TLR4/TRIF pathway plays a role in GDN shogaol-mediated activation of Nrf2 in mouse hepatocytes.
Oral administration of GDN protects mice from alcohol-induced liver damage
Ethanol-induced oxidative damage in the liver involves depletion of antioxidants. Real-time PCR data support that a group of detoxifying/antioxidant genes including HO-1, NQO1, GCLM, and GCLC are induced in the liver 6 h after the mice are orally administered GDN at a dose of 50 mg/mouse (a). To further determine how much GDN gets into the peripheral blood, mice were gavaged with IRDye-700DX covalent-conjugated GDN. Peripheral blood was then collected over time, and circulating GND was isolated using a standard protocol for the isolation of exosomes. IRDye-700DX fluorescent signals of GDN in peripheral blood were then quantitatively analysed. The results indicate that circulating GDN was detected 10 min after mice were gavaged with IRDye-700DX+GDN, reached a peak (2.8 µg/mL) at 45 min and then essentially returned to a basal level 360 min after gavaging (b). In comparison with peak level of GDN given intravenously, it was estimated that approximately 5% of gavaged GDN gets into the peripheral blood. The fact of GDN getting into the peripheral blood was also confirmed with the data generated from IRDye-700DX+DIR+ double-labelled GDN (c) purified from plasma. Interestingly, the levels of circulating GDN collected over time (all points) were lower in the blood of mice fed an ethanol diet when compared with mice fed a regular diet (b), whereas a higher level of IRDye-700DX+PKH67+GDN was detected in the liver of mice fed an alcoholic diet (d). Collectively, these data support the need for further testing to determine whether mice pretreated with GDN are protected against alcohol-induced liver damage.
Fig. 2. In vivo distribution of orally administrated GDN and GDEN2. (a) In vivo imaging of trafficking of GDN. Male C57BL/6 mice were administered DiR dye labelled GDN (50 mg per mouse in 200 µL PBS) by gavage, and imaged over 24 h (left). The results are presented as mean of the net intensity (sum intensity/area, n=5) (right). (b) Hepatocytes taking up DIR labelled GDN. Male C57BL/6 mice were gavage administered DIR-GDN, DIR-GDEN2 or grapefruit nanoparticles (GFN) (50 mg per mouse in 200 µL PBS). Six hours after the administration, frozen sections of liver were examined by confocal microscopy for DIR+/Albumin+F4/80+ cells (left) and were quantified (right). Original magnification 40×. Confocal image analysis of frozen sections of intestines from mice fed PKH26+GDN or PKH26+GDEN2 after immunofluorescent staining for CD31 (c) or Lyve-1 (d) (green), original magnification 60× (left panel) with enlargement of indicated area shown in the right panel. Data are the mean±SEM of 3 experiments (a, b) or are representative of 3 experiments (c, d) (n=5 mice per group). (e) Blocking of primary hepatocyte uptake of PKH26-labelled GDN. Primary hepatocytes cells were incubated with the indicated chemical reagents or PBS as a control in the presence of PKH26-labelled PKH26+GDN or PKH26+GDEN2 (100 µg/mL) for 3 h. The treated cells were then washed, fixed, and cells were stained with anti-mouse albumin. PKH26+Albumin+ cells were examined using confocal microscopy and photographed. Results represent 1 out of 5 independent experiments.
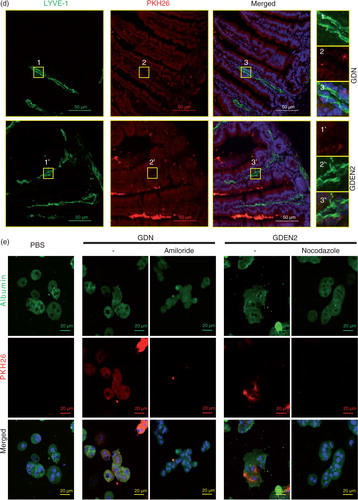
Fig. 3. (Continued)
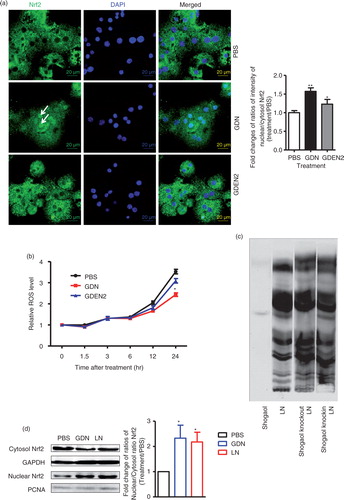
Fig. 3. TLF4/TRIF regulates GDN shogaol-mediated induction of nuclear translocation of Nrf2 in primary mouse hepatocytes. (a) Primary mouse hepatocytes from C57BL/6j mice were cultured in the presence of GDN or GDENs (100 µg/mL) for 4 h. Cells were then fixed and stained with anti-Nrf2 antibody. Nrf2+ cells were examined using confocal microscopy (left) and were quantified (right). Original magnification was 40×. An example of Nrf2 translocated from the cytoplasm to the nucleus is indicated by white arrows. The data (right panel) were expressed as fold changes of ratios of the intensity of nuclear to cytoplasmic signal of Nrf2 in cells. The results represent the mean±SEM of 3 independent experiments (right). *p<0.05 (Student's t-test). (b) Primary mouse hepatocytes from C57BL/6j mice were cultured for 24 h in the presence of GDN or GDENs (100 µg/mL). The induction of ROS at different time points as indicated in b was measured. Data are the mean±SEM of 5 experiments. *p<0.05 (Student's t-test). (c) The lipids extracted from GDN-derived liposome-like nanoparticles (LN) or LN with shogaol knock-out or knock-in and a standard shogaol were separated on a thin-layer chromatography plate and developed. A representative image was scanned using an Odyssey Scanner. (d) Primary mouse hepatocytes were cultured for 4 h in the presence of GDN (d, 100 µg/mL) or LN from GDN (100 µg/mL) with shogaol knock-out or knock-in (e). Cytoplasmic and nuclear extracts were isolated, subjected to western blotting and probed with anti-Nrf2 antibody, or GAPDH or PCNA antibodies as controls. Results (c–e) represent one of 3 independent experiments. *p<0.05, **p<0.01 (Student's t-test). (f) Primary mouse hepatocytes were cultured for 4 h in the presence of LN or LN derived from GDN (100 µg/mL) with shogaol knock-out or knock-in (shogaol, 3.18 µM). The induction of DCF in the treated cells was FACS analysed. Results (f) represent one of 3 independent experiments. The data (right panels, d–e) were expressed as fold changes of ratios of the intensity of nuclear to cytoplasmic of Nrf2 in cells. The results represent the mean±SEM of 3 independent experiments. (g) Primary mouse hepatocytes from TLR4, TRIF and MyD88 knock-out mice were cultured for 4 h in the presence of GDN (100 µg/mL) or LN from GDN (100 µg/mL) or LN with shogaol knock-out or knock-in (shogaol, 3.18 µM). Cytoplasmic and nuclear extracts were isolated, subjected to western blotting and probed with anti-Nrf2 antibody; GAPDH or PCNA antibodies served as controls. Results represent one of 3 independent experiments (n=3). The data (bottom panels) were expressed as fold changes of ratios of the intensity of nuclear to cytoplasmic signal of Nrf2 in cells. *p<0.05 (Student's t-test).
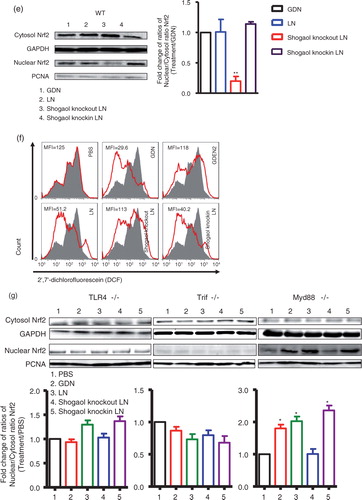
Fig. 4. (Continued)
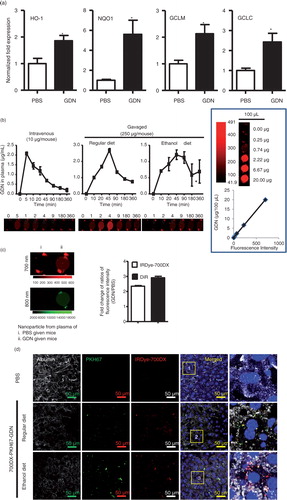
Fig. 4. Oral administration of GDN protects alcohol-induced liver injury. (a) Real-time analysis of expression of different genes at 6 h in the livers of C57BL/6j male mice orally administered with GDN (50 mg in 200 µL PBS). The results represent the mean±SEM of 3 independent experiments. *p<0.05 (Student's t-test). (b) Male C57BL/6 mice were intravenously (b, 1st panel from left, 10 µg/mouse) or orally administered (b, 2nd and 3rd panels, 250 µg per mouse in 200 µL PBS) with IRDye-700DX covalent-conjugated GDN, and plasma were collected over 360 min, and scanned with a Li-CoR Scanner. Amount of GDN in plasma was calculated based on the standard curve made from IRDye-700DX labelled GDN (b, right panel). The results are presented as the mean of net intensity (sum intensity/area, n=5). (c) Quantification of GDN in the plasma. Male C57BL/6 mice were orally administered (250 µg per mouse in 200 µL PBS) IRDye-700DX covalent conjugated and DIR dye labelled GDN or PBS as a control. Plasma was collected 45 min after oral administration and diluted in PBS at 1:10 for ultracentrifugation at 150,000g for 2 h. The pellets were resuspended in PBS and scanned with a Li-CoR Scanner. Representative images are shown (left panel). Fold changes of intensity of fluorescent signal of GDN versus PBS-fed mice were calculated. Data (right panel) are the mean±SEM of 3 experiments (n=5). (d) Male C57BL/6 mice were fed with either regular diet (top and middle panels) or a liquid diet containing 5% ethanol daily (bottom panel) for 7 days. Mice fed with regular diet or ethanol diet were orally administered IRDye-700DX covalent conjugated and PKH67 double labelled GDN (250 µg per mouse in 200 µL PBS). Twelve hours after the administration, frozen sections of liver were examined by confocal microscopy for PKH67+/IRDye-700DX+ cells. Original magnification is 40× (first 4 columns from left) with enlargement of indicated area shown in the last columns. (e–i) Eight-week-old male C57BL/6j mice fed a liquid diet containing 5% ethanol daily for 7 days. Starting on day 7, mice were gavage-administered GDN (50 mg/day) or PBS as a control daily while continuing the feeding of the 5% ethanol diet until day 14. On day 14, mice were fed with 30% instead of 5% ethanol and gavaged with a last dose of GDN at 9 h post-ethanol administration. The mice were euthanized and assessed (n=5 mice per group) for (e) levels of ALT and AST in serum, (f) neutral triglycerides and lipids using Oil red stain, (g) liver triglyceride (TG), (h) ratios of liver/body weight and (i) H&E-stained sections of livers from mice pretreated with PBS or GDN. Original magnification 20×. Data (e, g–h) are the mean±SEM of 3 experiments (n=5). *p<0.05 (Student's t-test). Results (f, i) represent one of 3 independent experiments.
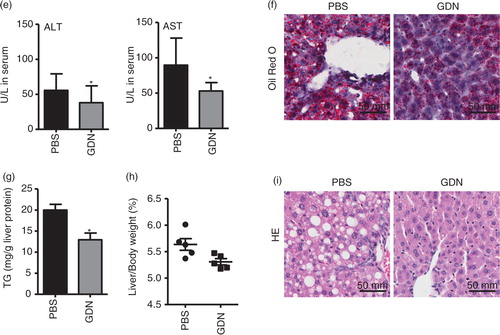
Mice that were pretreated with vehicle only exhibited symptoms characteristic of alcohol-induced liver injury, including elevated levels of serum alanine aminotransferase (ALT) and aspartate aminotransferase (AST; e). Histological analysis of the liver revealed accumulation of lipid droplets in the livers of ethanol-fed animals, whereas lipid droplets were remarkably reduced in livers of the mice treated with GDN (f). In addition, compared with mice fed with alcohol alone, mice gavaged with GDN had significantly decreased the liver triglyceride levels (g) and liver weight (h). There were also histopathological changes in the liver (i) with extensive areas of typical fatty liver including macrovesicular steatosis in alcohol-treated mice and fat accumulation in hepatocytes, marked haemorrhage and mononuclear cell infiltrates scattered diffusely throughout the viable parenchyma in comparison with the liver of mice gavage fed with GDN. Collectively, these results demonstrate that GDN treatment protected against the development of alcoholic liver injury in mice.
Discussion
Characterization of GDNs
In this study, using a sucrose gradient centrifugation isolation method GDNs were isolated and purified from 2 sucrose bands (GDN and GDEN2). The nanoparticles were characterized for their morphology using AFM and were also characterized for charge and size. The criteria for naming mammalian cell derived nanoparticles have been established (Citation20). Whether the same criteria can be applied to nanoparticles isolated from plant cells will require further study.
An in vivo distribution of orally administered GDN
It is obvious that unlike the free form of shogaol, which rapidly passes through gut after oral administration, our results show that most of shogaols in ginger extract are not present in a free form and are carried by GDN and are target delivered to hepatocytes. Therefore, much less amount of shogaol carried by GDN than free form of shogaol may be required for having equal biological effect on the hepatocytes. Moreover, a person will eat more than one kind of food in a single meal thus consuming a variety of nanoparticles. These mixed nanoparticles with different biological activities may have different biological effects on the same recipient cells or be taken up by different types of cells and subsequently work in a coordinated manner to maintain tissue homeostasis. Here, we demonstrated that the biological effect of ginger nanoparticles on the targeted cells, that is, hepatocytes, is to prevent alcohol-induced damage, whereas grapefruit-derived nanoparticles are taken up by Kupffer cells. Both hepatocytes and Kupffer cells play a critical role in liver homeostasis. If a person takes both in the same meal, it is conceivable that better liver homeostasis could be achieved. Also, most of diseases end up with multiple cells functionally dysregulated. These studies may lead to the design of customized or personalized cocktails of edible nanoparticles from different plants that may target to different types of cells in the liver and have different biological effects. Therefore, better preventative and therapeutic outcomes are achieved.
In this study, we also demonstrated that although both GDN and GDEN2 are taken up by hepatocytes, different pathways are utilized. We have shown that nanoparticles can enter the cells by endocytosis. Endocytosis consists of 3 major steps: formation of membrane vesicles with the cargo, endosomal delivery of the cargo inside the cell, and the distribution to various organelles inside the cell (Citation21–Citation23). Endocytosis, in general, is routinely distinguished from clathrin-mediated endocytosis, caveolin-mediated endocytosis, clathrin- or caveolin-independent endocytosis, and macropinocytosis. Our data suggest that GDN is taken up through macropintocytosis as indicated by the fact that non-toxic concentrations of amiloride in hepatocytes inhibit macropinocytosis. In contrast, treatment with a microtubule-disrupting agent (nocodazole) indicated that GDEN2 is taken up predominantly through microtubule-dependent active transport. This finding also provides the foundation for further studying whether differential uptake pathways of GDN versus GDEN2 may have an effect on Nrf2 nuclear translocation. Furthermore, the molecular mechanisms underlying TLR4/TRIF-dependent and GDN-mediated activation of Nrf2 needs to be investigated. One of the strategies for studying GDN-mediated molecular mechanism is to generate a monoclonal antibody against the GDN-associated molecule(s) to block GDN molecule–mediated biological effect on GDN-recipient mammalian cells.
Caution must be exercised when drawing conclusions about cells targeted by GDN labelled with DIR fluorescent dyes since the DIR dye could be dissociated from the labelled particles, and subsequently bind to intestinal particles such as intestinal exosomes. Intestinal exosomes have also been demonstrated to be an immune modulator in the liver (Citation24). Therefore, having particles being similar in size and labelled with the DIR dye is a critical control. In this study, GFNs isolated from grapefruit were used as a control.
In general, the quantity of nanoparticles getting into the peripheral blood is an important parameter for evaluating the stability of food-derived nanoparticles. Here we used a double-labelling GDN procedure for keeping track of GDN. The NHS ester reactive group of IRDye-700DX was covalently conjugated with primary and secondary amines in GDN proteins, whereas DIR binds to GND lipids. We were able to show that about 5% of the IRDye-700DX+GDN gets into the peripheral blood in comparison with an intravenous injection of GDN as a reference. In spite of the fact that this methodology provides a new approach for further addressing questions regarding whether molecules on/in the edible nanoparticles or exosomes released from gut epithelial cells are still stable as circulating nanoparticles, caution must be exercised drawing conclusions. Factual conclusions regarding in vivo trafficking will only be possible when the technology is available to distinguish between dye associated with particles and dye that is free or disassociate from particles.
Activation of Nrf2 is dependent on GDN 6-shogaol through TLR4/TRIF pathway
Using KO and knock-in strategy, we identified that shogaol in the GDN plays a role in the induction of Nrf2 nuclear translation in the targeted hepatocytes. Using a standard technology for the characterization of extracellular microvesicles, we have demonstrated that hepatocyte incorporation of GDN leads to Nrf2 nuclear translocation. Our data also show that the TLR4/TRIF pathway plays a role in GDN-mediated Nrf2 nuclear translocation activity. Using KO and knock-in strategies, we further demonstrated that GDN shogaol plays a role in induction of Nrf2 nuclear translocation.
Nrf2 nuclear translocation leads to activation of a pleiotropic cytoprotective defense process that includes antioxidants and protects against inflammatory disorders by inhibiting oxidative tissue injuries (Citation25–Citation28). Our real-time PCR data support the finding that a number of Nrf2-regulated genes encoding for cytoprotective defenses of hepatocytes stimulated by GDN are upregulated. Using KO and knock-in strategies utilizing shogaol from GDN, we clearly show that shogaol plays a role in induction of Nrf2. Our data are also supported by published data (Citation4), indicating that shogaol-rich extract from ginger induces Nrf2 nuclear translocation. It is also conceivable that intact GDNs are likely to be required for in vivo targeted delivery of shogaol to hepatocytes. Although further identification of GDN-associated molecule(s) that determine the targeting specificity is warranted, the finding that hepatocytes are specifically targeted by GDN (as shown in this study) indicates that delivery of therapeutic agents to hepatocytes without causing non-specific toxicity is feasible. In addition, using the KO and knock-in strategies as described in this study will provide a means of identifying the role of each individual lipid in the complex of liposome-like nanoparticles.
Recent studies report cross-talk between Nrf2/HO-1 and the TLR system as a mechanism involved in hepatic injury (Citation29). Our results suggest that GDN regulate the Nrf2 activity through the TLR4/TRIF pathway in hepatocytes. The TLR4/TRIF-mediated pathway plays a crucial role in mammalian innate immune responses against pathogens and a variety of insults. The innate immune system is the dominant immune system found in plants, fungi, insects and in primitive multicellular organisms (Citation30–Citation32). This finding provides a foundation for further determining whether edible plant–derived nanoparticles may also regulate innate immune response in plant kingdoms.
Oral administration of GDN protects mice from alcohol-induced liver damage
A number of studies (Citation33–Citation42) indicate that the plant kingdom provides not only nutrients but also bioactive natural products to prevent diseases that occur in the mammalian kingdom. How plant-derived bioactive natural products execute their functions on the mammalian system while resisting the harsh GI environment, that is, the low pH in the stomach and the degradative enzymes, and more importantly, how plant-derived bioactive natural products which are a foreign material to the mammalian immune system are ignored by immune cells is not well understood. Oral administration of GDN leads to protection of mice from alcohol-induced liver injury. This finding not only suggests that GDN could be used as a novel agent to protect the liver against damage but provides a foundation for studying the mechanism underlying interspecies communication through nanoparticles we ingest daily from many different types of edible plants.
Although in this study, we show that inhibition of alcohol-induced ROS is one of the mechanisms underlying GDN-mediated protection of mice from alcohol-induced liver injury, many factors acting in concert contribute to the sensitivity of liver cells to alcohol exposure and the resulting liver damage. Alcohol is broken down (i.e. metabolized) in the liver cells. Alcoholic-derived metabolic products can activate certain immune cells to produce various cytokines, including interleukins, interferon gamma, tumour necrosis factor alpha and transforming growth factor beta and collagen, a protein involved in scar tissue formation (fibrosis). Thus, all these diverse pathways contribute to inflammatory reactions and fibrosis and culminate in the induction of apoptosis and liver damage. Therefore, it is conceivable that more than one molecule that simultaneously interacts with pathways activated by alcoholic/alcoholic metabolic products may be required for effectively inhibiting the alcoholic-induced liver damage. Therefore, besides the effects of shogaol demonstrated in this study, other GDN-associated molecules such as nanoparticle-associated RNA may also contribute to protecting mice from alcohol-induced induced liver injury. The role for edible plant nanoparticle RNA mediating interspecies communications has been demonstrated (Citation43–Citation46). Further study is warranted to determine whether GDN RNA has a role in protecting mice from alcohol-induced or other insult-induced liver injury.
In this study, we investigated the effect of GDN on hepatocytes and we do not exclude the possibility of the biological effects of GDN on other tissues. Recently published data (Citation8) indicate that edible plant nanoparticles are highly resistant to digestion by both gastric pepsin solution and intestinal pancreatic and bile extract solution. Significant amounts of edible plant nanoparticles are taken up by intestinal macrophages (Citation2, Citation8) and stem cells (Citation1), thus preventing DSS-induced mouse colitis. Therefore, the molecules including lipids and RNA from edible plant nanoparticles may also have an effect on the recipient cells localized in the gut as well as the liver. Further investigation is necessary to determine whether the GDN-associated molecules have a systemic biological effect as claimed by other investigators (Citation43). In addition, the amount of GDN we used for this study may not be relevant to ginger typically used in culinary preparations but it should be applicable for medical use since the amounts of GDN we used for this study have a therapeutic effect without causing visible side effects.
Authors' contributions
XZ and H-GZ designed the research, analysed and interpreted data, and drafted the manuscript; DM, CJM, JY and WF interpreted the findings and drafted the manuscript; and Z-BD, JM and LZ performed experiments and interpreted data.
Conflict of interest and funding
This work was supported by a grant from the National Institutes of Health (NIH) (UH2TR000875, RO1AT004294, R01AT008617) and the Louisville Veterans Administration Medical Center (VAMC) Merit Review Grants (H-GZ). Huang-Ge Zhang is supported by a Research Career Scientist (RCS) Award.
Supplementary Figures
Download PDF (18.8 KB)Acknowledgements
We thank Dr. Jerald Ainsworth for editorial assistance.
Notes
To access the supplementary material to this article, please see Supplementary files under ‘Article Tools’.
References
- Ju S, Mu J, Dokland T, Zhuang X, Wang Q, Jiang Het al. Grape exosome-like nanoparticles induce intestinal stem cells and protect mice from DSS-induced colitis. Mol Ther. 2013; 21: 1345–57. [PubMed Abstract] [PubMed CentralFull Text].
- Mu J, Zhuang X, Wang Q, Jiang H, Deng ZB, Wang Bet al. Interspecies communication between plant and mouse gut host cells through edible plant derived exosome-like nanoparticles. Mol Nutr Food Res. 2014; 58: 1561–73. [PubMed Abstract].
- Raimondo S, Naselli F, Fontana S, Monteleone F, Lo Dico A, Saieva Let al. Citrus limon-derived nanovesicles inhibit cancer cell proliferation and suppress CML xenograft growth by inducing TRAIL-mediated cell death. Oncotarget. 2015; 6: 19514–27. [PubMed Abstract].
- Bak MJ, Ok S, Jun M, Jeong WS. 6-Shogaol-rich extract from ginger up-regulates the antioxidant defense systems in cells and mice. Molecules. 2012; 17: 8037–55. [PubMed Abstract].
- Lu Y, Zhang XH, Cederbaum AI. Ethanol induction of CYP2A5: role of CYP2E1-ROS-Nrf2 pathway. Toxicol Sci. 2012; 128: 427–38. [PubMed Abstract] [PubMed CentralFull Text].
- Lee HG, Li MH, Joung EJ, Na HK, Cha YN, Surh YJ. Nrf2-mediated heme oxygenase-1 upregulation as adaptive survival response to glucose deprivation-induced apoptosis in HepG2 cells. Antioxid Redox Signal. 2010; 13: 1639–48. [PubMed Abstract].
- Beyer TA, Xu W, Teupser D, auf dem Keller U, Bugnon P, Hildt Eet al. Impaired liver regeneration in Nrf2 knockout mice: role of ROS-mediated insulin/IGF-1 resistance. EMBO J. 2008; 27: 212–23. [PubMed Abstract] [PubMed CentralFull Text].
- Wang B, Zhuang X, Deng ZB, Jiang H, Mu J, Wang Qet al. Targeted drug delivery to intestinal macrophages by bioactive nanovesicles released from grapefruit. Mol Ther. 2014; 22: 522–34. [PubMed Abstract] [PubMed CentralFull Text].
- Johnson DA, Amirahmadi S, Ward C, Fabry Z, Johnson JA. The absence of the pro-antioxidant transcription factor Nrf2 exacerbates experimental autoimmune encephalomyelitis. Toxicol Sci. 2010; 114: 237–46. [PubMed Abstract] [PubMed CentralFull Text].
- Bligh EG, Dyer WJ. A rapid method of total lipid extraction and purification. Can J Biochem Physiol. 1959; 37: 911–17. [PubMed Abstract].
- Wanjie SW, Welti R, Moreau RA, Chapman KD. Identification and quantification of glycerolipids in cotton fibers: reconciliation with metabolic pathway predictions from DNA databases. Lipids. 2005; 40: 773–85. [PubMed Abstract].
- Torrelles JB, Sieling PA, Zhang N, Keen MA, McNeil MR, Belisle JTet al. Isolation of a distinct Mycobacterium tuberculosis mannose-capped lipoarabinomannan isoform responsible for recognition by CD1b-restricted T cells. Glycobiology. 2012; 22: 1118–27. [PubMed Abstract] [PubMed CentralFull Text].
- Guo P. RNA Nanotechnology: methods for synthesis, conjugation, assembly and application of RNA nanoparticles. Methods. 2011; 54: 201–3. [PubMed Abstract].
- Hermida LG, Sabés-Xamaní M, Barnadas-Rodríguez R. Combined strategies for liposome characterization during in vitro digestion. J Liposome Res. 2009; 19: 207–19. [PubMed Abstract].
- Liu Y, Shah SV, Xiang X, Wang J, Deng ZB, Liu Cet al. COP9-associated CSN5 regulates exosomal protein deubiquitination and sorting. Am J Pathol. 2009; 174: 1415–25. [PubMed Abstract] [PubMed CentralFull Text].
- Sun D, Zhuang X, Xiang X, Liu Y, Zhang S, Liu Cet al. A novel nanoparticle drug delivery system: the anti-inflammatory activity of curcumin is enhanced when encapsulated in exosomes. Mol Ther. 2010; 18: 1606–14. [PubMed Abstract] [PubMed CentralFull Text].
- Yoh K, Itoh K, Enomoto A, Hirayama A, Yamaguchi N, Kobayashi Met al. Nrf2-deficient female mice develop lupus-like autoimmune nephritis. Kidney Int. 2001; 60: 1343–53. [PubMed Abstract].
- Park SH, Kyeong MS, Hwang Y, Ryu SY, Han SB, Kim Y. Inhibition of LPS binding to MD-2 co-receptor for suppressing TLR4-mediated expression of inflammatory cytokine by 1-dehydro-10-gingerdione from dietary ginger. Biochem Biophys Res Commun. 2012; 419: 735–40. [PubMed Abstract].
- Ahn SI, Lee JK, Youn HS. Inhibition of homodimerization of toll-like receptor 4 by 6-shogaol. Mol Cells. 2009; 27: 211–15. [PubMed Abstract].
- Gould SJ, Raposo G. As we wait: coping with an imperfect nomenclature for extracellular vesicles. J Extracell Vesicles. 2013; 2 20389, doi: http://dx.doi.org/10.3402/jev.v2i0.20389.
- Treuel L, Jiang X, Nienhaus GU. New views on cellular uptake and trafficking of manufactured nanoparticles. J R Soc Interface. 2013; 10: 20120939. [PubMed Abstract] [PubMed CentralFull Text].
- Rehman Z, Zuhorn IS, Hoekstra D. How cationic lipids transfer nucleic acids into cells and across cellular membranes: recent advances. J Control Release. 2013; 166: 46–56. [PubMed Abstract].
- Xu S, Olenyuk BZ, Okamoto CT, Hamm-Alvarez SF. Targeting receptor-mediated endocytotic pathways with nanoparticles: rationale and advances. Adv Drug Deliv Rev. 2013; 65: 121–38. [PubMed Abstract] [PubMed CentralFull Text].
- Deng ZB, Zhuang X, Ju S, Xiang X, Mu J, Liu Yet al. Exosome-like nanoparticles from intestinal mucosal cells carry prostaglandin E2 and suppress activation of liver NKT cells. J Immunol. 2013; 190: 3579–89. [PubMed Abstract] [PubMed CentralFull Text].
- Wang R, Paul VJ, Luesch H. Seaweed extracts and unsaturated fatty acid constituents from the green alga Ulva lactuca as activators of the cytoprotective Nrf2-ARE pathway. Free Radic Biol Med. 2013; 57: 141–53. [PubMed Abstract] [PubMed CentralFull Text].
- Wu KC, Cui JY, Klaassen CD. Effect of graded Nrf2 activation on phase-I and -II drug metabolizing enzymes and transporters in mouse liver. PLoS One. 2012; 7: e39006. [PubMed Abstract] [PubMed CentralFull Text].
- Kaspar JW, Niture SK, Jaiswal AK. Antioxidant-induced INrf2 (Keap1) tyrosine 85 phosphorylation controls the nuclear export and degradation of the INrf2-Cul3-Rbx1 complex to allow normal Nrf2 activation and repression. J Cell Sci. 2012; 125(Pt 4): 1027–38. [PubMed Abstract] [PubMed CentralFull Text].
- Jyrkkanen HK, Kansanen E, Inkala M, Kivela AM, Hurttila H, Heinonen SEet al. Nrf2 regulates antioxidant gene expression evoked by oxidized phospholipids in endothelial cells and murine arteries in vivo. Circ Res. 2008; 103: e1–9. [PubMed Abstract].
- Kang JW, Lee SM. Melatonin inhibits type 1 interferon signaling of Toll-like receptor 4 via heme oxygenase-1 induction in hepatic ischemia/reperfusion. J Pineal Res. 2012; 53: 67–76. [PubMed Abstract].
- Vandenbon A, Teraguchi S, Akira S, Takeda K, Standley DM. Systems biology approaches to Toll-like receptor signaling. Wiley Interdiscip Rev Syst Biol Med. 2012; 4: 497–507. [PubMed Abstract] [PubMed CentralFull Text].
- Kawai T, Akira S. Pathogen recognition with Toll-like receptors. Curr Opin Immunol. 2005; 17: 338–44. [PubMed Abstract].
- Medzhitov R, Janeway CJr. Innate immune recognition: mechanisms and pathways. Immunol Rev. 2000; 173: 89–97. [PubMed Abstract].
- Magrone T, Jirillo E. The interplay between the gut immune system and microbiota in health and disease: nutraceutical intervention for restoring intestinal homeostasis. Curr Pharm Design. 2013; 19: 1329–42.
- Crispe IN. The liver as a lymphoid organ. Ann Rev Immunol. 2009; 27: 147–63.
- Alonso C, Vicario M, Pigrau M, Lobo B, Santos J. Intestinal barrier function and the brain–gut axis. Adv Exp Med Biol. 2014; 817: 73–113. [PubMed Abstract].
- Faria AM, Gomes-Santos AC, Goncalves JL, Moreira TG, Medeiros SR, Dourado LPet al. Food components and the immune system: from tonic agents to allergens. Front Immunol. 2013; 4: 102. [PubMed Abstract] [PubMed CentralFull Text].
- Mann ER, Landy JD, Bernardo D, Peake ST, Hart AL, Al-Hassi HOet al. Intestinal dendritic cells: their role in intestinal inflammation, manipulation by the gut microbiota and differences between mice and men. Immunol Lett. 2013; 150: 30–40. [PubMed Abstract].
- Jacobi SK, Odle J. Nutritional factors influencing intestinal health of the neonate. Adv Nutr. 2012; 3: 687–96. [PubMed Abstract] [PubMed CentralFull Text].
- Kayama H, Takeda K. Regulation of intestinal homeostasis by innate and adaptive immunity. Int Immunol. 2012; 24: 673–80. [PubMed Abstract].
- Vitetta L, Briskey D, Hayes E, Shing C, Peake J. A review of the pharmacobiotic regulation of gastrointestinal inflammation by probiotics, commensal bacteria and prebiotics. Inflammopharmacology. 2012; 20: 251–66. [PubMed Abstract].
- Magnusson MK, Wick MJ. Intestinal dendritic cell and macrophage subsets: tipping the balance to Crohn's disease?. Eur J Microbiol Immunol. 2011; 1: 19–24.
- Peron JP, de Oliveira AP, Rizzo LV. It takes guts for tolerance: the phenomenon of oral tolerance and the regulation of autoimmune response. Autoimmun Rev. 2009; 9: 1–4. [PubMed Abstract].
- Zhang L, Hou D, Chen X, Li D, Zhu L, Zhang Yet al. Exogenous plant MIR168a specifically targets mammalian LDLRAP1: evidence of cross-kingdom regulation by micro-RNA. Cell Res. 2012; 22: 107–26. [PubMed Abstract] [PubMed CentralFull Text].
- Sala-Cirtog M, Marian C, Anghel A. New insights of medicinal plant therapeutic activity – the miRNA transfer. Biomed Pharmacother. 2015; 74: 228–32. [PubMed Abstract].
- Regente M, Pinedo M, Elizalde M, de la Canal L. Apoplastic exosome-like vesicles: a new way of protein secretion in plants?. Plant Signal Behav. 2012; 7: 544–6. [PubMed Abstract] [PubMed CentralFull Text].
- Ding Y, Wang J, Wang J, Stierhof YD, Robinson DG, Jiang L. Unconventional protein secretion. Trends Plant Sci. 2012; 17: 606–15. [PubMed Abstract].