
Abstract
Extracellular vesicles (EVs) are submicron vesicles released from many cell types, including adipocytes. EVs are implicated in the pathogenesis of obesity-driven cardiovascular disease, although the characteristics of adipocyte-derived EVs are not well described. We sought to define the characteristics of adipocyte-derived EVs before and after adipogenesis, hypothesising that adipogenesis would affect EV structure, molecular composition and function. Using 3T3-L1 cells, EVs were harvested at day 0 and day 15 of differentiation. EV and cell preparations were visualised by electron microscopy and EVs quantified by nanoparticle tracking analysis (NTA). EVs were then assessed for annexin V positivity using flow cytometry; lipid and phospholipid composition using 2D thin layer chromatography and gas chromatography; and vesicular protein content by an immuno-phenotyping assay. Pre-adipogenic cells are connected via a network of protrusions and EVs at both time points display classic EV morphology. EV concentration is elevated prior to adipogenesis, particularly in exosomes and small microvesicles. Parent cells contain higher proportions of phosphatidylserine (PS) and show higher annexin V binding. Both cells and EVs contain an increased proportion of arachidonic acid at day 0. PREF-1 was increased at day 0 whilst adiponectin was higher at day 15 indicating EV protein content reflects the stage of adipogenesis of the cell. Our data suggest that EV production is higher in cells before adipogenesis, particularly in vesicles <300 nm. Cells at this time point possess a greater proportion of PS (required for EV generation) whilst corresponding EVs are enriched in signalling fatty acids, such as arachidonic acid, and markers of adipogenesis, such as PREF-1 and PPARγ.
To access the supplementary material to this article, please see Supplementary files under ‘Article Tools’.
Adipose tissue is no longer regarded as simply an inert store of excess energy, but as an endocrine organ that can secrete a variety of adipokines and signalling entities that promote interaction with other cell types proximally, such as endothelial cells and fibroblasts, and distally, such as cells of the central nervous system (Citation1).
In addition to these soluble factors, adipocytes have also been shown to release extracellular vesicles (EVs) in vitro (Citation2–Citation4). EVs are classically defined as submicron vesicles released into the external environment of the cell. This allows subsequent isolation of EVs from biological fluids, most commonly plasma, urine and the conditioned media of cultured cells (Citation5). EVs are known to carry a specific cargo of mRNA, microRNA, proteins and lipids that may be transferred to target cells through mechanisms which are not fully defined (Citation6).
EVs comprise exosomes, microvesicles and apoptotic bodies. The latter are typically larger (1–5 µm) vesicles released from cells prior to apoptosis (Citation7) and are consequently excluded from the description of EVs henceforth. Exosomes, which typically range in size from 30 to 100 nm, are generated within multivesicular endosomal compartments.These may then fuse with the plasma membrane to release exosomes via exocytosis as part of the cell's homeostatic recycling mechanism (Citation8, Citation9). Microvesicles are formed as a consequence of localised disruption of the cytoskeleton and normal phospholipid asymmetry, resulting in exposure of phosphatidylserine (PS); commonly used to identify microvesicle populations via annexin V binding (Citation10). Microvesicles, whose sizes range from 100 to 1 µm, bud directly from the plasma membrane and hence often carry surface antigens from the cell of origin (Citation11).
Despite the importance of adiposity as a major risk factor for cardiovascular disease and the emerging evidence of a pathogenic role for EVs in a number of cardiovascular diseases (Citation12), very little is known about the characteristics of adipocyte-derived EVs. Studies in rat primary adipocyte cultures have shown these EVs can interact locally with neighbouring adipocytes to promote lipid esterification and that their release is upregulated by both physiological (e.g. insulin) and pharmacological (e.g. glimepiride) stimuli (Citation4). The murine adipocyte cell line 3T3-L1 has also been reported to produce EVs containing adipokines (Citation2, Citation3) and factors that promote angiogenesis in vivo (Citation13). Human adipose tissue explants have also been shown to produce EVs that can modulate monocyte differentiation and alter insulin signalling in adipocytes (Citation14) and liver cells (Citation15). These findings suggest that EVs may represent an additional mechanism by which adipocytes communicate with neighbouring and distant cell types. However, adipocyte-derived EVs are not well characterised; hence, we sought to define EV production, structure and content in 3T3-L1 cells, before and after adipogenesis.
Methods
Cell culture
3T3-L1 cells were cultured using T175 cm2 flasks (Cellstar®, Greiner Bio-One, Germany) in “control media” containing a 1:1 ratio of DMEM (high glucose, 4.5 g/L): F12 supplemented with 10% foetal calf serum and 1% penicillin/streptomycin (Gibco®, Life Technologies, UK). At confluence, serum-free control medium was added for 24 hours for subsequent EV isolation (day 0). Control medium was then supplemented with inducers of differentiation (Sigma Aldrich, UK): insulin (10 µg/mL), indomethacin (50 µM) and dexamethasone (1 µM) and added to cells for 2 days. Cells were then maintained in control medium supplemented with insulin (10 µg/mL) for the remainder of their maturation. Fourteen days after induction of differentiation, serum-free control medium (with 10 µg/mL insulin) was added for 24 hours for subsequent EV isolation (day 15).
Cell counts were undertaken at both time points (day 0 and day 15) using trypan blue and a cellometer automatic cell counter (Nexcelom Bioscience, MA, USA). Adipogenesis was confirmed using oil red O staining and western blot analysis of total cell lysates (10 µg) for the preadipocyte factor-1 (PREF-1) and the mature adipocyte markers adiponectin and fatty acid binding protein 4 (FABP4) (Supplementary Fig. 1).
EV isolation
EVs were isolated from conditioned serum-free media to avoid EV contamination from foetal calf serum (Supplementary Fig. 2). Medium was collected at day 0 and day 15 to analyse EVs from immature and mature adipocytes, respectively.
Following collection, conditioned medium was immediately centrifuged at 1,000×g for 5 minutes to remove any cells in suspension. The supernatant was then centrifuged at 15,000×g for 15 minutes at 4°C to remove any cell debris. Finally, supernatants were ultracentrifuged at 100,000×g for 1 hour at 4°C to pellet EVs. EV pellets were then resuspended in 1× sterile PBS for subsequent analysis. EVs for flow cytometry were resuspended in 1× sterile annexin V binding buffer (BD Biosciences, CA) to allow staining for annexin V. For all parameters, EVs were stored at 4°C and utilised within 1 week of isolation. All buffers used to resuspend EV samples had been 0.22 µm-filtered.
Electron microscopy
Cells at both day 0 and day 15 were washed in PBS and fixed in gluteraldehyde-PBS (1%, v/v) at room temperature for 1 hour. Cells were then stored in PBS at 4°C until processing for scanning electron microscopy (SEM). SEM samples were dehydrated through graded propan-1-ol (50, 70, 90, and 2×100% for 10 minutes each) followed by three exchanges in hexamethyldisilazane. Samples were then air dried and splutter-coated with gold and viewed at 5 kV in a JEOL 840 SEM (JEOL, Tokyo, Japan).
EVs were isolated in PBS from cells at each time point as above and stored at 4°C for transmission electron microscopy (TEM). EVs were negatively stained as follows by placing grids onto 50 µL droplet of reagent. Vesicles were adsorbed onto formvar-carbon coated grids (20 minutes) and fixed in glutaraldehyde (1%, v/v) for 10 minutes at room temperature. Grids were then washed (3×1 minute in PBS and 6×1 minute in water) before negative staining with 2% (w/v) uranyl acetate for 10 minutes. Surplus stain was shaken off grids and allowed to air dry before being examined in a Philips CM12 TEM (FEI UK Ltd.) at 80 kV.
EV size and concentration analysis
Size and concentration distributions of EVs were determined using nanoparticle tracking analysis (NTA). Briefly, NTA uses the light scattering properties and Brownian motion of laser-illuminated particles in suspension to determine EV size and concentration. NTA was undertaken using the NanoSight LM10 configured with a 642 nm laser (NanoSight Ltd., UK) using NTA software version 2.3. Camera shutter speed was maintained at 30.01 ms and camera gain to 500. Samples were diluted in EV-free sterile water (Fresenius Kabi, UK) to concentrations between 2×10⁸ and 1×10⁹ particles/mL. Sixty-second videos were recorded in replicates of 5 per sample with camera sensitivity and detection threshold set to between 13–15 and 4–5, respectively. Temperature was monitored manually and ranged from 22 to 26°C. EV concentrations and distributions were then normalised to the cell count for the respective time point and expressed as EVs/viable cell.
Annexin V positivity
Annexin V positivity is one suggested characteristic of microvesicles, therefore we sought to characterise the Annexin V positivity of adipocyte EVs and their cell of origin. 3T3-L1 cells in 1×PBS (0.22-µm-filtered) were analysed using a BD FACSCanto (BD Biosciences, CA) as an unstained control. Cells were then pelleted and resuspended in 1× annexin V binding buffer and incubated in the dark at room temperature for 15 minutes with annexin V-FITC (Biolegend, CA). Following staining, cells were pelleted and resuspended in 1× PBS and analysed for their annexin V positivity.
EVs were analysed directly by flow cytometry, without the use of beads. Unstained EVs (in 1X annexin V buffer) were used as negative controls. EVs were then stained with annexin V-FITC (as above) and analysed.
Data were exported from the FACSDiva™ software (version 6) and subsequently analysed using FlowJo software (version 10; Tree Star Inc., OR).
Analysis of fatty acids
Gas chromatography with flame ionisation detection (GC-FID) was used to determine fatty acid concentration and composition as previously described (Citation16). Lipid extraction from cells and EVs in PBS (entire amounts of cells/EVs from T175 cm2 flasks) in replicates of 6 was undertaken using chloroform:methanol ( 1:2, v/v) by the method of Garbus et al. (Citation17). Fatty acid methyl esters (FAMEs) were then generated and analysed using GC, as previously described (Citation18). Fatty acid quantification was performed by addition of a known amount of C17:0 (heptadecanoic acid, Nu-Chek Prep Inc., Elysian, MN) as an internal standard. FAMEs were identified by comparison of their retention times with those of standards (N-15-A, Nu-Chek Prep Inc., Elysian, MN; Supelco 37 Component FAME Mix, Sigma Aldrich, UK). Total Chrom Navigator software (Perkin Elmer) was used for data acquisition. A list of individual fatty acids is presented in Supplementary Table I.
Phospholipid separation and quantification
Cells and EVs from both time points were isolated and lipids were extracted (as above) from pooled samples (from 7×T175 cm2 flasks) to ensure enough material for thin-layer chromatography (TLC) separation. Phospholipids were separated using two-dimensional TLC using 10×10 cm boric impregnated (1.2% boric acid in ethanol/water 1:1 (v/v)) silica gel 60 plates (Sigma Aldrich, UK). Phospholipids were separated using chloroform:methanol:ammonium hydroxide (65:35:10, v/v/v) in the first dimension and then N-butanol:acetic acid:deionised water (90:20:20, v/v/v) in the second. The plates were then dried completely and sprayed with a 0.05% (v/v) solution of 8-anilino-4-napthosulphonic acid in dry methanol in order to visualise individual phospholipids under UV light. Individual phospholipids were scraped from the plates and their fatty acids were converted into FAMEs (as described before) for GC analysis and phospholipid quantification.
EV protein content
EVs at day 0 and day 15 were probed for exosomal and adipocyte markers using high protein binding ELISA plates (Greiner Bio-One, Germany). Protein concentration of EV samples was determined using a Pierce™ BCA Protein Assay Kit (Thermo Scientific, UK) and 1 µg of EV sample was loaded into each well. EVs were allowed to settle overnight before a buffer (RIPA Lysis Buffer System; Santa Cruz, CA, USA) was added to permeabilise EVs for analysis of intravesicular EV and adipocyte markers. Exosomal markers included rabbit anti-mouse CD9, CD63, tumour susceptibility gene 101 (TSG101) (Santa Cruz) and mouse anti-mouse alix (Cell Signaling Technologies, New England BioLabs, UK). Adipocyte markers included rabbit anti-mouse FABP4, peroxisome proliferator-activated receptor γ (PPARγ), adiponectin and preadipocytes factor-1 (PREF-1) (Cell Signaling Technologies). Markers were detected using anti-mouse or anti-rabbit biotin-labelled secondary antibodies (Perkin Elmer) and a streptavidin–europium conjugate (Perkin Elmer) and analysed using time resolved fluorescence (Wallac Victor2 1420 plate reader, Perkin Elmer; and FLUOstar OPTIMA microplate reader, BMG Labtech, UK).
Statistical analysis
Data are presented as mean±SD. An unpaired Student's t-test or a one- or two-way ANOVA were used to analyse differences between means. Analyses were conducted using GraphPad Prism (version 6; GraphPad Software Inc., CA), p-values <0.05 were considered significant.
Results
Electron microscopy
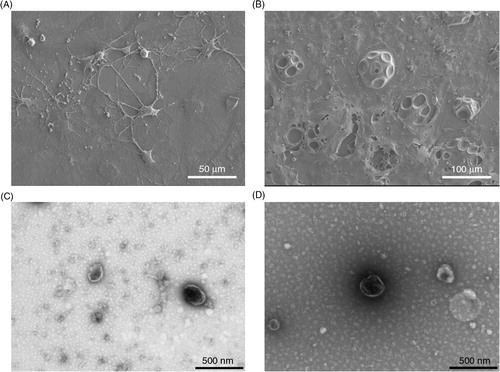
Cells at day 0 appeared to be connected by a network of protrusions between multiple cells whilst cells at day 15 were much larger and rounder with a number of vacuole-like structures (A and B, respectively). EVs at both time points displayed polydispersity in size and a classic “cup-like” morphology (C and D).
Fig. 1. Electron microscopy of 3T3-L1 cells and corresponding EVs pre- and post-differentiation. Scanning electron microscopy images of 3T3-L1 cells at day 0 (A) and day 15 (B). Transmission electron microscopy images of 3T3-L1 EVs at day 0 (C) and day 15 (D). Note scale bars differ between images and types of electron microscopy.
EV size and concentration
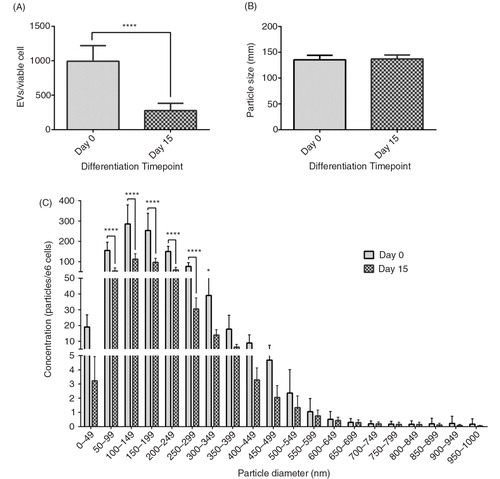
Viable cell counts are shown in Supplementary Fig. 3. EV production was higher at day 0 compared to day 15 (992.7±226.2 versus 276.5±104.8 EVs/viable cell, respectively, p<0.0001, A) though mode size of EVs did not change between the two time points (135.4±8.9 to 137.1±7.6 nm, p=0.6), B). The EV size/concentration distribution showed that this elevation at day 0 was observable across the whole EV spectrum, particularly in EVs <300 nm (C).
Fig. 2. Effect of differentiation on EV size and concentration. The effect of 3T3-L1 differentiation on: EV production per viable cell (A); mode EV size (B); and EV size distribution (C). ****p<0.0001, n=6 (day 0) and n=5 (day 15).
Cell and EV annexin V positivity
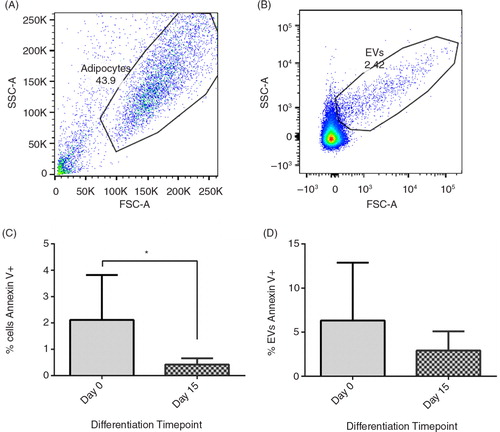
illustrates the gates used to analyse cells (A) and EVs (B) for annexin V positivity. Annexin V positivity fell in both cells (2.1±1.7 to 0.4±0.2%, p=0.04) and non-significantly in EVs (6.3±6.6 to 2.9±2.2%, p=0.3) from day 0 to day 15; overall, annexin V positivity was higher in EVs than in cells (C/D).
Fig. 3. Cell and EV Annexin V positivity. The effect of differentiation on 3T3-L1 and EV Annexin V positivity. (A) shows the gate used to analyse 3T3-L1 cells, (B) shows the gate used to analyse 3T3-L1-derived EVs and (C) shows the Annexin V-FITC positivity of cells and EVs on day 0 and day 15 of differentiation (n=6, except day 15 EVs where n=5) *p<0.05.
Fatty acid concentration and composition of cells and EVs
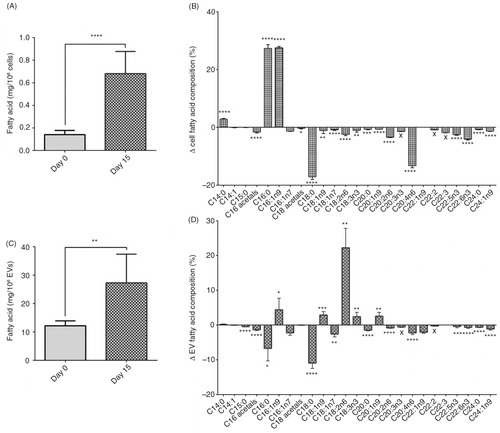
Total fatty acid concentration of cells and EVs increased from day 0 to day 15 (cells: 0.1±0.04 to 0.7±0.2 mg/106 cells, p<0.0001, A and EVs: 12.2±1.7 to 27.3±10.1 ng/106 EVs, p=0.005, C). Individual fatty acid compositions were expressed as a change from day 0 to day 15. Out of 25 fatty acids identified, 18 were different in cells and 17 in EVs between day 0 and day 15 (B and D, respectively). The majority of fatty acids reduced in proportion (of the total) with differentiation in cells and EVs. For example, arachidonic acid (C20:4n6) was reduced in both cells and EVs following differentiation. Many fatty acids were affected by differentiation in the same way; however, the effect was sometimes unique to the cell or EV. For example, the amount of oleic acid (C18:1n9) was decreased in cells but increased in EVs from day 0 to day 15. Certain fatty acids were also unique to the stage of differentiation, for example, eicosatrienoic acid (C20:3n3) was only present at day 0 in cells and EVs. Compositions of fatty acids were also different between cells and their corresponding EVs at each time point (Supplementary Table II).
Fig. 4. Cell and EV fatty acid concentration and change in composition. Total fatty acid concentration of 3T3-L1 cells and EVs at day 0 and day 15 of differentiation (A and C, respectively). Changes in proportions of individual fatty acids in cells and EVs between day 0 and day 15 of differentiation (B and D, respectively). ****p<0.0001, **p<0.001, **p<0.01, *p<0.05, n=6 (day 0) and n=5 (day 15).
Phospholipid composition
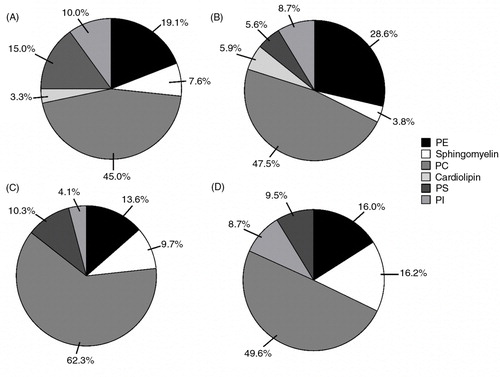
Proportions of phospholipids were different between cells and EVs from day 0 to day 15 (). Phosphatidylcholine (PC) was the most abundant phospholipid present at both time points in cells and EVs. PC content showed a slight increase with differentiation in cells; in contrast, PC was higher in EVs prior to differentiation. The proportion of phosphatidylethanolamine (PE) appeared to increase with differentiation in both cells and EVs whereas both phosphatidylinositol (PI) and sphingomyelin decreased with differentiation in cells, but showed an increase over the same time in EVs. Cells and EVs had higher proportions of PS at day 0 compared with day 15. Cardiolipin was only present in cells and showed an increase from day 0 to day 15.
Fig. 5. Phospholipid composition of cells and EVs following differentiation. Proportions and labelled percentages of phospholipids in: cells at day 0 (A); and day 15 (B), and EVs at day 0 (C); and day 15 (D) n=1. PE=phosphatidylethanolamine; PC=phosphatidylcholine; PS=phosphatidylserine; PI=phosphatidylinositol.
EV protein content
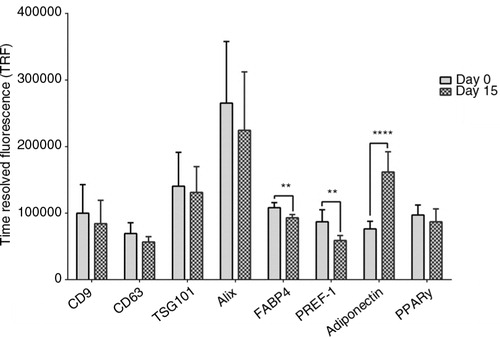
No differences were observed in EV exosomal markers and PPARγ from day 0 to day 15 (). FABP4 and PREF-1 decreased (108,256±7,460 to 93,088±4,804, p=0.002 for FABP4; and 86,958±18,164 to 58,918±7,485 arbitrary TRF units, p=0.006 for PREF-1, respectively) while adiponectin increased (76,242±11,501 to 161,886±30,371 arbitrary TRF units, p<0.0001) with differentiation in EVs.
Fig. 6. Effect of differentiation on EV protein content. The content of vesicular (CD9, CD63, TSG101 and Alix) and adipocyte (FABP4, PREF-1, adiponectin and PPARγ) proteins in 3T3-L1 derived EVs before and following differentiation. Proteins were detected using a streptavidin–europium conjugate and measured using TRF (arbitrary units) **p<0.01, ****p<0.0001, n=3.
Discussion
Adipose tissue is now known to provide more than basic insulation, structural support and lipid storage properties. It is recognised as an endocrine organ that can influence a number of physiological processes through interaction with a variety of tissues, primarily via adipokine secretion (Citation19). More recently adipocytes have been shown in vitro to release EVs (Citation2, Citation3) (Citation4, Citation13) (Citation14, Citation15) , providing an additional potential mechanism of communication for adipocytes. Here we present a detailed characterisation of adipocyte-derived EVs with respect to: structure and morphology; size and concentration; annexin V positivity; fatty acid profile; phospholipid composition; and protein content pre- and post-differentiation.
The evidence for adipocyte EVs acting as paracrine and endocrine communicators is continually growing. For example, Kranendonk et al. recently found EVs from different adipose tissue depots enhance monocyte to macrophage differentiation and affect insulin signalling in hepatocytes (Citation14, Citation15). However, to our knowledge there are no data which report on their size and concentration distributions. We found that EV production per cell was greater at the preadipocyte stage particularly in EVs <300 nm. This may be a consequence (or a cause) of the differentiation process such that EVs act as intercellular communicators to promote transition to a mature adipocyte. This is also supported by the scanning electron micrograph images which show long and numerous projections between cells at day 0, suggesting a local communication network between cells prior to differentiation. Conversely, as anticipated, mature adipocytes at day 15 were much larger and independent of each other, with individual cells containing multiple lipid vacuoles.
Many studies support the principle that release of EVs follows a disruption of the plasma membrane asymmetry of the cell and subsequent exposure of PS. However, it is debated whether this externalised PS is retained on the EV (Citation20, Citation21). We sought to characterise the PS positivity of adipocyte EVs and their corresponding cells by measuring their annexin V positivity. Cells and EVs at both day 0 and day 15 showed relatively low annexin V positivity (<10%); lower than reported for plasma-derived EVs which typically possess between 50 and 90% annexin V positivity (Citation18, Citation22) (Citation23). However, the majority of plasma EVs are derived from platelets and can promote coagulation due to their high density of PS exposure (corresponding with high annexin V binding) (Citation24). It is unlikely that adipocyte-derived EVs would be pro-coagulant perhaps explaining their low annexin V positivity.
Much of the research surrounding EVs focuses on the concentration and/or surface antigens of EVs, and how changes in these characteristics may modulate a change in function. Little is known about the lipid composition of EVs, despite lipids being recognised as important components of many signalling pathways. We therefore used GC-FID to comprehensively characterise the lipid composition of the 3T3-L1 cells and their corresponding EVs pre- and post-differentiation. As expected, total lipid concentration increased with adipogenesis in cells. Interestingly, this too was reflected in the EV fraction, again highlighting a characteristic of the cell of origin that is maintained in the EV. Proportions of individual fatty acids were clearly altered in both cells and EVs with differentiation which likely reflects the transition in function from a preadipocyte to a mature adipocyte. For instance, we observed a large increase in palmitic acid (C16:0), the most abundant storage fatty acid in animals (Citation25), with differentiation of cells and hence accumulation of lipid. The effect of differentiation was also reflected in the presence or lack of certain fatty acids at each time point. For example, eicosatrienoic acid (C20:3n3) was present at day 0 but not at day 15. This polyunsaturated fatty acid is found in poorly vascularised tissues where abundance of free fatty acids is low (Citation26). This loss of eicosatrienoic acid may reflect the transition to a mature adipocyte where concentrations of free fatty acids are higher so it is no longer required. Additionally, the proportion of arachidonic acid (C20:4n6), a major precursor for many cell signalling molecules, was much higher in cells and EVs at day 0 than those at day 15. Taken together with the elevated EV concentration at day 0, this supports the notion that increased EV production in preadipocytes is a consequence and perhaps a communicator of increased signalling in the early stages of differentiation. In keeping with this, exosome isolates from human adipose-derived stem cells (hASCs) undergoing adipogenic differentiation have been reported to assist undifferentiated hASCs to transition towards a mature adipocyte (Citation27). Furthermore, a higher proportion of phospholipids associated with cell signalling, such as PS and PI, were present at the day 0 time point in cells. PS in particular is heavily implicated in EV generation (Citation8, Citation28). Here EV generation was greater at day 0, when, in cells the proportion of PS was ~ 3 X greater than cells at day 15, suggesting an increased reserve of PS to generate EVs at this time point. In the EV fraction, the proportion of PS showed only a slight decrease with differentiation, suggesting that cells require a higher proportion of PS for the formation of EVs but that this PS is not necessarily incorporated into the EVs. Finally, when comparing the composition of fatty acids between cells and their corresponding EVs at each time point (Supplementary Table II), EVs were shown to be enriched in certain fatty acids that their cells were not. Future work should look to classify these changes in more detail and to analyse whether these differences harbour potential functional implications for EVs. We have previously observed similar differences between fatty acid compositions of plasma and plasma-derived EVs (Citation18, Citation22), suggesting that although EVs reflect their cell of origin in many aspects, they also possess unique characteristics which may affect how they communicate and interact with other cells.
Functional changes in protein expression can also occur within the vesicle following stimulation or stress of the parental cell (Citation29). Flow cytometry is limited to analysing surface antigens of EVs meaning these important alterations are not typically identified. Moreover, due to the low refractive index of EVs, conventional flow cytometers have a lower detection limit of ~200 nm, meaning ~65% of 3T3-L1 EVs would not be detected. Here, we used an in-house developed immuno-phenotyping assay (previously described (Citation30)), used successfully by others in the EV field to analyse both membrane and intravesicular proteins (Citation31). Levels of typical exosomal proteins showed no change with differentiation. Alix, a cytosolic protein associated with endocytic membrane trafficking (Citation32) gave the highest signal of the exosomal markers. This suggests that although the number of EVs is elevated at day 0, the relative expression of exosomal proteins within each EV does not change between the time points. We selected 4 well-established adipocyte markers known to be prevalent at different stages of adipogenesis to analyse within EVs (Citation33, Citation34). PPARγ is a nuclear receptor required for the induction (including the growth arrest of cells (Citation33)) and maintenance of adipogenesis (Citation34). Here, EV PPARγ content showed no difference between day 0 and day 15 suggesting that PPARγ produced by cells during growth arrest at day 0 and by cells maintaining differentiation at day 15 is also passed into corresponding EVs. Levels of PREF-1 and adiponectin in EVs also seem to reflect the stage of differentiation of the cell. PREF-1 is an EGF-like protein that represses differentiation, promoting a preadipocyte phenotype (Citation35). Here PREF-1 decreased from day 0 to day 15, in keeping with progression to a mature adipocyte phenotype. Conversely, adiponectin, a major adipokine produced by mature adipocytes (Citation36) increased in EVs with differentiation as the cells mature and accumulate lipid. Interestingly, FABP4, a cytoplasmic fatty acid trafficking protein (Citation37) decreased in EVs with differentiation. FABP4 is a dominant protein in mature adipocytes, accounting for ~1% of the total cytosolic fraction (Citation38). This again indicates that EVs do not always reflect their cell of origin.
There are currently a number of issues surrounding standardisation of protocols in the EV field, meaning preparatory techniques are constantly being updated. Here differential centrifugation was employed to isolate vesicles as described previously (Citation13). Interim centrifugation speeds between 10,000 and 20,000×g have been recently reported to pellet some larger microvesicles (Citation39). Therefore a limitation of this study may be the use of a 15,000×g spin which may have pelleted larger microvesicles as well as cell debris and apoptotic bodies. However, a range of EVs up to 1 µm are still detectable (C) indicating larger microvesicles are still present. Serum-free media was used for the conditioning time for EV isolation: 24 hours prior to day 0 and day 15 (Supplementary Fig. 2). The requirements of the cells are different at these two stages hence serum-free media was supplemented with insulin prior to day 15, whereas media for day 0 was not. This was to minimise changes to normal media at each time point components but we do acknowledge this may have affected EV release at day 15. A further limitation is the use of a cell line for characterisation, although 3T3-L1 cells are widely used as a reliable model to study adipocyte biology (Citation40). Other groups have successfully isolated EVs from primary adipocyte sources and have similarly found the presence of adipocyte and exosomal markers within adipocyte EVs (Citation14, Citation15) (Citation41). Flow cytometry to assess EV annexin V positivity was conducted on EVs directly. Many conventional flow cytometers have a practical lower limit of ~200 nm, meaning many smaller microvesicles and exosomes will not be detected by this method. Therefore, the annexin V positivity of the EVs may have been underestimated here, particularly if a proportion of larger microvesicles (known to have a greater annexin V positivity) were removed by the 15,000×g spin. To ensure capture of the whole EV spectrum, future studies should use bead-based capture of EVs with flow cytometry or an alternative method to asses EV annexin V positivity.
In summary, the production of adipocyte-derived EVs is significantly affected by differentiation. Prior to adipogenesis, the production of EVs enriched in pro-signalling fatty acids is high, suggesting that EVs may aid communication between preadipocytes to enhance the transition to a mature adipocyte. Adipocyte-derived EVs possess many similar characteristics of their cell of origin such as low annexin V positivity and similar lipid content. However, adipocyte-derived EVs may also possess unique qualities that confer different functional properties such as a differential fatty acid composition that change with the stage of differentiation. Future studies will explore the functional impact of adipocyte EVs on the control of adipogenesis and their wider implications in cardiovascular disease.
Conflict of interest and funding
This work was supported by the Ewan Maclean scholarship fund provided through Cardiff University.
Supplementary data
Download PDF (18.8 KB)Disclosure statement
The authors have nothing to disclose.
Notes
To access the supplementary material to this article, please see Supplementary files under ‘Article Tools’.
Related Research Data
References
- Greenberg AS, Obin MS. Obesity and the role of adipose tissue in inflammation and metabolism. Am J Clin Nutr. 2006; 83: 461S–465S.
- Aoki N, Jin-no S, Nakagawa Y, Asai N, Arakawa E, Tamura N et al. Identification and characterization of microvesicles secreted by 3T3-L1 adipocytes: redox- and hormone-dependent induction of milk fat globule-epidermal growth factor 8-associated microvesicles. Endocrinology. 2007; 148: 3850–62.
- Kralisch S, Ebert T, Lossner U, Jessnitzer B, Stumvoll M, Fasshauer M. Adipocyte fatty acid-binding protein is released from adipocytes by a non-conventional mechanism. Int J Obes (Lond). 2014; 38: 1251–4.
- Müller G, Jung C, Straub J, Wied S, Kramer W. Induced release of membrane vesicles from rat adipocytes containing glycosylphosphatidylinositol-anchored microdomain and lipid droplet signalling proteins. Cell Signal. 2009; 21: 324–38.
- Van der Pol E, Böing AN, Harrison P, Sturk A, Nieuwland R. Classification, functions, and clinical relevance of extracellular vesicles. Pharmacol Rev. 2012; 64: 676–705.
- Barry OP, Kazanietz MG, Praticò D, FitzGerald GA. Arachidonic acid in platelet microparticles up-regulates cyclooxygenase-2-dependent prostaglandin formation via a protein kinase C/mitogen-activated protein kinase-dependent pathway. J Biol Chem. 1999; 274: 7545–56.
- Poon IKH, Lucas CD, Rossi AG, Ravichandran KS. Apoptotic cell clearance: basic biology and therapeutic potential. Nat Rev Immunol. 2014; 14: 166–80.
- Colombo M, Raposo G, Théry C. Biogenesis, secretion, and intercellular interactions of exosomes and other extracellular vesicles. Annu Rev Cell Dev Biol. 2014; 30: 255–89.
- Harding C, Heuser J, Stahl P. Receptor-mediated endocytosis of transferrin and recycling of the transferrin receptor in rat reticulocytes. J Cell Biol. 1983; 97: 329–39.
- Dachary-Prigent J, Freyssinet JM, Pasquet JM, Carron JC, Nurden AT. Annexin V as a probe of aminophospholipid exposure and platelet membrane vesiculation: a flow cytometry study showing a role for free sulfhydryl groups. Blood. 1993; 81: 2554–65.
- Kim D-K, Kang B, Kim OY, Choi D-S, Lee J, Kim SR et al. EVpedia: an integrated database of high-throughput data for systemic analyses of extracellular vesicles. J Extracell vesicles. 2013; 2 20384, doi: http://dx.doi.org/10.3402/jev.v2i0.20384.
- Nomura S, Komiyama Y, Kagawa H, Iwasaka T, Takahashi H, Fukuhara S. Microparticles and coronary artery disease. Am J Hematol. 1997; 56: 296.
- Aoki N, Yokoyama R, Asai N, Ohki M, Ohki Y, Kusubata K et al. Adipocyte-derived microvesicles are associated with multiple angiogenic factors and induce angiogenesis in vivo and in vitro. Endocrinology. 2010; 151: 2567–76.
- Kranendonk MEG, Visseren FLJ, van Balkom BWM, Nolte-'t Hoen ENM, van Herwaarden JA, de Jager W et al. Human adipocyte extracellular vesicles in reciprocal signaling between adipocytes and macrophages. Obesity (Silver Spring). 2014; 22: 1296–308.
- Kranendonk MEG, Visseren FLJ, van Herwaarden JA, Nolte-'t Hoen ENM, de Jager W, Wauben MHM et al. Effect of extracellular vesicles of human adipose tissue on insulin signaling in liver and muscle cells. Obesity (Silver Spring). 2014; 22: 2216–23.
- Garaiova I, Guschina IA, Plummer SF, Tang J, Wang D, Plummer NT. A randomised cross-over trial in healthy adults indicating improved absorption of omega-3 fatty acids by pre-emulsification. Nutr J. 2007; 6: 4.
- Garbus J, Deluca HF, Loomans ME, Strong FM. The rapid incorporation of phosphate into mitochondrial lipids. J Biol Chem. 1963; 238: 59–63.
- Connolly KD, Willis GR, Datta DBN, Ellins EA, Ladell K, Price DA et al. Lipoprotein-apheresis reduces circulating microparticles in individuals with familial hypercholesterolemia. J Lipid Res. 2014; 55: 2064–72.
- Wood IS, de Heredia FP, Wang B, Trayhurn P. Cellular hypoxia and adipose tissue dysfunction in obesity. Proc Nutr Soc. 2009; 68: 370–7.
- Connor DE, Exner T, Ma DDF, Joseph JE. The majority of circulating platelet-derived microparticles fail to bind annexin V, lack phospholipid-dependent procoagulant activity and demonstrate greater expression of glycoprotein Ib. Thromb Haemost. 2010; 103: 1044–52.
- Zonneveld MI, Brisson AR, Herwijnen MJC van, Tan S, Lest CHA van de, Redegeld FA et al. Recovery of extracellular vesicles from human breast milk is influenced by sample collection and vesicle isolation procedures. J Extracell Vesicles. 2014; 3: 24215. http://dx.doi.org/10.3402/jev.v3.24215.
- Willis GR, Connolly K, Ladell K, Davies TS, Guschina IA, Ramji D et al. Young women with polycystic ovary syndrome have raised levels of circulating annexin V-positive platelet microparticles. Hum Reprod. 2014; 29: 2756–63.
- Christersson C, Johnell M, Siegbahn A. Evaluation of microparticles in whole blood by multicolour flow cytometry assay. Scand J Clin Lab Invest. 2013; 73: 229–39.
- Sinauridze EI, Kireev DA, Popenko NY, Pichugin AV, Panteleev MA, Krymskaya OV et al. Platelet microparticle membranes have 50- to 100-fold higher specific procoagulant activity than activated platelets. Thromb Haemost. 2007; 97: 425–34.
- Gurr MI, Harwood JL, Frayn KN. Lipid Biochemistry. 2002; Oxford, UK: Blackwell Science. 95. 5th ed.
- Hamazaki T, Nagasawa T, Hamazaki K, Itomura M. Inhibitory effect of 5,8,11-eicosatrienoic acid on angiogenesis. Prostaglandins Leukot Essent Fatty Acids. 2012; 86: 221–4.
- Kyoung S, In J, Seong H, Ji S, Jae H, Yong W. Exosomes secreted during adipogenic differentiation of human adipose-derived stem cells induce adipogenesis of human adipose-derived stem cells. J Extracell Vesicles. 2015; 4 27783, doi: http://dx.doi.org/10.3402/jev.v4.27783 [Abstract P-XIV-2]..
- Hugel B, Martínez MC, Kunzelmann C, Freyssinet J-M. Membrane microparticles: two sides of the coin. Physiology (Bethesda). 2005; 20: 22–7.
- Jong OG de, Verhaar MC, Chen Y, Vader P, Gremmels H, Posthuma G et al. Cellular stress conditions are reflected in the protein and RNA content of endothelial cell-derived exosomes. J Extracellular Vesicles. 2012; 1: 18396. http://dx.doi.org/10.3402/jev.v1i0.18396.
- Webber J, Stone TC, Katilius E, Smith BC, Gordon B, Mason MD et al. Proteomics analysis of cancer exosomes using a novel modified aptamer-based array (SOMAscanTM) platform. Mol Cell Proteomics. 2014; 13: 1050–64.
- Welton JL, Webber JP, Botos L-A, Jones M, Clayton A. Ready-made chromatography columns for extracellular vesicle isolation from plasma. J Extracell Vesicles. 2015; 4: 27269. http://dx.doi.org/10.3402/jev.v4.27269.
- Katoh K, Shibata H, Suzuki H, Nara A, Ishidoh K, Kominami E et al. The ALG-2-interacting protein Alix associates with CHMP4b, a human homologue of yeast Snf7 that is involved in multivesicular body sorting. J Biol Chem. 2003; 278: 39104–13.
- Gregoire FM, Smas CM, Sul HS. Understanding adipocyte differentiation. Physiol Rev. 1998; 78: 783–809.
- Rosen ED, MacDougald OA. Adipocyte differentiation from the inside out. Nat Rev Mol Cell Biol. 2006; 7: 885–96.
- Smas CM, Sul HS. Pref-1, a protein containing EGF-like repeats, inhibits adipocyte differentiation. Cell. 1993; 73: 725–34.
- Park SY, Lee JH, Kim KY, Kim EK, Yun SJ, Kim CD et al. Cilostazol increases 3T3-L1 preadipocyte differentiation with improved glucose uptake associated with activation of peroxisome proliferator-activated receptor-gamma transcription. Atherosclerosis. 2008; 201: 258–65.
- Hertzel AV, Bernlohr DA. The mammalian fatty acid-binding protein multigene family: molecular and genetic insights into function. Trends Endocrinol Metab. 2000; 11: 175–80.
- Baxa CA, Sha RS, Buelt MK, Smith AJ, Matarese V, Chinander LL et al. Human adipocyte lipid-binding protein: purification of the protein and cloning of its complementary DNA. Biochemistry. 1989; 28: 8683–90.
- Witwer KW, Buzás EI, Bemis LT, Bora A, Lässer C, Lötvall J et al. Standardization of sample collection, isolation and analysis methods in extracellular vesicle research. J Extracell Vesicles. 2013; 2: 20360. http://dx.doi.org/10.3402/jev.v2i0.20360.
- Ntambi JM, Young-Cheul K. Adipocyte differentiation and gene expression. J Nutr. 2000; 130: 3122S–3126S.
- Eguchi A, Mulya A, Lazic M, Radhakrishnan D, Berk MP, Povero D et al. Microparticles release by adipocytes act as “find-me” signals to promote macrophage migration. PLoS One. 2015; 10: e0123110.