Abstract
Because procedures of handling and storage of body fluids affect numbers and composition of extracellular vesicles (EVs), standardization is important to ensure reliable and comparable measurements of EVs in a clinical environment. We aimed to develop standard protocols for handling and storage of human body fluids for EV analysis. Conditions such as centrifugation, single freeze–thaw cycle, effect of time delay between blood collection and plasma preparation and storage were investigated. Plasma is the most commonly studied body fluid in EV research. We mainly focused on EVs originating from platelets and erythrocytes and investigated the behaviour of these 2 types of EVs independently as well as in plasma samples of healthy subjects. EVs in urine and saliva were also studied for comparison. All samples were analysed simultaneously before and after freeze–thawing by resistive pulse sensing, nanoparticle tracking analysis, conventional flow cytometry (FCM) and transmission (scanning) electron microscopy. Our main finding is that the effect of centrifugation markedly depends on the cellular origin of EVs. Whereas erythrocyte EVs remain present as single EVs after centrifugation, platelet EVs form aggregates, which affect their measured concentration in plasma. Single erythrocyte and platelet EVs are present mainly in the range of 100–200 nm, far below the lower limit of what can be measured by conventional FCM. Furthermore, the effects of single freeze–thaw cycle, time delay between blood collection and plasma preparation up to 1 hour and storage up to 1 year are insignificant (p>0.05) on the measured concentration and diameter of EVs from erythrocyte and platelet concentrates and EVs in plasma, urine and saliva. In conclusion, in standard protocols for EV studies, centrifugation to isolate EVs from collected body fluids should be avoided. Freezing and storage of collected body fluids, albeit their insignificant effects, should be performed identically for comparative EV studies and to create reliable biorepositories.
To access the supplementary material to this article, please see Supplementary files under ‘Article Tools’.
Extracellular vesicles (EVs) are membrane-enclosed vesicles which are released from cells (Citation1). EVs are present in all human body fluids, where they contribute to intercellular signalling, coagulation activation and the inflammatory response (Citation1–Citation3). In these body fluids, the concentration, cellular origin, composition and functions of EVs are disease (state)-dependent (Citation1, Citation4). Thus, measuring the concentration and the cellular origin of EVs in body fluids has a potential to provide novel and non-invasive biomarkers of disease, and may also be useful for prognosis and treatment of diseases.
Standardisation of body fluid collection, handling and storage is of key importance in EV research because this is the first major step towards improved comparison of measurement results between laboratories (Citation5). The Scientific and Standardization Committee (SSC) on Vascular Biology of the International Society of Thrombosis and Haemostasis (ISTH) have made attempts to standardise pre-analytical variables in the case of human blood collection and plasma preparation for enumeration of platelet-derived EVs by flow cytometry (FCM) (Citation6, Citation7). Although the inter-laboratory variability of platelet-derived EVs counts was indeed reduced, these protocols need to be validated for EVs from other cell types and body fluids (Citation6). Moreover, the true relevance and conclusions from these studies are limited because EV detection by conventional flow cytometers is attributed to relatively large single vesicles (~1%) and swarm detection of smaller vesicles (~99%) (Citation8–Citation10).
Our study is a collaborative study within the context of the European Metrology Research Program, METVES (www.metves.eu). The goal of this study is to develop standard protocols for handling and storage of human body fluids for EV analysis. Human plasma, which contains EVs from platelets and erythrocytes, is the most studied body fluid in clinical EV research (Citation5). We studied EVs isolated from platelet and erythrocyte concentrates and in plasma. Further, there has been increasing interest in recent years to study EVs in body fluids other than plasma (Citation11, Citation12). Therefore, EVs in urine and saliva were studied for comparison. The pre-analytical variables we investigated were centrifugation, freezing and storage duration. Since the current technologies have different capabilities and limitations for quantification of EVs (Citation13), we analysed all samples simultaneously by resistive pulse sensing (RPS), nanoparticle tracking analysis (NTA), transmission (scanning) electron microscopy and conventional FCM.
Materials and methods
Materials
Outdated erythrocyte concentrates and platelet concentrates were obtained from Sanquin (Amsterdam, The Netherlands). For phlebotomy, a 21G straight needle from BD Eclipse™ [Becton Dickinson (BD), San Jose, CA] and a 3.2% (0.109 M) BD Vacutainer 2.7 mL citrate blood collection tube (BD) were used. Phosphate buffer saline (PBS) with pH 7.5 was composed of sodium chloride (154 mmol/L), di-sodium hydrogen phosphate dihydrate (1.24 mmol/L) and sodium dihydrogen phosphate dihydrate (0.21 mmol/L). PBS-citrate contained additional 0.32% trisodium citrate (pH 7.4). Acid citrate dextrose (ACD, pH 4.4) contained trisodium citrate (85 mmol/L), d-glucose (110 mmol/L) and citric acid (71 mmol/L). All chemicals were from Merck (Darmstadt, Germany). All buffers and reagent were filtered through a 0.22-µm filter with polyethersulfone membrane (Merck Millipore, Cork, Ireland) before use. Fluorescein isothiocyanate (FITC)-labelled IgG1 and phycoerythrin (PE)-labelled IgG1 (both clone X40) were from BD, PE-labelled CD61 (clone VI-PL2) from BD Pharmingen (San Jose, CA), FITC-labelled CD235a (clone JC159) from DAKO (Glostrup, Denmark) and FITC-labelled lactadherin (clone MFG-E8) from Haematologic Technologies Inc. (Essex Junction, VT).
Preparation of EVs from erythrocytes and platelets
To isolate EVs from erythrocytes and platelets, erythrocyte and platelet concentrates were diluted 2-fold with PBS. To the diluted platelet concentrate 1:5 (volume/volume), ACD was added before centrifugation. Double centrifugation at 1,550×g for 20 minutes at 20°C was used to remove either erythrocytes or platelets. The cell-depleted supernatants were collected and used as a starting material for subsequent EV studies, or frozen at −20°C, −80°C, or snap-frozen in liquid nitrogen (−196°C) and stored at −80°C before use. To isolate EVs, 1 mL cell-depleted supernatant was subjected to centrifugation conditions at 18,890×g (0.5 and 2 hours) or 100,000×g (0.5 and 2 hours). EV pellets were resuspended by pipetting up and down 5 times using a micropipette with a 200 µL pipet tip, and were subsequently vortexed for 20 seconds. Isolated EVs were measured directly after the centrifugation and resuspension.
Blood collection and plasma preparation
Blood samples were collected from 5 healthy and overnight fasting donors who gave informed consent. After collection, blood (2.7 mL) was left for 5 minutes or 1 hour at room temperature before preparation of plasma. Plasma was prepared by centrifuging at 20°C, 1,550×g for 20 minutes. Plasma was collected until at least 1 cm above the buffy coat and the collected plasma was centrifuged again at 1,550×g for 20 minutes at 20°C. Then, (platelet-depleted) plasma was collected. Plasma was measured immediately and after a single freeze–thaw cycle. Plasma was frozen at −20, −80 or −196°C and stored at −80°C for 6 months and 1 year. Plasma was thawed on melting ice before measurement. To isolate EVs, 1 mL of plasma was centrifuged at 18,890×g for 2 hours at 20°C. The supernatant (975 µL) was removed carefully, and in the residual 25 µL EVs were resuspended and measured.
Urine and saliva collection
Urine and saliva were collected from 5 healthy and overnight fasting donors who gave informed consent. Urine (10 mL) and saliva (25 mL) were collected and kept on ice. To prepare cell-free urine, urine was centrifuged at 180×g for 10 minutes at 4°C, followed by centrifugation at 1,550×g for 20 minutes at 4°C. Supernatant from urine was collected. To prepare cell-free saliva, saliva was centrifuged at 300×g for 10 minutes at 4°C, followed by centrifugation at 1,550× g for 20 minutes at 4°C. Supernatant from saliva was collected and diluted 2-fold with PBS. EV-containing supernatants of both urine and saliva were measured directly and after a single freeze–thaw cycle. Samples were frozen at −20, −80 or −196°C and stored at −80°C for a period of 1 year. Urine and saliva were thawed on melting ice before measurements.
Resistive pulse sensing
RPS (qNano, Izon Science, Christchurch, New Zealand) is a technique based on the Coulter principle allowing single-particle measurements in suspension (Citation13). An RPS instrument equipped with NP200 nanopore (approximate detection range: 100–400 nm) was used to measure the concentration and size distribution of particles in suspension. RPS was operated at a pressure of 7 or 15 mBar depending on the particle rate (ideally >100/minute). The voltage was operated at 0.34–0.5 V and the stretch was adjusted until the baseline current of the signal trace was approximately 100 nA (Citation14). Carboxylated polystyrene beads with concentration 2.4×10⁹/mL (203 nm, Izon Science) were used to calibrate the size and concentration following manufacturer's instructions. EV-containing samples were diluted 2- to 20-fold in PBS and measured using identical settings. The measurement time was 10 minutes or until 500 counts was reached, whichever came first. Measurement and analysis were performed using Izon Control Suite v2.2.2.44 software.
Nanoparticle tracking analysis
NTA determines the size and concentration of particles by tracking the Brownian motion in a dark-field microscope (Citation13). An NS500 (NanoSight Ltd., London, UK) equipped with an EMCCD camera (Andor Technology, Tokyo, Japan) and a 405-nm laser was used. Measurements were performed as described previously (Citation15), resulting in a minimum detectable EV diameter of 70–90 nm (Citation16). EV-containing samples were diluted 50- to 500-fold with PBS before measurement. Videos of 30 seconds were recorded at 10 different positions at camera level 14/15 and analysed using threshold 10–16 by NTA v2.3.0.17 (NanoSight).
Flow cytometry
EV-containing samples (5 µL) were incubated with 5 µL of a monoclonal antibody or lactadherin and diluted with PBS to a final volume of 50 µL. These samples were incubated in the dark for 15 minutes at room temperature. After incubation, 300 µL PBS was added. PBS-citrate instead of PBS was used for undiluted plasma samples to avoid clotting. Samples were analysed for 1 minute by FCM using a FACSCalibur with CellQuest software (BD) at a flow rate of 60 µL/minute. The detector settings used throughout the experiments and the calculation of EV concentration were as described previously (Citation17, Citation18).
Electron microscopy
EVs were fixed at room temperature overnight by 0.1% (weight/volume, w/v) paraformaldehyde (Electron Microscopy Sciences, Hatfield, PA). Next, a 200-mesh EM copper grid with formvar coating (Electron Microscopy Sciences) was put on top of a sample (10 µL), and incubated for 7 minutes at room temperature. The grids were transferred to 1.75% uranyl acetate (w/v) for negative staining. The grid was imaged using a Tecnai 12 transmission electron microscopy (TEM, FEI Company, Eindhoven, The Netherlands), operated at 80 kV. The same grids were also imaged using transmission scanning electron microscopy (TSEM), which provides 3D images to give more information on the shape of EVs (Citation19). We used a commercial Zeiss Leo Supra 35 VP equipped with a transmission detector (K. E. Developments, Suffolk, UK; Carl Zeiss, Oberkochen, Germany). TSEM was operated at 30 kV. To prevent user variability and to reduce labour time, we developed image-processing software to analyse the size of EVs (Supplementary File S1, Supplementary Table S1, and S).
Fig. 1. Measurements of cell-free supernatants containing erythrocyte and platelet EVs. Concentration of erythrocyte EVs (a) and platelet EVs (b) in cell-depleted supernatants (starting materials) were measured by RPS, NTA and FCM using antibodies CD235a and CD61 respectively. Particle size distribution indicated by minimum, mode and maximum particle diameter (nm) detected by RPS and NTA in both cell-free supernatants containing erythrocyte EVs (c) and platelet EVs (d) are presented.
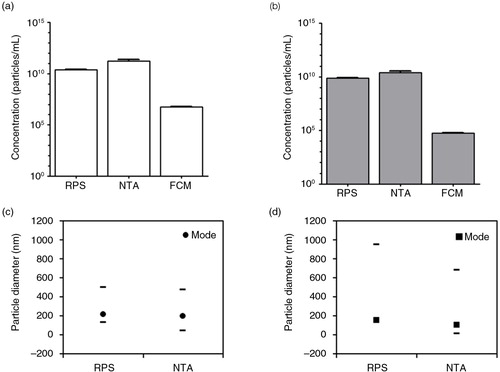
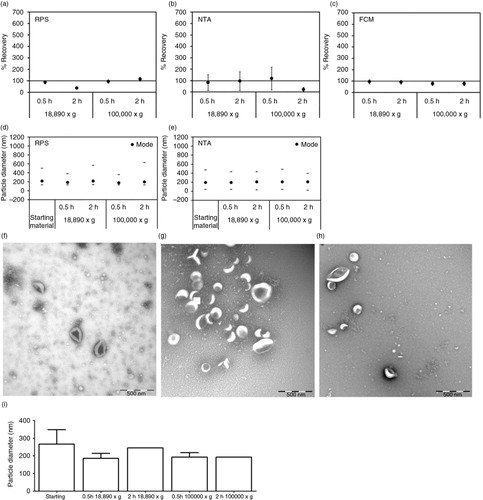
Fig. 2. Effect of centrifugation on erythrocyte EVs. Cell-depleted supernatant containing erythrocyte EVs (starting material) was centrifuged using different centrifugal force and time. On the x-axis of graphs a–e and i, the centrifugal force (× g) and time (hour, h) are indicated. Isolated erythrocyte EVs were reconstituted in PBS and measured immediately by RPS (a), NTA (b) and FCM using antibody CD235a (c). Percentage of recovery indicated on the y-axis of graphs a–c was calculated by comparing concentrations measured from erythrocyte EVs prepared by different centrifugation conditions with those measured from the starting material. Error bars represented measurement uncertainties estimated with each applied technique as presented in Supplementary Table S2. Particle size distribution indicated by minimum, mode and maximum particle diameter (nm) detected by RPS (d) and NTA (e) in both starting material and isolated erythrocyte EVs samples are presented. All results shown in a–e were from single measurements. Representative TEM images of erythrocyte EVs in the starting material (f), centrifuged at 18,890×g for 0.5 hour (g) and at 100,000×g for 2 hours (h) are shown. Scale bars of all TEM images are 500 nm. Graph showing results of TSEM measurement of the diameter of erythrocyte EVs in the fresh starting material and in the fresh isolated erythrocyte EVs samples is presented (i).
Statistical analysis
A paired t-test and one-way ANOVA were used to compare values obtained from measurements of EVs in plasma, urine or saliva. Differences were considered significant at p<0.05.
Uncertainty analysis
The measurement uncertainties of the diameter and concentration as determined by RPS, NTA and FCM in Figs. (Citation1–Citation3) were based on measurements of traceable reference beads (Nanosphere, Thermo Fisher, Waltham, MA) as described previously (Citation16). The error bars represented the average deviation of the measured mean diameter and concentration of the reference beads from their expected values. Please see Supplementary File S2 and Table S2 for detailed information.
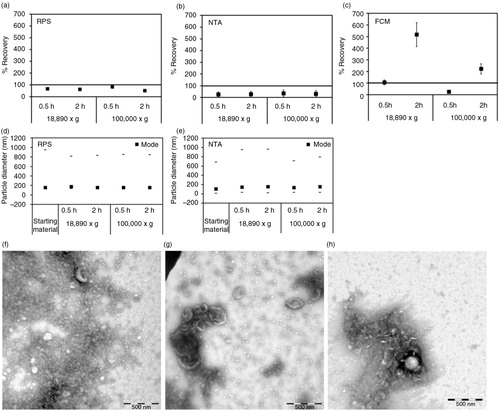
Fig. 3. Effect of centrifugation on platelet EVs. Cell-depleted supernatant containing platelet EVs (starting material) was centrifuged using different centrifugal force and time. On the x-axis of graphs a–e, the centrifugal force (x g) and time (hour, h) are indicated. Isolated platelet EVs were reconstituted in PBS and measured immediately by RPS (a), NTA (b) and FCM using antibody CD61 (c). Percentage of recovery indicated on the y-axis of graphs a–c was calculated by comparing concentrations measured from platelet EVs prepared by different centrifugation conditions with those measured from the starting material. Error bars represented measurement uncertainties estimated with each applied technique as presented in Supplementary Table S2. Particle size distribution indicated by minimum, mode and maximum particle diameter (nm) detected by RPS (d) and NTA (e) in both starting material and isolated platelet EVs samples are presented. All results shown in a–e were from single measurements. Representative of TEM images of platelet EVs in the starting material (f), centrifuged at 18,890×g for 0.5 hour (g) and at 100,000×g for 2 hours (h) are shown. Scale bars of all TEM images are 500 nm.
Results
EVs from erythrocyte and platelet concentrates
Cell-free supernatants
First, we studied the concentration of particles in cell-free supernatants of erythrocyte and platelet concentrates by RPS, NTA and FCM. Both cell-free supernatants had particle concentrations of 1010–1011/mL (a and b). In contrast, FCM detected around 106/mL erythrocyte (CD235a+) EVs and around 105/mL platelet (CD61+) EVs (a and b, respectively). This more than 104-fold difference was caused by differences in the smallest detectable particle diameter of the instruments (Citation16). In addition, because both RPS and NTA detected particles and not exclusively EVs, the actual differences in EV concentration may be less than measured.
The mode diameter, which represents the most abundant particle diameter, was between 100 and 200 nm for both samples (c and d). However, the maximum detected diameter was <600 nm for erythrocyte EVs but >700 nm for platelet EVs.
Centrifugation
Erythrocyte and platelet EVs were subjected to centrifugation at 18,890×g (0.5 and 2 hours) and 100,000×g (0.5 and 2 hours). For erythrocyte EVs, centrifugation (a) hardly affected the recovery of concentrations of particles or erythrocyte (CD235a+) EVs (a–c), (b) did not change the particle mode diameter (d and e) and (Citation3) did not induce clumping or aggregation (EVs in f compared to g and h). The unchanged particle diameter was confirmed by TSEM (216±37 nm, i).
In contrast, centrifugation markedly affected the recovery of platelet EVs. After centrifugation, recovery was <65% as measured by RPS (a) and <30% by NTA (b). However, with FCM we observed a recovery of CD61+ (platelet) EVs of 200–517% after 2 hours of centrifugation (c). The increase of CD61+ EVs can be explained by the formation of large aggregates of platelet EVs of several microns in diameter after centrifugation, as confirmed by TEM (EVs in f compared to g and h). Because the size of the aggregates falls within the detection range of FCM, the CD61+ events were elevated compared to the starting material. The estimated concentration of aggregates was about 105/mL, which was too low to be detected by RPS or NTA, because these techniques typically analyse <0.1 µL per measurement. Furthermore, for RPS the aggregates were too large to pass the pore. Centrifugation at 100,000×g for 0.5 hour also caused the pellet of platelet EVs to stick tightly to the tube and it was difficult to resuspend the pellet. Consequently, the recovery of platelet EVs after centrifugation was low (<30%, c). The mode diameter of platelet EVs measured by RPS and NTA remained 150 nm (d and e), which suggested that aggregate formation did not affect diameter measurement of the remaining single EVs in suspension.
Single freeze–thaw cycle
To study the effect of freezing and thawing on EVs, cell-depleted supernatants containing erythrocyte and platelet EVs (starting materials) were frozen at −20, −80 or −196°C, stored at −80°C and thawed on melting ice before analysis. After a single freeze–thaw cycle, the particle concentration in the starting materials of erythrocyte EVs and platelet EVs remained nearly unchanged (a and b, respectively) and the effects on particle diameter were moderate (c and d). The concentrations of erythrocyte (CD235a+) EVs remained unaffected after a single freeze–thaw cycle, except for a 10-fold decrease of the concentration of erythrocyte EVs frozen at −20°C (a). The concentrations of platelet (CD61+) EVs remained unaffected after a single freeze–thaw cycle (b). Using TEM, no changes in morphology were observed on erythrocyte and platelet EVs after a single freeze–thaw cycle (e and f, respectively).
Fig. 4. Effect of a single freeze–thaw cycle on erythrocyte and platelet EVs. Starting materials containing erythrocyte and platelet EVs were measured directly after preparation and after a single freeze–thaw cycle. Starting materials were frozen at different temperatures (−20, −80 or −196°C). Concentration measurements in the erythrocyte EVs were done by RPS, NTA and FCM using antibody CD235a (a). Also, concentration measurements in the platelet EVs were done by RPS, NTA and FCM using antibody CD61 (b). The particle mode diameter of erythrocyte EVs (c) and platelet EVs (d) were measured by RPS and NTA. All results presented were from a single measurement. Error bars represented measurement uncertainties estimated from the applied techniques as presented in Supplementary Table S2. Representative TEM images of erythrocyte EVs (e) and platelet EVs (f) after frozen at −196°C, storage at −80°C and thawing on ice are presented. Scale bars are 500 nm.

Plasma EVs
Centrifugation
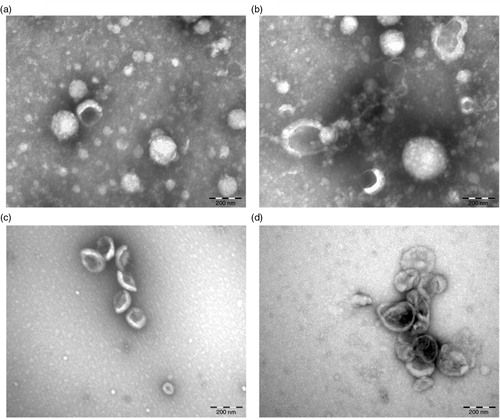
TEM analysis was performed to investigate the effect of centrifugation on plasma EVs. a and b shows electron micrographs of aggregates of proteins and EVs from (non-diluted) centrifuged plasma at 18,890×g for 2 hours. To reduce the protein concentration, the same plasma was diluted 8-fold in PBS-citrate prior to centrifugation. c and d shows EVs isolated from this diluted plasma, thus without the abundant presence of proteins. Nevertheless, we still observed aggregates of EVs after centrifugation (d). Therefore, centrifugation for isolation of EVs was not used for further experiments in the present study.
Time delay between blood collection and plasma preparation
The effect of time delay between blood collection and plasma preparation on plasma concentrations of particles and EVs was studied using blood from fasting healthy individuals (n=5). Blood was processed either within 5 minutes or kept at room temperature for 1 hour before plasma preparation. Based on the results presented in and , we decided to avoid centrifugation to isolate plasma EVs. Thus, EVs were measured in plasma directly.
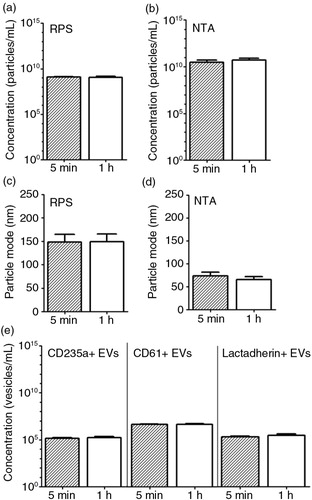
We observed that the particle concentration and mode diameter detected by RPS and NTA were unaffected after 1 hour (a–d, p>0.05). The concentrations of CD235+, CD61+ and lactadherin+ (phosphatidylserine-exposing) EVs detected by FCM were also unaffected (e, p>0.05). Taken together, the time delay between blood collection and handling had no significant effects under these conditions.
Fig. 6. Effect of time delay between blood collection and plasma preparation on erythrocyte and platelet EVs. Blood samples collected from fasted and healthy individuals (n=5) were centrifuged after 5 minutes (min) and 1 hour (h) of the blood collection. Particle concentration and particle mode diameter (nm) of EVs in plasma were measured by RPS (a, c) and NTA (b, d). Measurement of EVs by FCM used antibody CD235a, antibody CD61 and lactadherin (e).
Single freeze–thaw cycle and storage duration
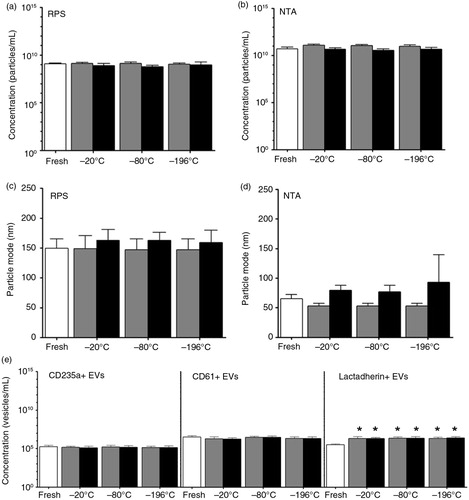
shows the effect of a single freeze–thaw cycle of plasma after storage of 6 months or 1 year. The particle concentration and diameter detected by NTA and RPS were not significantly affected after 6 months or 1 year (a–d, p>0.05). Also no significant changes were observed in the number of CD235a+ and CD61+ EVs up to 1 year as detected by FCM (e). In contrast, the number of lactadherin+ EVs increased 7-fold compared to fresh plasma samples (e, p<0.05). The numbers of lactadherin+ EVs in plasma samples, however, were unaffected either by the temperature of freezing or storage duration (e, p>0.05). These findings indicate that the particle concentration and size, and concentrations of erythrocyte and platelet EVs in plasma were relatively stable after a single freeze–thaw cycle and storage up to 1 year.
Fig. 7. Effect of a single freeze–thaw cycle and storage duration of plasma on erythrocyte and platelet EVs. EVs were measured in fresh plasma (white bars) and in plasma frozen at −20, −80 or −196°C, and stored at −80°C for 6 months (dark grey bars) and 1 year (black bars). Particle concentrations in these samples have been measured by using RPS (a) and NTA (b). RPS and NTA were used to determine the particle mode diameter (nm) of EVs in fresh and stored plasma samples (c and d, respectively). Concentrations of erythrocyte EVs (CD235a+ EVs), platelet EVs (CD61+ EVs) and phosphatidylserine-exposing EVs (lactadherin+ EVs) measured by FCM are shown (e). The asterisk (*) indicates the number of lactadherin+ EVs in the stored plasma is significantly higher than in the fresh plasma (p<0.05).
EVs in urine and saliva
Single freeze–thaw cycle and storage duration
To investigate the characteristics of EVs in other body fluids than blood (plasma) during freeze–thawing and storage, urine and saliva (n=5) were also collected from fasting healthy human subjects.
Both in fresh cell-free urine and saliva samples, the particle concentrations measured by RPS and NTA were 109−1010/mL [a, b (urine), c, and d (saliva)]. Compared to fresh samples, the particle concentrations after a single freeze–thaw cycle in urine and saliva samples decreased 2- and 3-fold, respectively, as measured by RPS, whereas NTA showed a 2-fold increase in particle concentration in both samples (a–d, p<0.05).
Fig. 8. Effect of a single freeze–thaw cycle and storage duration of EVs in urine and saliva. Urine and saliva were collected from fasted and healthy individuals (n=5). EVs in fresh urine and in urine frozen at −20, −80 or −196°C and stored for 1 year at −80°C, were measured by RPS (a) and NTA (b). Similarly, EVs in fresh saliva and in saliva frozen at −20, −80 or −196°C and stored for 1 year at −80°C were measured by RPS (c) and NTA (d). The particle mode diameter (nm) of urinary EVs was determined by RPS (e) and NTA (f). Also, in saliva samples the particle mode diameter (nm) was determined by RPS (g) and NTA (h). Concentrations of lactadherin+ EVs in urine (i) and in saliva (j) samples were measured by FCM. The asterisk (*) indicates that the conditions of a single freeze–thaw cycle and storage duration have significant effects on EVs compared to the fresh condition (p<0.05).
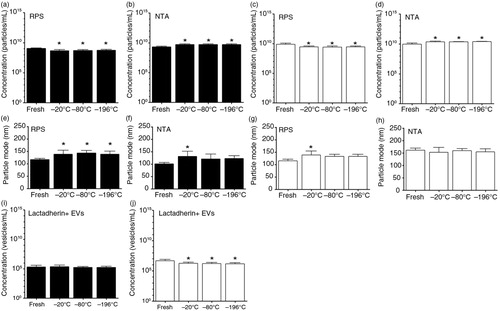
The particle mode diameter detected by RPS and NTA in urine samples was increased about 17% after freezing and storage for 1 year (e and f). For frozen and stored saliva samples, an increase of particle mode diameter of about 17% was observed by RPS (g) but not by NTA (h). In general, particle concentration and diameter were not affected by the temperature used for freezing urine and saliva (p>0.05). Also, using TEM we did not observe substantial morphological changes between EVs present in fresh and frozen/thawed urine and saliva.
Unlike plasma samples, the numbers of lactadherin+ EVs in urine samples were relatively stable (i, p>0.05). For saliva samples, these numbers were 2-fold lower after freezing–thawing and storage up to 1 year (j, p<0.05).
Discussion
Our main finding in this study is that the cellular origin of EVs determines how EVs are affected by centrifugation. We show that after centrifugation, erythrocyte EVs remain present as single EVs, whereas EVs of platelet origin partly form aggregates. Consequently, when centrifugation is used to isolate total EVs from body fluids such as plasma, urine or saliva, which all are known to contain EVs of different cellular origin, we may lose EV subpopulation(s) and overestimate the number of large EVs by FCM. Recently, similar findings were reported by the research group of Alain Brisson using cryo-EM and FCM (Citation20). In our view, ultracentrifugation should be avoided in biofluid EV studies. However, additional comparisons of centrifugation-based isolation with non-centrifugation techniques, such as size-exclusion chromatography (Citation17, Citation21), microfluidics system (Citation22, Citation23) and field-flow fractionation (Citation24, Citation25) will be needed to demonstrate that the latter techniques are definitely superior.
In daily clinical practice, the time between blood collection and plasma preparation is often variable. For the measurement of EVs, the SSC on Vascular Biology of ISTH proposed to prepare plasma containing EVs within 2 hours after blood collection (Citation7). Our present findings are in line with their recommendation.
In clinical multi-centre studies, most collected samples are analysed batch-wise using different assays. Therefore, collected samples are usually frozen and stored until analysis. In general, a single freeze–thaw cycle and storage up to 1 year only modestly affect the concentration and size of particles and EVs in plasma, urine and saliva. These data, however, do not exclude changes in composition and/or function. For example, the 7-fold increase in the number of lactadherin-exposing EVs in plasma samples after a single freeze–thaw cycle (e) reflects changes in membrane phospholipid distribution. Because phosphatidylserine is a cofactor for coagulation, the ability of EVs to support coagulation will increase by a single freeze–thaw cycle.
Since techniques have different capabilities and limitations (Citation13), we used 4 different techniques simultaneously in most experiments. The use of at least 2 different techniques also meets the ISEV minimal requirements to characterise individual EVs (Citation26). We found that the bulk of EVs was in the size range of 100–200 nm, which was far below the lower limit of what can be measured by most flow cytometers (Citation16). Thus, the use of FCM to determine the concentration of EVs is not recommended in studies on pre-analytical variables.
To summarise, our results suggest that ultracentrifugation may result in aggregation of EVs, raising questions about its suitability as an isolation technique. In addition, for comparative studies on EVs in body fluids and to create reliable biorepositories, it is essential that pre-analytical conditions such as freezing and storage are similar for all samples to circumvent systematic errors.
Conflict of interest and funding
The authors declare no conflicts of interests.
Supplementary Material
Download PDF (111.9 KB)Acknowledgements
This work is funded by the European Metrology Research Programme (EMRP) under the Joint Research Project HLT02 (www.metves.eu). The EMRP is jointly funded by the EMRP participating countries within the European Association of National Metrology Institutes and the European Union.
Notes
To access the supplementary material to this article, please see Supplementary files under ‘Article Tools’.
References
- Yuana Y, Sturk A, Nieuwland R. Extracellular vesicles in physiological and pathological conditions. Blood Rev. 2013; 27: 31–9.
- Berckmans RJ, Sturk A, van Tienen LM, Schaap MC, Nieuwland R. Cell-derived vesicles exposing coagulant tissue factor in saliva. Blood. 2011; 117: 3172–80.
- Franz C, Boing AN, Hau CM, Montag M, Strowitzki T, Nieuwland R, etal. Procoagulant tissue factor-exposing vesicles in human seminal fluid. J Reprod Immunol. 2013; 98: 45–51.
- van Der Pol E, Boing AN, Harrison P, Sturk A, Nieuwland R. Classification, functions, and clinical relevance of extracellular vesicles. Pharmacol Rev. 2012; 64: 676–705.
- Witwer KW, Buzas EI, Bemis LT, Bora A, Lasser C, Lotvall J, etal. Standardization of sample collection, isolation and analysis methods in extracellular vesicle research. J Extracell Vesicles. 2013; 2 20360, doi: http://dx.doi.org/10.3402/jev.v2i0.20360 [PubMed CentralFull Text].
- Lacroix R, Judicone C, Mooberry M, Boucekine M, Key NS, Dignat-George F. Standardization of pre-analytical variables in plasma microparticle determination: results of the International Society on Thrombosis and Haemostasis SSC Collaborative workshop. J Thromb Haemost. 2013; 11: 1190–3.
- Lacroix R, Judicone C, Poncelet P, Robert S, Arnaud L, Sampol J, etal. Impact of pre-analytical parameters on the measurement of circulating microparticles: towards standardization of protocol. J Thromb Haemost. 2012; 10: 437–46.
- Ayers L, Kohler M, Harrison P, Sargent I, Dragovic R, Schaap M, etal. Measurement of circulating cell-derived microparticles by flow cytometry: sources of variability within the assay. Thromb Res. 2011; 127: 370–7.
- Dey-Hazra E, Hertel B, Kirsch T, Woywodt A, Lovric S, Haller H, etal. Detection of circulating microparticles by flow cytometry: influence of centrifugation, filtration of buffer, and freezing. Vasc Health Risk Manag. 2010; 6: 1125–33. [PubMed Abstract] [PubMed CentralFull Text].
- van Der Pol E, Van Gemert MJ, Sturk A, Nieuwland R, Van Leeuwen TG. Single vs. swarm detection of microparticles and exosomes by flow cytometry. J Thromb Haemost. 2012; 10: 919–30.
- Salih M, Zietse R, Hoorn EJ. Urinary extracellular vesicles and the kidney: biomarkers and beyond. Am J Physiol Renal Physiol. 2014; 306: F1251–9.
- Yang J, Wei F, Schafer C, Wong DT. Detection of tumor cell-specific mRNA and protein in exosome-like microvesicles from blood and saliva. PLoS One. 2014; 9: e110641.
- van Der Pol E, Coumans F, Varga Z, Krumrey M, Nieuwland R. Innovation in detection of microparticles and exosomes. J Thromb Haemost. 2013; 11(Suppl 1): 36–45.
- Coumans FA, Van der Pol E, Boing AN, Hajji N, Sturk G, van Leeuwen TG, etal. Reproducible extracellular vesicle size and concentration determination with tunable resistive pulse sensing. J Extracell Vesicles. 2014; 3: 25922. [PubMed Abstract].
- Varga Z, Yuana Y, Grootemaat AE, Van Der Pol E, Gollwitzer C, Krumrey M, etal. Towards traceable size determination of extracellular vesicles. J Extracell Vesicles. 2014; 3 23298, doi: http://dx.doi.org/10.3402/jev.v3.23298.
- van der Pol E, Coumans FA, Grootemaat AE, Gardiner C, Sargent IL, Harrison P, etal. Particle size distribution of exosomes and microvesicles determined by transmission electron microscopy, flow cytometry, nanoparticle tracking analysis, and resistive pulse sensing. J Thromb Haemost. 2014; 12: 1182–92.
- Boing AN, Van der Pol E, Grootemaat AE, Coumans FA, Sturk A, Nieuwland R. Single-step isolation of extracellular vesicles by size-exclusion chromatography. J Extracell Vesicles. 2014; 3 23430, doi: http://dx.doi.org/10.3402/jev.v3.23430 [PubMed CentralFull Text].
- van Beers EJ, Schaap MC, Berckmans RJ, Nieuwland R, Sturk A, Van Doormaal FF, etal. Circulating erythrocyte-derived microparticles are associated with coagulation activation in sickle cell disease. Haematologica. 2009; 94: 1513–19.
- Klein T, Buhr E, Frase CG, Hawkes PW. TSEM: a review of scanning electron microscopy in transmission mode and its applications. Advances in imaging and electron physics. 2012; Paris: Elsevier. 297–356.
- Brisson AR, Tan S, Gounou C, Arrauda N. Aggregation of extracellular vesicles induced by high-speed sedimentation and re-suspension: a combined cryo-electron microscopy and flow cytometry study. J Extracell Vesicles. 2015; 4: 27783. doi: http://dx.doi.org/10.3402/jev.v4.27783.
- Nordin JZ, Lee Y, Vader P, Mager I, Johansson HJ, Heusermann W, etal. Ultrafiltration with size-exclusion liquid chromatography for high yield isolation of extracellular vesicles preserving intact biophysical and functional properties. Nanomedicine. 2015; 11: 879–83.
- Ashcroft BA, de SJ, Yuana Y, Osanto S, Bertina R, Kuil ME, etal. Determination of the size distribution of blood microparticles directly in plasma using atomic force microscopy and microfluidics. Biomed Microdevices. 2012; 14: 641–9.
- Lee K, Shao H, Weissleder R, Lee H. Acoustic purification of extracellular microvesicles. ACS Nano. 2015; 9: 2321–7.
- Petersen KE, Manangon E, Hood JL, Wickline SA, Fernandez DP, Johnson WP, etal. A review of exosome separation techniques and characterization of B16-F10 mouse melanoma exosomes with AF4-UV-MALS-DLS-TEM. Anal Bioanal Chem. 2014; 406: 7855–66.
- Agarwal K, Saji M, Lazaroff SM, Palmer AF, Ringel MD, Paulaitis ME. Analysis of exosome release as a cellular response to MAPK pathway inhibition. Langmuir. 2015; 31: 5440–8.
- Lötvall J, Hill AF, Hochberg F, Buzás EI, Di Vizio D, Gardiner C, etal. Minimal experimental requirements for definition of extracellular vesicles and their functions: a position statement from the International Society for Extracellular Vesicles. J Extracell Vesicles. 2014; 3: 26913. doi: http://dx.doi.org/10.3402/jev.v3.26913.

