
Abstract
Plasma and other body fluids contain cell-derived extracellular vesicles (EVs), which participate in physiopathological processes and have potential biomedical applications. In order to isolate, concentrate and purify EVs, high-speed centrifugation is often used. We show here, using electron microscopy, receptor-specific gold labelling and flow cytometry, that high-speed centrifugation induces the formation of EV aggregates composed of a mixture of EVs of various phenotypes and morphologies. The presence of aggregates made of EVs of different phenotypes may lead to erroneous interpretation concerning the existence of EVs harbouring surface antigens from different cell origins.
To access the supplementary material to this article, please see Supplementary files under ‘Article Tools’.
Blood and other body fluids contain membrane vesicles that are released by cells upon activation or apoptosis (Citation1–Citation3). According to current hypotheses, cell-derived vesicles either form by blebbing and shedding of plasma membrane pieces or they are secreted by cells after fusion of multivesicular endosomes with the plasma membrane. Here, the term extracellular vesicle (EV) will refer to all types of vesicles present in blood plasma (Citation4, Citation5). EVs are objects of low abundance suspended in biological fluids that are highly enriched in proteins and other components; thus purification and concentration are often required for EV analysis. Centrifugation is the most popular method of EV isolation, as indicated by its use in a large number of studies (Citation6–Citation20). Centrifugation enables not only separation of EVs from proteins and most other soluble components, but also concentration of EVs or elimination of unbound probes in labelling studies. However, several studies have reported that centrifugation may cause aggregation or morphological changes of EVs (Citation11, Citation21) (Citation22), which could cause artefacts and lead to erroneous conclusions about EV composition or phenotype.
In order to further address this question, we decided to use cryo-electron microscopy (EM) combined with immuno-gold labelling. Using this approach, we were recently able to reveal in detail the diversity of EVs in pure plasma, showing in particular that EVs from the plasma of healthy subjects are isolated, with a total absence of aggregates (Citation23). In addition, we used flow cytometry (FCM), which is the main method of EV characterization (Citation24–Citation26), to compare plasma samples before and after high-speed centrifugation.
Materials and methods
Reagents
Anti-CD235a (glycophorin-A) and CD41 (αIIb chain of αIIbβ3 integrin) monoclonal antibodies (mAb) either unlabelled or conjugated to PE were from Beckman Coulter (Villepinte, France). Phe-Pro-Arg chloromethyl ketone (PPACK) was from Haematologic Technologies (Cryopep, Montpellier, France). SPHERO Ultra Rainbow beads (1 µm) were from Spherotech (Interchim, Montluçon, France). F-XC100 (1 µm) and F-XC040 (400 nm) were from ESTAPOR (Merck Chimie SAS, Fontenay-sous-Bois, France).
Preparation of plasma samples
Blood was collected after written informed consent from 4 healthy donors who had fasted for at least 12 h. Blood was drawn in 4.5 mL BD Vacutainer® tubes containing 0.5 mL of 129 mM sodium citrate (BD, Le Pont de Claix, France). The preparation of platelet-free plasma (PFP) was started within less than 1 h after blood collection and consisted of 2 consecutive cycles of centrifugation at 2,500 g for 15 min (Citation27).
High-speed centrifugation of PFP samples
Fresh PFP (1.5 mL) was mixed with 3 mL HEPES-buffered saline (HBS) containing 10 mM HEPES pH 7.4, 150 mM NaCl and 2 mM NaN3 as a preservative. The mixture was centrifuged at 100,000 g for 1 h at 20°C with a low brake in a Beckman Coulter Optima Max-E ultracentrifuge using a MLS 50 rotor and polyallomer tubes. After centrifugation, 3.8 mL of supernatant were discarded and the pellet, which is not visible, was homogenized at least 10 times by gentle pipetting with a 200-µL pipette. The volume of the pelleted suspension was then adjusted to 1.5 mL with HBS containing 0.1% BSA and 10 µM PPACK as anticoagulant (Citation28) (HBS-BSA). This resuspended pellet is referred to hereafter as 100k-PFP.
Sample preparation and observation for cryo-EM experiments
Annexin-A5 conjugated to 4-nm gold nanoparticles (Anx5-gold-NPs) and anti-CD235a or anti-CD41 mAbs conjugated to 10-nm gold-NPs (anti-CD41-, anti-CD235a-gold-NPs) were produced as previously described (Citation23).
Samples were labelled as follows. Either PFP or 100k-PFP (6 µL) was mixed with 1 µL anti-CD235a- or anti-CD41-gold-NPs at 1–3×10¹⁶ NP/L and incubated for 30 min at ambient temperature. Next, 1 µL 100 µM PPACK, 1 µL Anx5-gold-NPs at 1–3×10¹⁶ NP/L and 1 µL 100 mM CaCl2 were added, then samples were further incubated for 15 min and processed for cryo-EM.
A 4-µL sample aliquot was deposited onto an EM grid coated with a perforated carbon film (Ted Pella, Eloïse SAS, Roissy-en-France, France), the excess liquid was blotted off with a filter paper and the grid was then quickly plunged into liquid ethane using a Leica EM-CPC cryo-chamber (Leica Microsystèmes SAS, Nanterre, France). EM grids were stored in cryo-boxes under liquid nitrogen until use, then mounted in a Gatan 626 cryo-holder (Gatan, Warrandale, PA, USA) and transferred to a Tecnai F20 microscope operated at 200 kV (FEI Company, Eindhoven, Netherlands). Images were recorded with an USC1000-SSCCD Gatan camera.
Preparation and observation of samples sedimented onto EM grids
PFP and 100k-PFP were labelled using 10-nm Anx5-gold-NPs as follows: 100 µL PFP or 100k-PFP were mixed with 1 µL 1 mM PPACK, 1 µL Anx5-gold-NPs at 1–3×10¹⁶ NP/L, supplemented with 10 mM CaCl2 for PFP or 2 mM CaCl2 for 100k-PFP and incubated for 30 min at ambient temperature.
Samples were then diluted 30 times with a buffer containing 100 mM sodium cacodylate (2 mM CaCl2, pH 7.4) and deposited into polyallomer centrifuge tubes containing 4 EM grids coated with a continuous carbon film (Electron Microscopy Sciences, LFG-Distribution, Lyon, France), fixed on a resin support (Citation23). Samples were centrifuged at 100,000×g for 1 h at 20°C as described above, after which the liquid above the EM grids was carefully removed, and the EM grids were recovered and air-dried.
Grids were observed with an FEI CM120 microscope operated at 120 kV. Images were recorded with a USC1000-SSCCD Gatan camera.
This method, referred to as the on-grid sedimentation method, was previously described (see Supplementary Fig. 1 in (Citation23)).
Flow cytometry
Samples were labelled as follows: 50 µL PFP or 100k-PFP were mixed with either 10 µL pure anti-CD41-mAb-PE or 20 µL anti-CD235a-mAb-PE diluted 10× with HBS-BSA; then samples were incubated for 2 h in the dark prior to dilution to 500 µL with HBS-BSA. Next, 20 ng/mL Anx5-Cy5 and 10 mM CaCl2 were added and samples were incubated for an additional 1 h prior to analysis. Before FCM analysis, 1 µm Ultra Rainbow beads were added to each tube at 5×10⁴/mL to measure the acquired volume.
FCM was performed with a Gallios flow cytometer (Beckman Coulter) and data were analysed using Kaluza 1.2. The detection of EVs was triggered on the forward scatter (FS) parameter, and only EVs labelled with either Anx5-Cy5 (FL6) or mAb-PE (FL2) were taken into consideration. FS detection sensitivity was tested daily using a mixture of 1 µm and 400 nm FL1 fluorescent beads, ensuring an FS detection efficiency of 98±2% of the 400 nm beads. Each tube was measured twice and EV concentrations, expressed as mean±SD, were calculated by taking into account the number of 1 µm Ultra Rainbow beads acquired and the sample dilution.
Results
1) EM analysis of PFP samples after high-speed centrifugation
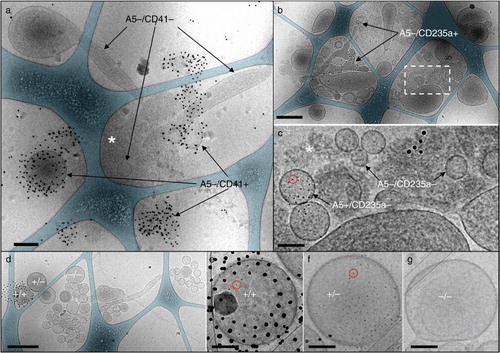
Cryo-EM analysis shows that pure, unprocessed PFP samples consist of isolated EVs (). On the other hand 100k-PFP samples show EV aggregates (), together with isolated EVs. shows 3 representative examples of EV aggregates, in order to appreciate the variety of structures induced by high-speed sedimentation. a presents an EV aggregate from a 100k-PFP sample labelled by both 4-nm Anx5-gold-NPs and 10-nm anti-CD41-gold-NPs. In this aggregate, several EVs are labelled with anti-CD41-gold-NPs, thus are of platelet origin and are associated with unlabelled EVs. As previously described (Citation23), EVs present various morphologies, principally spherical and tubular. In addition, some non-vesicular, amorphous material is present near the centre of the aggregate (white asterisk). Such material is frequently associated with EV aggregates and is likely to correspond to protein aggregate of unknown nature forming a glue linking EVs together. b and c presents an EV aggregate from a 100k-PFP sample labelled by both 4-nm Anx5-gold-NPs and 10-nm anti-CD235a-gold-NPs. The aggregate gathers more than 20 EVs of various morphologies, together with some amorphous material (white asterisk in C). Two EVs are specifically labelled with 10-nm anti-CD235a-gold-NPs; they are thus of erythrocyte origin, although they are entirely devoid of 4-nm Anx5-gold-NPs. In this EV aggregate, only 1 EV is labelled with Anx5-gold-NPs. In d and e, the EV aggregate presents, on the left, a single EV double labelled with anti-CD41-gold-NPs and Anx5-gold-NPs. In addition to this platelet-derived EV, the aggregate contains several spherical EVs labelled with Anx5-gold-NPs but not with anti-CD41-gold-NPs, as well as a large number of unlabelled EVs.
Fig. 1. Cryo-electron microscopy image of a pure, unprocessed PFP sample. A single EV is observed (arrow), self-supported in a nanodroplet of frozen PFP (black asterisk), suspended on a perforated carbon net (white asterisk). Scale bar: 1 µm.
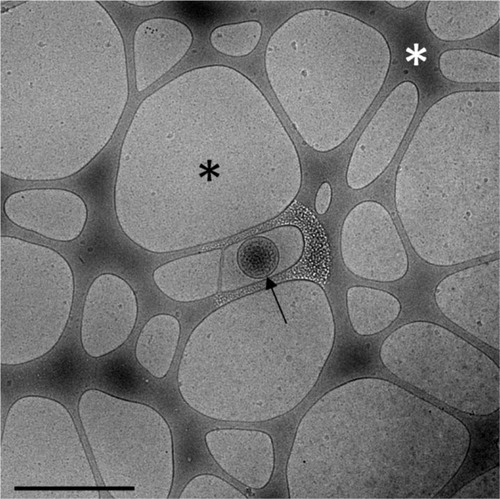
Fig. 2. Representative cryo-electron microscopy images of EV aggregates in 100k-PFP samples. (a, d–g), double labelling with 10 nm anti-CD41-gold-NPs and 4 nm Anx5-gold-NPs; (b, c), double labelling with 10 nm anti-CD235a-gold-NPs and 4 nm Anx5-gold-NPs. In (a), several A5−/CD41+ EVs and A5−/CD41− EVs are indicated, associated with some amorphous material (white asterisk). (b), Aggregate associating several 10s of EVs, including several A5−/CD235a+ EVs. (c), High magnification view of the dashed box from (b), allowing one to distinguish between A5+/CD235a− EVs and A5−/CD235a− EVs. One Anx5-gold-NP is circled in red. The white asterisk points to amorphous material. (e–g), High magnification views of the EVs from (d) labelled +/+ (for A5+/CD41+), +/− (for A5+/CD41−) and −/− (for A5−/CD41−), respectively. One Anx5-gold-NP is circled in red in (e) and (f). For the sake of clarity, the carbon net has been overlaid in turquoise in (a, b, d). Scale bars: a, b, d: 500 nm; c, e–g: 100 nm.
These examples illustrate the fact that EV aggregates are highly heterogeneous, containing a variable number of EVs of various phenotypes and morphologies. By cryo-EM, EV aggregates have an overall size ranging from about 500 nm to several micrometres, whereas isolated EVs range mostly from 50 to 500 nm in diameter, as previously described (Citation23).
It must be stressed that we did not observe EV aggregates in non-centrifuged PFPs from healthy donors, over more than 100 PFP samples analysed by cryo-EM. This is easily explained by the low concentration of EVs present in normal PFP. Indeed, for a concentration of about 100,000 EVs/µL (Citation29), each EV occupies a cube of about 50 µm edge length. Therefore, the probability of EV collision within a PFP suspension or during the draining process on an EM grid is extremely low. The formation of EV aggregates must therefore result from the fact that, upon high-speed centrifugation, all the EVs contained in a centrifuge tube are concentrated in a small volume, promoting their interaction.
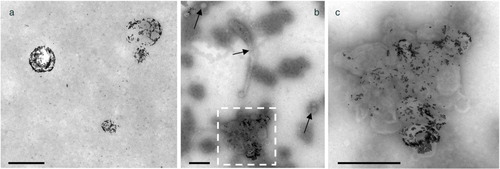
What are the relative amounts of EV aggregates and isolated EVs in 100k-PFPs? This question cannot be addressed by cryo-EM, because an artefact referred to as fish-net artefact occurs during the preparation of cryo-EM specimens (Citation23). Indeed, while draining a small droplet of PFP through the perforated carbon net covering cryo-EM grids, the largest objects have a high probability of being retained by the net while isolated EVs, which are smaller, pass freely through the net, as previously reported (see Supplementary Fig. 5 in (Citation23)). Due to this artefact, the proportion of large objects, thus the EV aggregates here, is overestimated. Therefore, in order to determine the relative amounts of isolated EVs and EV aggregates in 100k-PFP samples we used another EM approach, called on-grid sedimentation, which has already been applied successfully to the enumeration of EVs in unprocessed PFP samples (Citation29, Citation30). shows representative images of a PFP (A) and a 100k-PFP (B,C) sedimented onto an EM grid after labelling with Anx5-gold-NPs. With the PFP sample isolated EVs are observed, homogeneously distributed, with no EV aggregates (a). In contrast, the 100k-PFP shows isolated EVs (arrows) together with an EV aggregate (b and c). Two independent experiments were performed, in which we measured the numbers of isolated EVs and EV aggregates before and after high-speed sedimentation. We found that, after high-speed sedimentation, the concentration of isolated EVs decreased from 29,500±500 to 11,500±500 (expressed per microlitre pure PFP), whereas 3,000±1,000 EV aggregates were found in 100k-PFP. These values must be taken as only indicative, because several parameters, principally the conditions used for resuspending the pellets, are likely to affect the aggregate size and concentration.
Fig. 3. Representative images of EVs from (a) PFP and (b, c) 100k-PFP sedimented onto electron microscopy grids after Anx5-gold labelling. (a) Isolated Anx5-positive EVs are observed, with no EV aggregates. (b) An EV aggregate, about 800 nm in overall size, is observed, together with isolated EVs (arrows). (c) High magnification view of the dashed box from b; the EV aggregate contains Anx5-positive and Anx5-negative EVs. Scale bars: 500 nm.
Similar results of EV aggregation were obtained when PFP centrifugation was performed at 20,000×g (data not shown). In addition, similar results of EV aggregation were observed when pellets were resuspended in PFP depleted of EVs instead of HBS-BSA (data not shown).
2) FCM analysis of 100k-PFP samples
As FCM is the most common method used for characterizing EVs, we investigated the impact of EV aggregation on FCM data. In this study, we used light scattering for triggering detection, because the focus is on the formation of EV aggregates and light scattering is best adapted for detecting large objects (Citation31, Citation32). shows the FCM analysis of a PFP and its counterpart 100k-PFP, after double labelling with Anx5-Cy5/anti-CD41-PE or Anx5-Cy5/anti-CD235a-PE. Concentrations expressed as EVs/µL sample are summarized in Table . High-speed centrifugation was found to induce an increase in the total amount of EVs, in the number of Anx5-positive EVs and in the number of double labelled EVs. The increase of the amount of double labelled EVs, both Anx5+/CD41+ and Anx5+/CD235a+, strongly suggests the formation of EV aggregates. However, it is not possible to distinguish genuine double-positive isolated EVs from EV aggregates within these EV populations.
Fig. 4. Flow cytometry analysis of a PFP (left column) and the corresponding 100k-PFP (right column) after double labelling with Anx5−Cy5/CD41−PE (a, b) or Anx5−Cy5/CD235a−PE (c, d). EV concentrations (expressed as EV/µL sample) are indicated for each EV population. Colour code for the dot plots: Anx5+/CD41− or Anx5+/CD235a−, blue; Anx5−/CD41+, green; Anx5+/CD41+, orange; Anx5−/CD235a+, red; Anx5+/CD235a+, purple; background noise, grey.
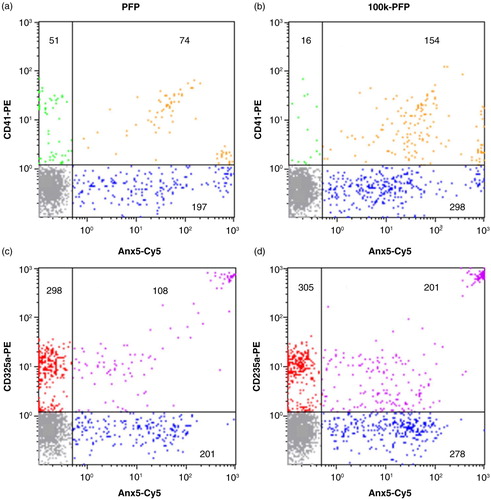
Table I. Extracellular vesicle (EV) concentrations measured by flow cytometry in platelet-free plasma (PFP) and 100k-PFP after double labelling with Anx5/CD41 or Anx5/CD235a
As indicated in the Materials and methods section, the 100k-PFP was obtained after repeated gentle homogenization with a 200-µL pipette. As the pellet itself is too small to be visible, we questioned the efficiency and reproducibility of this procedure. When the same treatment of centrifugation and resuspension was applied in triplicate to a PFP sample, the results from FCM were found to be reproducible, with CVs<10%.
Discussion
Altogether, the results presented here lead to the conclusion that high-speed centrifugation induces the formation of EV aggregates composed of a mixture of EVs of various phenotypes. EV aggregates are highly heterogeneous in size and in the number of EVs associated.
Most importantly, the formation of EV aggregates of various phenotypes may lead to erroneous interpretation concerning the existence of EVs harbouring surface antigens from different cell origins. By FCM and also by immunofluorescence, EVs are considered to present a double or multiple positive phenotypes simply based on the presence of 2 or more markers on a given object. Yet FCM, like most optical methods, does not allow distinguishing between a single large EV and an aggregate of several small EVs. One may therefore question the validity of conclusions from previous studies, mainly by FCM, concerning the unexpected co-localization of CD markers from different cell origin on EVs. Such conclusions include, for example, TF-positive EVs harbouring platelet (CD61) and granulocyte (CD66e) markers in patients with type 2 diabetes (Citation33), the presence of Anx5-positive EVs co-stained with platelet (CD41) and endothelial (CD62e) markers in essential thrombocytopenia (Citation34) or the presence by immuno-fluorescence microscopy of objects co-stained by platelet antigen CD61 and MUC1, a protein originating from breast cancer epithelial cells (Citation35, Citation36).
Based on the results presented here, we recommend the use of double labelling EM as a definitive proof of fusion between EVs of different cell origin or transfer of membrane-bound antigens between EVs. Imaging FCM may constitute an alternative to EM for revealing the presence of false double positive EVs, as clearly demonstrated by Erdbrügger et al. (Citation22).
Although many studies use high-speed centrifugation to purify, concentrate or wash EVs, it is surprising that the presence of EV aggregates is rarely discussed (Citation21, Citation22). A simple explanation could be that the presence of aggregates is not detected by some methods used for characterizing resuspended pellets, for example nanoparticle tracking analysis (NTA) (Citation37, Citation38) or tunable resistive pulse sensing (tRPS) (Citation19, Citation38). In the case of NTA, it is possible that the settings optimal for detecting 100-nm-large exosomes are not compatible for tracking micrometre-large aggregates or/and that the scattering intensity of EV aggregates is so intense that they are considered as noise and eliminated from the analysis. For tRPS, the pore size used for detecting small EVs may not detect large EV aggregates, which in addition may lead to clogging effects.
The formation of EV aggregates after high-speed centrifugation is not limited to plasma samples and was also observed with samples from synovial liquid, breast milk, perfused placenta and cell culture supernatants (data not shown).
The key message of this study is that the interpretation of data obtained after high-speed centrifugation must be taken with caution, as centrifugation will affect either the concentration of EVs, their size or biochemical composition through the formation of EV aggregates. Alternative EV preparation and purification methods have recently been proposed, involving membrane filtration (Citation39), size exclusion chromatography (Citation40) or magnetic separation (Citation41). It will be important to develop optimized procedures for EV analysis and investigate whether these methods are free of artefactual effects.
Conflicts of interests and funding
The authors declare no conflict of interest. This study was supported by ANR (grant 11-BSV1-03501-PlacentA5 to ARB), Canceropole-GSO (grant 2013-E07 to ARB) and IUF (grant to ARB).
Acknowledgements
We thank Mrs. Chaléat (Laboratoire Mutualiste d'Analyses Médicales, Pessac, France) for her help with the collection of blood samples. We thank Dr. Chris Gardiner (University College London, UK) for helpful discussions.
Notes
To access the supplementary material to this article, please see Supplementary files under ‘Article Tools’.
Related Research Data
References
- Raposo G, Stoorvogel W. Extracellular vesicles: exosomes, microvesicles, and friends. J Cell Biol. 2013; 200: 373–83.
- Yuana Y, Sturk A, Nieuwland R. Extracellular vesicles in physiological and pathological conditions. Blood Rev. 2013; 27: 31–9.
- Kowal J, Tkach M. Théry C. Biogenesis and secretion of exosomes. Curr Opin Cell Biol. 2014; 29: 116–25.
- Gould SJ, Raposo G. As we wait: coping with an imperfect nomenclature for extracellular vesicles. J Extracell Vesicles. 2013; 2: 20309. doi: http://dx.doi.org/10.3402/jev.v2i0.20389.
- Witwer KW, Buzás EI, Bemis LT, Bora A, Lässer C, Lötvall J, etal. Standardization of sample collection, isolation and analysis methods in extracellular vesicle research. J Extracell Vesicles. 2013; 2: 20360. doi: http://dx.doi.org/10.3402/jev.v2i0.20360.
- Raposo G, Nijman HW, Stoorvogel W, Liejendekker R, Harding CV, Melief CJ, etal. B lymphocytes secrete antigen-presenting vesicles. J Exp Med. 1996; 1161–72.
- Pasquet JM, Toti F, Nurden AT, Dachary-Prigent J. Procoagulant activity and active calpain in platelet-derived microparticles. Thromb Res. 1996; 87: 509–22.
- Nieuwland R, Berckmans RJ, Rotteveel-Eijkman RC, Maquelin KN, Roozendaal KJ, Jansen PGM, etal. Cell-derived microparticles generated in patients during cardiopulmonary bypass are highly procoagulant. Circulation. 1997; 96: 35, 34–41.
- Shet AS, Aras O, Gupta K, Hass MJ, Rausch DJ, Saba N, etal. Sickle blood contains tissue factor–positive microparticles derived from endothelial cells and monocytes. Blood. 2003; 102: 2678–83.
- Shet AS, Key NS, Hebbel RP. Measuring circulating cell-derived microparticles. J Thromb Haemost. 2004; 2: 1848–50.
- Théry C, Amigorena S, Raposo G, Clayton A. Isolation and characterization of exosomes from cell culture supernatants and biological fluids. Curr Protoc Cell Biol. 2006; Chapter 3: 1–29.
- Valadi H, Ekström K, Bossios A, Sjöstrand M, Lee JJ, Lötvall JO. Exosome-mediated transfer of mRNAs and microRNAs is a novel mechanism of genetic exchange between cells. Nat Cell Biol. 2007; 9: 654–9.
- Leroyer AS, Isobe H, Leseche G, Castier Y, Wassef M, Mallat Z, etal. Cellular origins and thrombogenic activity of microparticles isolated from human atherosclerotic plaques. J Am Coll Cardiol. 2007; 49: 772–7.
- Dasgupta SK, Abdel-Monem H, Niravath P, Le A, Bellera RV, Langlois K, etal. Lactadherin and clearance of platelet-derived microvesicles. Blood. 2009; 113: 1332–9.
- György B, Módos K, Pállinger É, Pálóczi K, Pásztói M, Misják P, etal. Detection and isolation of cell-derived microparticles are compromised by protein complexes resulting from shared biophysical parameters. Blood. 2011; 117: 39–48.
- Peinado H, Alečković M, Lavotshkin S, Matei I, Costa-Silva B, Moreno-Bueno G, etal. Melanoma exosomes educate bone marrow progenitor cells toward a pro-metastatic phenotype through MET. Nat Med. 2012; 18: 883–91.
- Tushuizen ME, Diamant M, Peypers EG, Hoek FJ, Heine RJ, Sturk A, etal. Postprandial changes in the phospholipid composition of circulating microparticles are not associated with coagulation activation. Thromb Res. 2012; 130: 115–21.
- Yuana Y, Koning RI, Kuil ME, Rensen PCN, Koster AJ, Bertina RM, etal. Cryo-electron microscopy of extracellular vesicles in fresh plasma. J Extracell Vesicles. 2013 2 21494. doi: http://dx.doi.org/10.3402/jev.v2i0.21494.
- Varga Z, Yuana Y, Grootemaat AE, van der Pol E, Gollwitzer C, Krumrey M, etal. Towards traceable size determination of extracellular vesicles. J Extracell Vesicles. 2014; 3: 23298. doi: http://dx.doi.org/10.3402/jev.v3.23298.
- Melo SA, Luecke LB, Kahlert C, Fernandez AF, Gammon ST, Kaye J, etal. Glypican-1 identifies cancer exosomes and detects early pancreatic cancer. Nature. 2015; 523: 177–82.
- Issman L, Brenner B, Talmon Y, Aharon A. Cryogenic transmission electron microscopy nanostructural study of shed microparticles. PLoS One. 2013; 8: e83680.
- Erdbrügger U, Rudy CK, E Etter M, Dryden KA, Yeager M, Klibanov AL, etal. Imaging flow cytometry elucidates limitations of microparticle analysis by conventional flow cytometry. Cytometry A. 2014; 85: 756–70.
- Arraud N, Linares R, Tan S, Gounou C, Pasquet J-M, Mornet S, etal. Extracellular vesicles from blood plasma: determination of their morphology, size, phenotype and concentration. J Thromb Haemost. 2014; 12: 614–27.
- György B, Szabó TG, Pásztói M, Pál Z, Misják P, Aradi B, etal. Membrane vesicles, current state-of-the-art: emerging role of extracellular vesicles. Cell Mol Life Sci. 2011; 68: 2667–88.
- Van der Pol E, Böing AN, Harrison P, Sturk A, Nieuwland R. Classification, functions, and clinical relevance of extracellular vesicles. Pharmacol Rev. 2012; 64: 676–705.
- Jy W, Horstman LL, Jimenez JJ, Ahn YS, Biró E, Nieuwland R, etal. Measuring circulating cell-derived microparticles. J Thromb Haemost. 2004; 2: 1842–51.
- Lacroix R, Judicone C, Poncelet P, Robert S, Arnaud L, Sampol J, etal. Impact of pre-analytical parameters on the measurement of circulating microparticles: towards standardization of protocol. J Thromb Haemost. 2012; 10: 437–46.
- Lyon ME, Fine JS, Henderson PJ, Lyon AW. D-phenylalanyl-L-prolyl-L-arginine chloromethyl ketone (PPACK): alternative anticoagulant to heparin salts for blood gas and electrolyte specimens. Clin Chem. 1995; 41: 1038–41.
- Arraud N, Gounou C, Turpin D, Brisson AR. Fluorescence triggering: a general strategy for enumerating and phenotyping extracellular vesicles by flow cytometry. Cytometry A. 2015. doi: http://dx.doi.org/10.1002/cyto.a.22669. [Epub ahead of print]..
- Arraud N, Gounou C, Linares R, Brisson AR. A simple flow cytometry method improves the detection of phosphatidylserine-exposing extracellular vesicles. J Thromb Haemost. 2015; 13: 237–47.
- Van der Pol E, Hoekstra AG, Sturk A, Otto C, van Leeuwen TG, Nieuwland R. Optical and non-optical methods for detection and characterization of microparticles and exosomes. J Thromb Haemost. 2010; 8: 2596–607.
- Chandler WL, Yeung W, Tait JF. A new microparticle size calibration standard for use in measuring smaller microparticles using a new flow cytometer. J Thromb Haemost. 2011; 9: 1216–24.
- Diamant M, Nieuwland R, Pablo RF, Sturk A, Smit JWA, Radder JK. Elevated numbers of tissue-factor exposing microparticles correlate with components of the metabolic syndrome in uncomplicated type 2 diabetes mellitus. Circulation. 2002; 106: 2442–7.
- Trappenburg MC, van Schilfgaarde M, Marchetti M, Spronk HM, ten Cate H, Leyte A, etal. Elevated procoagulant microparticles expressing endothelial and platelet markers in essential thrombocythemia. Haematologica. 2009; 94: 911–18.
- Tesselaar MET, Romijn FPHTM, Van Der Linden IK, Prins FA, Bertina RM, Osanto S. Microparticle-associated tissue factor activity: a link between cancer and thrombosis?. J Thromb Haemost. 2007; 5: 520–7.
- Nieuwland R. Cellular origin of microparticles exposing tissue factor in cancer: a mixed double?. J Thromb Haemost. 2008; 6: 1514–16.
- Van Deun J, Mestdagh P, Sormunen R, Cocquyt V, Vermaelen K, Vandesompele J, etal. The impact of disparate isolation methods for extracellular vesicles on downstream RNA profiling. J Extracell Vesicles. 2014; 3: 24858. doi: http://dx.doi.org/10.3402/jev.v3.24858.
- Maas SLN, de Vrij J, van der Vlist EJ, Geragousian B, van Bloois L, Mastrobattista E, etal. Possibilities and limitations of current technologies for quantification of biological extracellular vesicles and synthetic mimics. J Control Release. 2015; 200: 87–96.
- Momen-Heravi F, Balaj L, Alian S, Mantel P-Y, Halleck AE, Trachtenberg AJ, etal. Current methods for the isolation of extracellular vesicles. Biol Chem. 2013; 394: 1253–62.
- Böing AN, van der Pol E, Grootemaat AE, Coumans FAW, Sturk A, Nieuwland R. Single-step isolation of extracellular vesicles by size-exclusion chromatography. J Extracell Vesicles. 2014; 3: 23430. doi: http://dx.doi.org/10.3402/jev.v3.23430.
- Arakelyan A, Ivanova O, Vasilieva E, Grivel J-C, Margolis L. Antigenic composition of single nano-sized extracellular blood vesicles. Nanomedicine. 2015; 11: 489–98.