
Abstract
Background and objective
pH in dental biofilms is of central importance for the development of caries. We used the ratiometric pH-sensitive dye C-SNARF-4 in combination with digital image analysis to monitor extracellular pH in dental biofilms grown in situ with and without sucrose supply.
Design
Dental biofilms (48 h) from 10 individuals were collected on glass slabs mounted on intra-oral appliances. During growth, appliances were immersed extra-orally in either physiological saline or 4% sucrose for 2 min, eight times per day. Fluorescence emissions of C-SNARF-4 in deep layers of the biofilms were recorded ex vivo with confocal microscopy for 15 min or for 1 h after exposure to 0.4% glucose. Extracellular pH was determined ratiometrically using digital image analysis.
Results
Extracellular pH dropped rapidly in most examined sites after addition of glucose. Distinct pH microenvironments were observed within single biofilms. The variation in pH was similar between sites within the same biofilm and sites from different individuals. pH drop patterns did not differ between biofilms exposed to sucrose-free and sucrose-rich environments.
Conclusion
The present study is the first of its kind to apply the combination of pH ratiometry and digital image analysis to systematically record extracellular pH in intact dental biofilms from several individuals for up to 1 h. We observed highly heterogeneous pH landscapes and the presence of acidogenic microenvironments – ‘acidogenic hotspots’ – within the biofilms. The data suggest that pH drops in young (48 h) dental biofilms are independent of the sucrose supply during growth.
To access the supplementary material for this article, please see Supplementary files under ‘Article Tools’
Dental caries results from innumerable metabolic episodes of acid and base formation by bacteria in dental biofilm. If, over time, there is a drift in the acidogenic response of the biofilm toward lower pH values, induced by dietary carbohydrates, a caries lesion is likely to develop (Citation1). A sucrose-rich diet has been shown to increase the amount of biofilm formed (Citation2) and its acidogenicity (Citation3). Moreover, the bacterial composition is changed toward a more aciduric community (Citation4, Citation5). Studying pH in dental biofilm provides information about its acidogenic potential and therefore contributes to our understanding of the process of caries formation.
Already in the 1940s, Stephan (Citation6) highlighted the relationship between the pH-response in bacterial deposits following a carbohydrate exposure and the caries activity in individuals. Stephan used a rather crude method for his analyses by pooling plaque samples and measuring bulk pH with an electrode. Later, ion-specific telemetry with indwelling electrodes (placed in crowns or dentures of test persons) was used to measure pH in undisturbed biofilms in vivo (Citation7, Citation8). While pH telemetry gives reliable recordings of pH at the plaque-electrode interface, the method is expensive and time-consuming, and therefore limited to small study populations. More recently, the development of microelectrodes (Beetrode MEPH-1; tip diameter 0.1 mm) has made it possible to study vertical pH gradients in biofilms (Citation9, Citation10). A few studies have employed even thinner microelectrodes with tip diameters of 10–15 µm to analyze carbohydrate-induced pH profiles within in-situ-grown dental biofilms (Citation11, Citation12). Von Ohle et al. (Citation12) elegantly demonstrated steep pH gradients, with the lowest pH in the deepest part of biofilms collected from one person. However, the use of microelectrodes disturbs the original structure of the biofilm and does not give information about horizontal pH gradients in biofilms in real time.
Battin and co-workers (Citation13) advocate that biofilms should be viewed as microbial landscapes and emphasize the importance of investigating the ecology of biofilms spatially. It has been shown that the architecture of natural (in vivo) dental biofilms comprises distinct ecological niches (Citation14, Citation15). Therefore, pH mapping in all dimensions is of great importance for a better understanding of the processes leading to caries.
Quantitative confocal microscopic techniques, such as pH ratiometry, can overcome the limitations of microelectrodes. We have recently developed a method using the ratiometric dye C-SNARF-4 to reliably monitor extracellular pH in in-situ-grown dental biofilms microscopically (Citation16). A pH-dependent shift in the emission spectrum of the dye is exploited to record fluorescence intensities and correlate them to pH, irrespective of probe penetration and compartmentalization. In this study, the technique is used to systematically record extracellular pH in deep layers of young (in this paper defined as 48 h) in-situ-grown dental biofilms collected on glass slabs from 10 individuals. We hypothesize that not only does the pH in biofilms differ between individuals but also between different areas within single biofilms grown on one glass slab. In addition, we hypothesize that more pronounced extracellular pH drops occur in biofilms grown with repetitive exposure to sucrose compared with biofilms grown without exposure to sucrose.
Methods
Study participants
Ten healthy volunteers participated in the study (9 females and 1 male, age: 22–36). The study was approved by The Central Denmark Region Committees on Biomedical Research Ethics (M-20100032). Written informed consent was obtained from the participants following oral and written information about the study. The exclusion criteria and the design of the in situ model have previously been described in detail (Citation17).
In situ biofilm collection
All participants wore an individually designed acrylic splint in the lower jaw in which four custom-made non-fluorescent glass slabs with a surface roughness of 1,200 grit (Menzel, Braunschweig, Germany) had been inserted into the buccal flanges of each side for biofilm collection (Citation17). The glass slabs were sterilized by autoclaving before being inserted into recessions in the splint with sticky wax (Densply, Weybridge, UK). The volunteers wore the splint during two 48-h experimental periods, each beginning at 8 am. During the first experimental period, the volunteers removed the splint every 2 h during daytime (eight times a day) and immersed the right-side flange in physiological saline for 2 min (sucrose-free group) and the left-side flange in a 4% sucrose solution for 2 min (sucrose group), the latter to imitate a situation where the individual consumes a diet rich in fermentable carbohydrates. Based on studies by Imfeld (Citation8), a concentration of 4% sucrose was chosen to achieve pH drops within the optimal pH range of the pH-sensitive probe (pH=4.5–7) (Citation16). The first immersion was performed 30 min after the splint was inserted. Fresh solutions were provided for each day of the experiment. During the second experimental period, the volunteers repeated the procedure described above but immersed the left-side flange in physiological saline (sucrose-free group) and the right-side flange in the sucrose solution (sucrose group). At the end of each experiment, the glass slabs were removed from the splints and stored at room temperature in humid containers until microscopic analysis (<6 h). For methodological reasons, only one sample could be analyzed at a time. For each participant (n=10) and for both experimental periods, eight 48-h biofilm specimens were analyzed (four from each side of the splint), yielding a total of 160 biofilms. The order of analysis of the specimens alternated between specimens from the saline immersion side and specimens from the sucrose immersion side.
Biofilm pH imaging with C-SNARF-4
An inverted Zeiss LSM 510 META (Carl Zeiss, Jena, Germany) confocal microscope was used for image acquisition. The 543 nm laser line was used and fluorescence emission was monitored simultaneously within 576–608 nm (green) and 629–661 nm (red) intervals (META detector). The images were acquired using a C-Apochromat 40x/1,2 water-immersion objective. An XL incubator (PeCon, Erbach, Germany) was used to keep the microscope at a temperature of 37°C. Calibration data of C-SNARF-4 for our microscopic set-up and the resulting calibration curve have been published previously (Citation16). pH analysis of the biofilms was performed in pooled salivary solution (Citation18) titrated to pH 7.0, and glucose was added to a concentration of 0.4% (wt/vol). Custom-made wells were filled with 100 µl of salivary solution mixed with 2 µl (50 µM) of C-SNARF-4 and placed under the confocal microscope. Then glass slabs were placed in the custom-made wells with the biofilm facing downward (t=0).
For each participant, experimental period and treatment group, pH was monitored for 1 h following the glucose challenge in two replicate biofilms and for 15 min following the glucose challenge in another two replicate biofilms. For 1-h monitoring, six fields of view (FOV) per biofilm were imaged at seven consecutive time points. The first image was captured after 5 min. For 15-min monitoring, three FOV per biofilm were imaged as often as possible (6–8 times), starting at t=2 min. Images were acquired 5–10 µm from the biofilm-glass interface for each microscopic FOV.
Pilot experiments were conducted to exclude the possibility of drift in the measuring system of the microscope. A plaque sample on a glass slab was incubated for 16 h in HEPES buffer (pH 5.5) and then placed in a custom-made well with 100 µl HEPES buffer (pH 5.5) and 2 µl of C-SNARF-4. Two FOV were imaged at seven time points during 1 h, as for the experimental biofilms. Subsequent image analysis and ratio calculation showed the extracellular pH to be constant over time (data not shown).
Digital image analysis
Postprocessing of all images to determine extracellular pH following the glucose challenge was done using the programs daime (digital image analysis in microbial ecology, v. 2) (Citation19) and ImageJ (www.imagej.nih.gov/ij/, v.1.47) (Citation20). The analysis has been described in detail previously (Citation16). Briefly, daime was used to distinguish between bacterial cells and extracellular matrix in the images and to remove the bacterial biomass from all images. Image J was used to subtract background fluorescence and to calculate the average ratios between green and red fluorescence in the extracellular matrix of the biofilm images. Average ratios for each examined FOV and time point were then converted to pH values according to the calibration equation (see equation (Citation1) in Schlafer et al. (Citation16)). A summary of the study design is provided in Supplementary Fig. 1.
Statistical analysis
The data comprised recordings of extracellular pH and time of recording of this pH as observed in 1) six FOVs in each of the four specimens at seven time points over a 1-h period or 2) observed in three FOVs in each of the four specimens at 6–8 time points over a 15-min period, from each of the two experimental periods. The 1-h pH/time data were considered to have a hierarchical structure with FOV (n=6) nested in specimens (n=4) nested in individuals (n=10) yielding a total n=240; the 15-min pH/time data had a hierarchical structure with FOV (n=3) nested in specimens (n=4) nested in individuals (n=10) yielding a total n=120. In the 1-h data, the pH versus time curve for each FOV was used to estimate, by interpolation, the pH during five fixed time intervals: 3–4 min, 6–7 min, 12–13 min, 29–30 min, and 59–60 min. These pH values correspond to the average pH value in each of these 1-min intervals in the FOV. In the 15-min data the pH versus time curve for each FOV was used to estimate, by interpolation, the pH value at three fixed time intervals: 3–4 min, 6–7 min, and 12–13 min.
The data were analyzed using mixed-effects linear regression procedure xtmixed of STATA 13 (StataCorp, College Station, TX, USA) to account for the three-level hierarchical structure of the data. This analysis amounts to a variance-components analysis and provides estimates of the average pH, as well as estimates of the between-individuals variance (var subject ), the between-specimen within-individual variance (var specimen∣individual ), and the between FOV within-specimen within-individual variance (var FOV∣specimen & individual ) of the pH values. Analyses were made for each time point and for each immersion solution (saline or sucrose). The significance of the variance components was tested using the likelihood-ratio test, and pH changes were tested using paired-tests between time intervals.
Results
and Supplementary Fig. 2 show representative examples of the extracellular pH curves from three individuals during the 15- and 60-min experiments in the absence and presence of sucrose, respectively. For both experimental groups, the observed pH drops differed considerably between different FOVs from one biofilm, between different specimens from the same individual, and between individuals ( and , and Supplementary Fig. 2). These differences were usually maintained until the end of the observation period (60 min).
Fig. 1. pH curves from three individuals with different patterns of pH drops (sucrose-free group). Each curve represents the average pH of a field of view. Different colors represent different specimens. (a)–(c) show data from the 15-min analysis and (d)–(f) from the 60-min experiment.
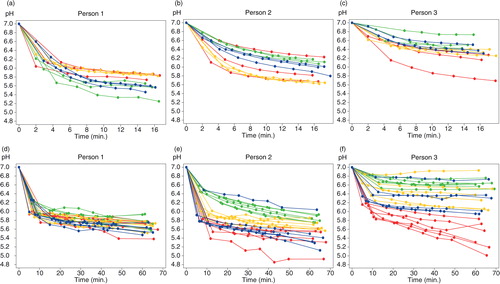
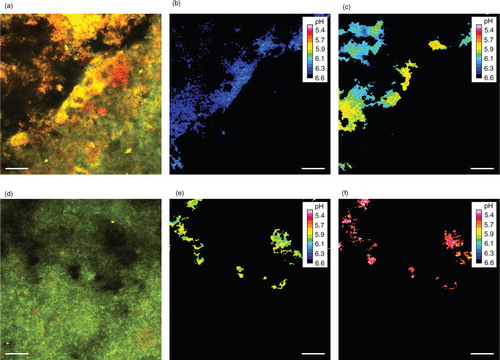
Fig. 2. Ratiometric monitoring of extracellular biofilm pH with C-SNARF-4. (a)–(c) and (d)–(f) show two different fields of view (FOV) in one biofilm from the sucrose-free group. (a) and (d) show overlays of the red and green fluorescent emissions of a C-SNARF-4-stained biofilm after exposure to 0.4% glucose. The dye concentration is the highest inside bacterial cells, which allows removal of the bacterial biomass from the images via digital image postprocessing. (b) and (c) show the FOV in (a) after removal of the bacteria and ratiometric pH calculation, 8 and 63 min after exposure to glucose, respectively. For visualization, false colors are assigned to each pH. The average pH dropped from 6.48 (in b) to 6.04 (in c). (e) and (f) show the FOV in (d) after removal of the bacteria and ratiometric pH calculation, 5 and 60 min after exposure to glucose, respectively. The average pH dropped from 5.90 (in e) to 5.12 (in f). Bars=20 µm.
The variance components analyses showed significant variation between individuals (var individual ), between specimens within individuals (var specimen∣individual ), and between FOV within specimens (var FOV∣specimen & individual ) at every time interval (; for examples, see and Supplementary Fig. 2). While var specimen∣individual tended to be the greater source of variation, the two other variance components were similar, being only slightly lower than var specimen∣individual . None of the variance component estimates decreased over time. Moreover, the analysis indicated similar values of the three variance components for biofilms from the sucrose-free group and the sucrose group ().
Table 1. Variance of biofilm pH between individuals (var individual ), between specimens within individuals (var specimen∣individual ), and between field of view (FOV) within specimens within individuals (var FOV∣specimen & individual ) at different time intervals in the sucrose-free group and the sucrose group.
Extracellular pH dropped in all biofilms from the sucrose-free group after addition of saliva containing 0.4% glucose ( (black datapoints)). The mean pH for all FOVs of this group dropped to 6.39 at the 3–4 min interval, and to 5.63 at the 59–60 min interval ( (black datapoints)). All FOVs taken together, half of the final H+ ion concentration (at 60 min) was reached after 16.7 min. In most FOVs, the pH drop was steeper initially. Nevertheless, pH continued to fall throughout the experimental period ( and ).
Fig. 3. Mean extracellular pH values of all examined fields of view in five fixed time intervals. The first three time intervals (3–4 min, 6–7 min, 12–13 min) are based on the 15 min data and the last two intervals (29–30 min, and 59–60 min) on the 60-min data. Black data points show the mean pH±se for the sucrose-free group and white data points show the mean pH±se for the sucrose group.
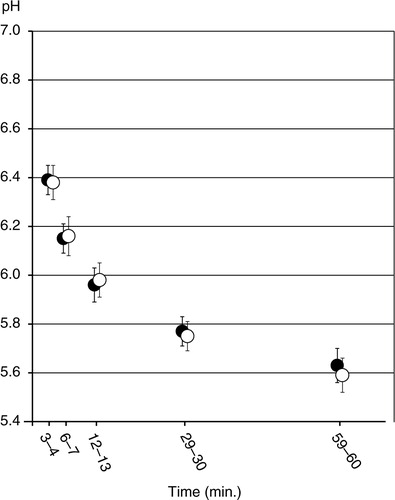
Biofilms in the sucrose group showed similar extracellular pH drops as biofilms in the sucrose-free group. The mean pH value in the extracellular space decreased from 6.38 at the 3–4 min interval to 5.59 at the 59–60 min interval ( (white datapoints)). As in the biofilms grown without sucrose, an initially rapid pH drop was observed, with half of the final H+ ion concentration being reached after 18.6 min. No statistically significant differences were observed in mean pH between the two treatment groups during any of the analyzed time intervals (3–4 min, 6–7 min, 12–13 min, 29–30 min, or 59–60 min).
Discussion
The present study applies ratiometric imaging to systematically record the extracellular pH in young dental biofilms from several individuals for time periods up to 60 min. We demonstrate that the pH drops differ between sites from different individuals, between sites from different specimens, and within single biofilms grown on one glass slab. It is well known that large inter-individual differences exist in biofilm formation rate, architecture and microbial composition (Citation21–Citation24), as well as host-specific differences in saliva flow and chemistry (Citation25, Citation26). Consequently, differences in the pH drops between individuals were expected (Citation8, Citation10) (Citation27). However, it was surprising that the variation in the pH drops was not more pronounced between individuals than between specimens from the same individual, and even between FOVs from the same specimen in the same individual. These results shed new light on dental biofilm metabolism, providing evidence for a pronounced chemical heterogeneity within thin developing dental biofilms.
We assume that five key processes influence pH in the biofilms in this study: 1) supply of glucose and buffering ions, 2) oxygen depletion, 3) bacterial acid production, 4) bacterial acid consumption, and 5) diffusion of acids within and out of the biofilms. Glucose limitation is not likely to account for the observed differences in pH within the same biofilm, because it is delivered in excess and diffuses readily in the thin (10–30 µm) biofilms (Citation28). Moreover, Schlafer et al. (Citation29) have previously shown rapid pH drops in deeper layers of five-species laboratory biofilms (up to 70 µm) upon exposure to 0.4% glucose. Likewise, buffering ions deriving from the salivary solution should penetrate quickly through the thin biofilms. The observed differences in pH within the same biofilm typically arose within short time (<5 min; see and Supplementary Fig. 2), indicating that oxygen depletion and acid production occur at different rates in closely juxtaposed areas. As soon as differences in pH are present within one biofilm, diffusion of H+ ions starts, thereby counteracting the chemical gradient. Still, pH microenvironments were conserved throughout the observation period. This is particularly interesting, as the reaction chamber represents a closed system without fresh medium supply and clearance of acids. Diffusion was not able to compensate for the continuously higher production of H+ ions in what we might call ‘acidogenic hot spots’ in the biofilms.
Several factors might explain the presence of acidogenic hot spots in a biofilm. First, differences in the bacterial composition within a biofilm might result in different metabolic activities. Studies have documented the existence of distinct microcolonies of bacterial species or genera in both in-situ-grown dental biofilms (Citation21, Citation30) and in biofilms on natural teeth (Citation14, Citation15), which could reflect an altered ecological milieu in some areas compared with others. Second, different metabolic activities might derive from bacteria being in different physiological states, depending on the area of the biofilm. It has been shown that bacterial vitality varies across dental biofilms (Citation31), and differential access to nutrients and metabolites, as well as the presence of water channels (Citation32), might potentially impact acid production and diffusion. Finally, the role of the extracellular matrix for the conservation of acidic microenvironments must be appraised. Recently, the spatial distribution of pH in a mixed-species biofilm model consisting of Streptococcus mutans, Actinomyces naeslundii, and Streptococcus oralis was recorded, and the authors demonstrated low-pH areas inside complexes of exopolysaccharide, arguing that the extracellular matrix might act as a barrier against diffusion of metabolites between microenvironments (Citation33).
Importantly, the presence of acidogenic hot spots in close spatial relation to biofilm areas with low acid production may contribute to explain the observation of adjacent areas with demineralization and remineralization on tooth surfaces. Progressive demineralization of the dental hard tissues is likely to occur underneath acidogenic hot spots in the biofilm, as shown by the multifocal pattern of demineralization in microradiographs of root caries lesions (Citation34).
The initial pH drop found in this study is in accordance with previous findings and resembles the initial phase of a classical Stephan curve (Citation6). We assume that oxygen depletion in the reaction chamber by the biofilm bacteria occurs quickly in our experimental model due to the small size of the custom-made wells. Fermentation of glucose is enhanced as soon as anoxic conditions are reached in certain areas of the biofilm, and the pH begins to drop (Citation35). After some time, acid production slows down, possibly because of the toxic effect of the fermentation acids on the acidogenic bacteria (Citation36, Citation37). This was also seen in the present study, where half of the final H+ ion concentration was reached after less than 20 min in both experimental groups. It should be emphasized that biofilm pH in this study was recorded ex vivo in small custom-made wells without flow and clearance of metabolites. Restoration of near-neutral pH, as seen in a classical Stephan response in vivo, could therefore not occur. Interestingly, even though the rate of the pH drop decreased with time, pH continued to fall throughout the experimental period, supporting a continued acid production. Compared with other studies investigating biofilm pH upon exposure to carbohydrates, pH drops observed in the present study were moderate (Citation10, Citation12). The fact that we studied thin, young biofilms from caries-free individuals may serve as an explanation. Xiao et al (33) observed observed a positive correlation between biofilm thickness and pH in deep layers of the biofilm. Furthermore, smaller pH drops in 2-day-old biofilms than in older biofilms have been documented previously (Citation7, Citation8). Finally, regardless of other factors caries-free individuals may elicit a reduced pH-response to sugar challenge compared with caries-active individuals (Citation6, Citation38).
It was an unexpected finding that the pH drops did not differ between biofilms exposed to sucrose and biofilms grown without repetitive sucrose supply. While other studies have shown an increased acid production in biofilms exposed to sucrose during growth, these results were obtained for older biofilms (Citation5, Citation39). In studies using pH telemetry (Citation7, Citation8), pH drops below 5–5.5 were not observed until after 2 days of growth. As our biofilms were collected from healthy, caries-free individuals with an early microflora that is unlikely to comprise high numbers of aciduric microorganisms (Citation40), we conclude that it takes more than 2 days with regular sucrose exposure to modulate species composition and biofilm metabolism.
Our method implied analysis of extracellular pH under static conditions. The absence of flow and consequently the lack of acid clearance obviously impact the study results. Different pH profiles might be observed under flow conditions. On the one hand, constant supply of fresh saliva with neutral pH and the removal of protons might reduce pH drops at the bottom of the biofilm. On the other hand, removal of protons from the biofilm may reduce diffusion of protons between acidogenic hot spots and sites with low acid production leading to a more pronounced difference in pH between these sites. As biofilms were incubated with saliva titrated to pH 7 at the beginning of an experiment, the baseline pH value was not actually calculated. Such calculations would be difficult as pH drops during sample handling before the first image acquisition. However, control biofilms incubated with glucose-free sterile saliva showed a constant pH of 7 (data not shown). A clear drawback of microscopy-based pH recordings is that monitoring of multiple FOV reduces the number of time points that can be collected for each individual FOV. Comparison of the 15-min data (three FOV per biofilm) with the 60-min data (six FOV per biofilm) showed that the initial rapid pH drop in the biofilms was underestimated in the 60-min experiments. We therefore combined data from both series of experiments for interpretation. Other technical difficulties regarding image acquisition and image analysis have been discussed elsewhere (Citation16, Citation41).
In conclusion, the present study is the first of its kind to apply the combination of pH ratiometry and digital image analysis to systematically record extracellular pH in intact dental biofilms from 10 individuals for up to 1 h. We revealed heterogeneous pH landscapes within the three-dimensional biofilm architecture, including the presence of acidogenic hot spots. The data suggest that sucrose supply during growth does not affect pH development in young dental biofilms. Future studies should explore the importance of acidogenic hotspots for caries development.
Supplementary Figures
Download Zip (178.8 KB)Acknowledgements
We thank Lene Grønkjær, laboratory technician, for excellent technical assistance. This work was funded by Aarhus University Research Foundation and the Simon Spies Foundation.
Notes
To access the supplementary material for this article, please see Supplementary files under ‘Article Tools’
Related Research Data
References
- Fejerskov O, Manji F. Bader J. Risk assessment in dental caries. Risk assessment in dentistry . 1990; Chapel Hill, NC: University of North Carolina Dental Ecology. 215–7.
- Rateitschak-Plüss EM, Guggenheim B. Effects of a carbohydrate-free diet and sugar substitutes on dental plaque accumulation. J Clin Periodontol. 1982; 9: 239–51.
- Scheie AA, Arneberg P, Orstavik D, Afseth J. Microbial composition, pH-depressing capacity and acidogenicity of 3-week smooth surface plaque developed on sucrose-regulated diets in man. Caries Res. 1984; 18: 74–86.
- Ribeiro CC, Tabchoury CP, Del Bel Cury AA, Tenuta LM, Rosalen PL, Cury JA. Effect of starch on the cariogenic potential of sucrose. Br J Nutr. 2005; 94: 44–50. http://dx.doi.org/S0007114505001510 [PubMed Abstract].
- Hassan H, Lingstrom P, Carlen A. Plaque pH in caries-free and caries-active young individuals before and after frequent rinses with sucrose and urea solution. Caries Res. 2015; 49: 18–25. http://dx.doi.org/10.1159/000360798 [PubMed Abstract].
- Stephan RM. Intra-oral hydrogen-ion concentrations associated with dental caries activity. J Dent Res. 1944; 23: 257–66. http://dx.doi.org/10.1177/00220345440230040401.
- Imfeld T, Lutz F. Intraplaque acid formation assessed in vivo in children and young adults. Ped Dent. 1980; 2: 87–93.
- Imfeld TN. Identification of low caries risk dietary components. Monogr Oral Sci. 1983; 11: 1–198. [PubMed Abstract].
- Lingstrom P, Imfeld T, Birkhed D. Comparison of three different methods for measurement of plaque-pH in humans after consumption of soft bread and potato chips. J Dent Res. 1993; 72: 865–70.
- Scheie AA, Fejerskov O, Lingstrom P, Birkhed D, Manji F. Use of palladium touch microelectrodes under field conditions for in vivo assessment of dental plaque pH in children. Caries Res. 1992; 26: 44–51.
- Zaura E, ten Cate JM. Dental plaque as a biofilm: a pilot study of the effects of nutrients on plaque pH and dentin demineralization. Caries Res. 2004; 38: 9–15. http://dx.doi.org/10.1159/000074357 [PubMed Abstract].
- von Ohle C, Gieseke A, Nistico L, Decker EM, DeBeer D, Stoodley P. Real-time microsensor measurement of local metabolic activities in ex vivo dental biofilms exposed to sucrose and treated with chlorhexidine. Appl Environ Microbiol. 2010; 76: 2326–34. http://dx.doi.org/10.1128/AEM.02090-09 [PubMed Abstract] [PubMed CentralFull Text].
- Battin TJ, Sloan WT, Kjelleberg S, Daims H, Head IM, Curtis TP, etal. Microbial landscapes: new paths to biofilm research. Nat Rev Microbiol. 2007; 5: 76–81. http://dx.doi.org/nrmicro1556 [PubMed Abstract].
- Zijnge V, van Leeuwen MB, Degener JE, Abbas F, Thurnheer T, Gmur R, etal. Oral biofilm architecture on natural teeth. PLoS One. 2010; 5: 9321. http://dx.doi.org/10.1371/journal.pone.0009321.
- Dige I, Gronkjaer L, Nyvad B. Molecular studies of the structural ecology of natural occlusal caries. Caries Res. 2014; 48: 451–60. http://dx.doi.org/10.1159/000357920 [PubMed Abstract].
- Schlafer S, Garcia JE, Greve M, Raarup MK, Nyvad B, Dige I. Ratiometric imaging of extracellular pH in bacterial biofilms with C-SNARF-4. Appl Environ Microbiol. 2015; 81: 1267–73. http://dx.doi.org/AEM.02831-14 [PubMed Abstract] [PubMed CentralFull Text].
- Dige I, Nilsson H, Kilian M, Nyvad B. In situ identification of streptococci and other bacteria in initial dental biofilm by confocal laser scanning microscopy and fluorescence in situ hybridization. Eur J Oral Sci. 2007; 115: 459–67. http://dx.doi.org/10.1111/j.1600-0722.2007.00494.x [PubMed Abstract].
- de Jong MH, van der Hoeven JS, van OS JH, Olijve JH. Growth of oral Streptococcus species and Actinomyces viscosus in human saliva. Appl Environ Microbiol. 1984; 47: 901–4. [PubMed Abstract] [PubMed CentralFull Text].
- Daims H, Lucker S, Wagner M., Daime. A novel image analysis program for microbial ecology and biofilm research. Environ Microbiol. 2006; 8: 200–13. http://dx.doi.org/10.1111/j.1462-2920.2005.00880.x [PubMed Abstract].
- Rasband WS. ImageJ. U. S. National Institutes of Health, Bethesda, MD, USA, 1997–2006. 1.42q. http://rsb.info.nih.gov/ij/.
- Dige I, Raarup MK, Nyengaard JR, Kilian M, Nyvad B. Actinomyces naeslundii in initial dental biofilm formation. Microbiology. 2009; 155: 2116.
- Dige I, Schlafer S, Nyvad B. Difference in initial dental biofilm accumulation between night and day. Acta Odontol Scand. 2012; 70: 441–7. http://dx.doi.org/10.3109/00016357.2011.634833 [PubMed Abstract].
- Al-Ahmad A, Follo M, Selzer AC, Hellwig E, Hannig M, Hannig C. Bacterial colonization of enamel in situ investigated using fluorescence in situ hybridization. J Med Microbiol. 2009; 58: 1359–66. http://dx.doi.org/10.1099/jmm.0.011213-0 [PubMed Abstract].
- Hannig C, Hannig M, Rehmer O, Braun G, Hellwig E, Al-Ahmad A. Fluorescence microscopic visualization and quantification of initial bacterial colonization on enamel in situ. Arch Oral Biol. 2007; 52: 1048–56. http://dx.doi.org/10.1016/j.archoralbio.2007.05.006 [PubMed Abstract].
- Kleinberg I, Jenkins GN. The Ph of dental plaques in the different areas of the mouth before and after meals and their relationship to the Ph and rate of flow of resting saliva. Arch Oral Biol. 1964; 9: 493–516.
- Filoche S, Wong L, Sissons CH. Oral biofilms: emerging concepts in microbial ecology. J Dent Res. 2010; 89: 8–18. http://dx.doi.org/10.1177/0022034509351812 [PubMed Abstract].
- Jensen ME, Schachtele CF. Plaque pH measurements by different methods on the buccal and approximal surfaces of human teeth after a sucrose rinse. J Dent Res. 1983; 62: 1058–61.
- Stewart PS. Diffusion in biofilms. J Bacteriol. 2003; 185: 1485–91.
- Schlafer S, Raarup MK, Meyer RL, Sutherland DS, Dige I, Nyengaard JR. pH landscapes in a novel five-species model of early dental biofilm. PLoS One. 2011; 6: 25299. http://dx.doi.org/10.1371/journal.pone.0025299.
- Al-Ahmad A, Wunder A, Auschill TM, Follo M, Braun G, Hellwig E, etal. The in vivo dynamics of Streptococcus spp., Actinomyces naeslundii, Fusobacterium nucleatum and Veillonella spp. in dental plaque biofilm as analysed by five-colour multiplex fluorescence in situ hybridization. J Med Microbiol. 2007; 56: 681–7.
- Arweiler NB, Hellwig E, Sculean A, Hein N, Auschill TM. Individual vitality pattern of in situ dental biofilms at different locations in the oral cavity. Caries Res. 2004; 38: 442–7. http://dx.doi.org/10.1159/000079625 [PubMed Abstract].
- Wood SR, Kirkham J, Marsh PD, Shore RC, Nattress B, Robinson C. Architecture of intact natural human plaque biofilms studied by confocal laser scanning microscopy. J Dent Res. 2000; 79: 21–7.
- Xiao J, Klein MI, Falsetta ML, Lu B, Delahunty CM, Yates JR3rd, etal. The exopolysaccharide matrix modulates the interaction between 3D architecture and virulence of a mixed-species oral biofilm. PLoS Pathog. 2012; 8: 1002623. http://dx.doi.org/10.1371/journal.ppat.1002623.
- Thylstrup A, Leach SA, Qvist V. Active and inactive root surface caries – structural entities. Dentine and dentine reactions in the oral cavity . 1987; Oxford, UK: IRL Press Ltd. 165–79.
- Abbe K, Carlsson J, Takahashi-Abbe S, Yamada T. Oxygen and the sugar metabolism in oral streptococci. Proc Finn Dent Soc. 1991; 87: 477–87. [PubMed Abstract].
- Carlsson J. Bacterial metabolism in dental biofilms. Adv Dent Res. 1997; 11: 75–80.
- Bowden GH, Hamilton IR. Survival of oral bacteria. Crit Rev Oral Biol Med. 1998; 9: 54–85.
- Englander HR, Carter WJ, Fosdick LS. The formation of lactic acid in dental plaques. III. Caries-immune individuals. J Dent Res. 1956; 35: 792–9.
- Pecharki GD, Cury JA, Paes Leme AF, Tabchoury CP, Del Bel Cury AA, Rosalen PL, etal. Effect of sucrose containing iron (II) on dental biofilm and enamel demineralization in situ. Caries Res. 2005; 39: 123–9. http://dx.doi.org/83157 [PubMed Abstract].
- Nyvad B, Kilian M. Comparison of the initial streptococcal microflora on dental enamel in caries-active and in caries-inactive individuals. Caries Res. 1990; 24: 267–72.
- Schlafer S, Dige I. Ratiometric imaging of extracellular pH in dental biofilms. J Vis Exp. 2016. e53622:2016. doi: http://dx.doi.org/10.3791/53622 [in press]..