
Abstract
Background
The studies of the distribution of Actinomyces spp. on carious and non-carious root surfaces have not been able to confirm the association of these bacteria with root caries, although they were extensively implicated as a prime suspect in root caries.
Objective
The aim of this study was to observe the gene expression of Actinomyces spp. in the microbiota of root surfaces with and without caries.
Design
The oral biofilms from exposed sound root surface (SRS; n=10) and active root caries (RC; n=30) samples were collected. The total bacterial RNA was extracted, and the mRNA was isolated. Samples with low RNA concentration were pooled, yielding a final sample size of SRS=10 and RC=9. Complementary DNA (cDNA) libraries were prepared and sequenced on an Illumina® HiSeq 2500 system. Sequence reads were mapped to eight Actinomyces genomes. Count data were normalized using DESeq2 to analyse differential gene expression applying the Benjamini-Hochberg correction (false discovery rate [FDR]<0.001).
Results
Actinomyces spp. had similar numbers of reads (Mann-Whitney U-test; p>0.05), except for Actinomyces OT178 (p=0.001) and Actinomyces gerencseriae (p=0.004), which had higher read counts in the SRS. Genes that code for stress proteins (clp, dnaK, and groEL), enzymes of glycolysis pathways (including enolase and phosphoenolpyruvate carboxykinase), adhesion (Type-2 fimbrial and collagen-binding protein), and cell growth (EF-Tu) were highly – but not differentially (p>0.001) – expressed in both groups. Genes with the most significant upregulation in RC were those coding for hypothetical proteins and uracil DNA glycosylase (p=2.61E-17). The gene with the most significant upregulation in SRS was a peptide ABC transporter substrate-binding protein (log2FC=−6.00, FDR=2.37E-05).
Conclusion
There were similar levels of Actinomyces gene expression in both sound and carious root biofilms. These bacteria can be commensal in root surface sites but may be cariogenic due to survival mechanisms that allow them to exist in acid environments and to metabolize sugars, saving energy.
To access the supplementary material to this article, please see Supplementary files under ‘Article Tools’.
Over the past decades, the world's population has been experiencing a higher retention of teeth due to improvements in dental health care. This fact implies an increased number of exposed root surfaces that are susceptible to caries (Citation1). Knowledge of root caries etiopathogeny, and especially the primary etiological factor – the microbial biofilm, can support new research for the development of potentially useful targets for therapeutics. However, the current understanding of biofilm dynamics in root caries remains limited.
The search for a pathogenic species that causes root caries has been the objective of much of the research in this field since the 1970s (Citation2–Citation5). Actinomyces spp. are non-acidophilus, gram-positive rods, and facultative anaerobic bacteria that are related to dental plaque aging (Citation6). Actinomyces viscosus and Actinomyces naeslundii were implicated as the pathogen of root surface caries by animal models and culture-based studies (Citation2, Citation3) (Citation5, Citation7). However, studies of the distribution of Actinomyces spp. have revealed that biofilm from both sound and carious root surfaces contains high proportions of Actinomyces spp. (Citation8–Citation12). The role of this genus in root caries development or health maintenance may be potentially complex because they could be capable of surviving in both sites, adapting the metabolism to exploit the available substrate.
Many advances in the understanding of dental caries are currently related to the cultured-independent DNA-based methods. The most important advantage would be assessment of the underestimated non-cultivable microorganisms’ prevalence in oral biofilms. Studies using 16S rRNA gene cloning and sequencing confirmed that the predominant bacteria in both carious and sound root surfaces was Actinomyces spp., followed by Streptococcus mutans and lactobacilli (Citation13). However, DNA-based approaches also have limitations; it is not possible to determine if the DNA is coming from a viable cell, and it is not feasible to determine if the bacteria are expressing virulence factors that contribute to caries development or if they are only present in the environment struggling to survive. Rapid evolution of molecular techniques has enabled understanding not only of the microbiota composition but also of the microbiota function. RNA-based methods have enabled the study of biofilm gene expression, and consequently, the assessment of its functions. Hence, the aim of this study is to compare the gene expression of Actinomyces spp. in root surfaces’ biofilms with and without caries using the RNA-seq approach.
Materials and methods
Volunteers with an exposed root surface on at least one tooth and no root caries lesions were included in the sound root surface (SRS) group (n=10). Dental biofilms were collected from all available exposed root surfaces. The number of exposed root surfaces varied among individuals. All participants recruited for the root caries (RC) group (n=30) had one primary cavitated root lesion in need of restorative treatment. All lesions showed characteristics of present activity (soft and yellow dentin). Biofilm and carious dentin samples (of soft and infected tissue) were collected from patients during the restorative treatment.
Ethical considerations
This study was approved by the ethics committee of the Federal University of Rio Grande do Sul (process n° 427.168) and by the National Research Ethics Service Committee Yorkshire & the Humber - Leeds West (protocol n° 2012002DD). Volunteers in the study were patients who attended clinics in two centres for any dental treatment: Faculty of Dentistry, Federal University of Rio Grande do Sul, Porto Alegre, Brazil, and Leeds School of Dentistry, University of Leeds, Leeds, UK. All volunteers consented to participate by donating samples after receiving the information about the study.
RNA-seq
After clinical collection, samples were immediately placed in a nuclease-free microtube containing 1 mL of RNAprotect reagent (QIAGEN, Inc., Venlo, Netherlands), transferred to the laboratory, centrifuged at 10,000× g for 30 s. Pellets were stored at −80°C until further processing.
The total RNA was extracted from all the samples using an UltraClean® Microbial RNA Isolation Kit (Mo-BIO Laboratories, Inc., San Diego, CA) with on-column DNase digestion (QIAGEN, Inc., Venlo, Netherlands). The extracted RNA samples were quantified using the Quant-iT™ RiboGreen® RNA Assay Kit (Invitrogen, Inc., Waltham, Massachusetts, USA), and samples with total RNA concentration<30 ng/RNA were pooled, leading to a final sample count of 10 SRS and 9 RC (Supplementary Table 1).
A Ribo-Zero™ rRNA Removal Kit (Bacteria), (Epicentre, Illumina, Inc., San Diego, CA) was used for mRNA enrichment, and Illumina® TruSeq™ library prep protocols (Illumina, Inc.) were used for library preparation. Briefly, these steps included: RNA fragmentation, cDNA synthesis, DNA fragment repair, amplification by polymerase chain reaction and purification, and adapter ligation for multiplexing. The final quality of cDNA and library validation was carried out using an Agilent Bioanalyzer (Agilent Technologies). Paired-end sequencing was then performed on an Illumina® HiSeq2500 (Illumina, Inc., San Diego, CA) sequencer to obtain 2×100 bp sequence reads.
Selection of genomes in databases
RNA-seq sequencing data are available from the National Center for Biotechnology Information (NCBI) Sequence Read Archive, under the accession numbers SRS779973 and SRS796739.
Genomes of n=162 bacteria and their associated information were downloaded from the DNA Data Bank of Japan, NCBI, the Broad Institute, and the Human Oral Microbiome Database (HOMD); their data were combined and used as a single organism reference in the short read mapping, which was carried out within the CLC Genomics Workbench 7.5.1 software (CLC Bio, QIAGEN), as described by Do et al. (Citation14). The genomes of eight Actinomyces strains were selected for further analysis; these included Actinomyces gerencseriae DSM 6844, Actinomyces johnsonii F0542, A. naeslundii str. Howell 279, Actinomyces odontolyticus ATCC 17982, Actinomyces sp. oral taxon 170 str. F0386, Actinomyces sp. oral taxon 178 str. F0338, Actinomyces sp. oral taxon 448 str. F0400, and Actinomyces oris (formerly known as A. viscosus C505).
Bioinformatics and differential expression
Count tables were generated containing the read count for each oral Actinomyces spp. genome. Proportion of genes per genome expressed (transcripts) was also observed (reads ‘> 0’ in at least one sample per group). The cut-off for considering the putative presence of the organism in the sample was 2,000 mapped reads (approximately one read per gene).
The relative mean expression (RME) level for Actinomyces spp. was calculated for each of the sample groups (SRS and RC) by species. The median of the relative expression values, obtained from the library size estimation carried out within the R package DESeq, was then calculated for each gene. The RME values in all genomes analysed here were added and ranked to observe and compare the most highly expressed Actinomyces spp. transcripts in the SRS and RC samples.
Differential gene expression among sample groups was carried out using the R package DESeq2 for each species (Citation15). The cut-off for designating a gene as being differentially expressed was a change in transcript levels of at least 1-log2 fold (a two-fold difference) (positive values=upregulated in RC and downregulated in SRS, negative values=downregulated in RC and upregulated in SRS) and a Benjamini-Hochberg adjusted P-value (FDR) of less than 10−3 (Citation16). Principal component analysis (PCA) plots were constructed within the DESeq2 package to display the gene expression similarity among samples. The number of overexpressed genes by Actinomyces strains was determined per condition (health or disease metabolism).
Results
Eight strains of Actinomyces were mapped and evaluated in this study, comprising a total of 21,337 analysed genes. The total number of reads per sample per organism ranged from SRS=6,250–883,308 and RC=2,461–2,015,578 (). Proportion of expressed genes per genome ranged from 49.3–75.9 (SRS) and 28.0–89.8% (RC). All Actinomyces spp. had a similar number of reads and transcripts (Mann-Whitney U-test; p>0.05), except for Actinomyces OT178 (median of reads=39,174 in SRS and 4,816 in RC; p=0.001) and A. gerencseriae (median of reads=85,639 in SRS and 47,150 in RC; p=0.004), which had higher read counts for the SRS samples (). Actinomyces sp. OT448 presented the higher number of reads – 883,308 (sample SRS_12) and 2,015,578 (sample RC_H), representing around 60% of total Actinomyces gene expression in all samples, RC and SRS, and achieving 86% of total Actinomyces gene expression in RC_A (Supplementary Fig. 1). Actinomyces spp. OT170 and A. johnsonii F0542 had the lowest number of genes per genome expressed in SRS (49.3 and 49.5%), while Actinomyces sp. OT178 had the lowest number of genes per genome expressed in RC (only 28% of their total number of genes). The other Actinomyces spp. expressed an average of 65% of their genes.
Table 1. Descriptive analysis of proportion of transcripts and number of significantly upregulated genes (upreg) by species of Actinomyces spp.
Most expressed genes
The log scale of RME of the 30 highest values at gene level sorted in ascending order for the RC samples are displayed in . Also, the 10 highest values at species level were sorted in ascending order for the RC samples and are displayed in Supplementary Fig. 2. The corresponding values for SRS samples for the same genes were plotted as well. Certain common features could be observed in the expression levels of most genes independent of whether the biofilms came from (RC or SRS).
Fig. 1. Relative median expression (RME; log 10) of genes in the sound root surfaces (SRS; n=10) and root caries (RC; n=9) samples. RME was calculated from the median values of normalized read counts. The 30 highest RME values were sorted in ascending order for the RC samples, are displayed with the corresponding values for SRS samples, and indicate genes that are most highly expressed by all Actinomyces.
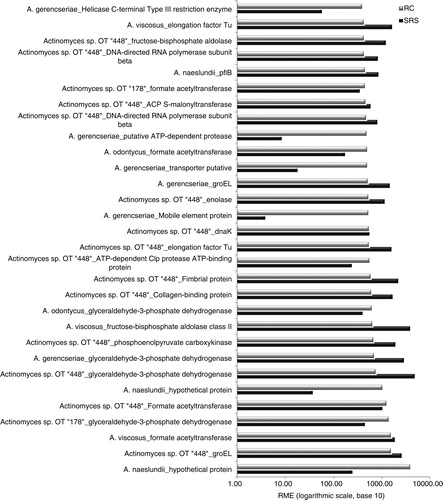
A subset of genes that code for stress proteins and enzymes of glycolysis pathways was highly, but not differentially (p>0.001), expressed in both groups. These genes code for key proteins involved in the maintenance of cell viability and metabolism in oral biofilms, meaning that Actinomyces are metabolically active in both caries and sound root surfaces biofilms. Stress-related genes clp, dnaK, and groEL were highly expressed for Actinomyces OT448, A. naeslundii, and A. gerencseriae. The enzymes with functions in glycolysis pathways enolase, formate-acetyltransferase, phosphoenolpyruvate carboxykinase (GTP) (pckA) (gluconeogenesis), and glyceraldehyde-3-phosphate dehydrogenase (gap) had higher gene expression for Actinomyces. Also, among those highly expressed genes, there were genes coding for proteins related to adhesion (such as Type-2 fimbrial and collagen-binding protein) and cell growth (EF-Tu).
Differential expression analysis
Using a conservative approach and considering up- or downregulated genes with more than a two-fold difference and FDR<10−3, it was shown that only 5.9% (21,337 genes, 1,254 with significant differential expression) of Actinomyces genes had significant differential expression. There were quite a few genes up- and downregulated in the samples independent of whether they belonged to a sound or a caries biofilm. RC presented a higher number of overexpressed genes (n=484 genes in SRS and n=770 genes in RC) (). A. oris C505 had the highest differential expression (8.9% of genes upregulated in RC). Only Actinomyces OT178 presented a large number of overexpressed genes in SRS (355 upregulated and 54 downregulated genes in SRS).
displays the most significantly differentially expressed genes for each condition. The bioinformatics tool DESeq2 suggested that genes with the most significant upregulation in RC were those coding for many hypothetical proteins and uracil DNA glycosylase (log2FC=6.60; FDR=2.61E-17), which is an important protein for transcription and mutagenesis prevention.
Table 2. Upregulated Actinomyces spp. genes in the root caries and in the sound root surfaces samples
Two systems responsible for alkalinization of the biofilm had upregulated genes in RC: arginine biosynthesis and urea catabolism. In arginine biosynthesis, some genes had significant upregulation in RC (none upregulated in SRS). A. oris C505 was coding for arginine deiminase (log2FC=3.2, FDR=0.00003); Actinomyces OT178 was coding for arginine ABC transporter ATP-binding protein (log2FC=3.77; FDR=2.09E-10); and A. oris C505 was coding for arginine ABC transporter ATP-binding protein (log2FC=1.75; FDR=0.0009). In the urea metabolism, one gene showed significant upregulation in RC: urea transporter (log2FC=2.8; FDR=0.0006) expressed by A. oris C505.
In the case of significant downregulated genes in RC, the most significant one was a peptide ABC transporter substrate-binding protein (log2FC=−6.00, FDR=2.37E-05). Several hypothetical proteins were identified as well as proteins such as lipase (log2FC=−5.64, FDR=9.37E-05), membrane proteins (log2FC=−5.59, FDR=1.59E-04), glycosyl transferase family 2 (log2FC=−5.22, FDR=4.15E-04), amino acid and carbohydrate ABC transporters (log2FC=−5.14, FDR=2.99E-13), and others. The enzyme lactate dehydrogenase was upregulated in SRS (none in RC), expressed by A. oris C505 (log2FC=−2.02), A. gerencseriae (log2FC=−1.82), A. johnsonii (log2FC=−3.53, FDR=7.30E-06), Actinomyces OT178 (log2FC=−3.08, FDR=3.06E-10), and A. naeslundii (log2FC=−2.65, FDR=1.73E-06).
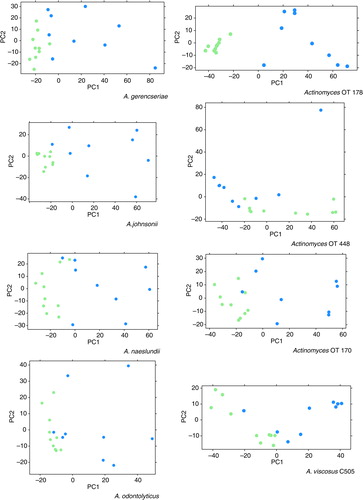
shows PCA plots that were based on the transcriptomic data mapped to each Actinomyces strain. It indicates larger differences among RC samples than among SRS samples, suggesting that metabolic functions in the caries lesions are less conserved than in the SRS samples.
Fig. 2. Principal component analysis (PCA) plots displaying sample-to-sample distances for root caries’ (blue) and sound root surfaces’ (green) biofilms based on the differential expression by Actinomyces spp.
Metabolic pathways
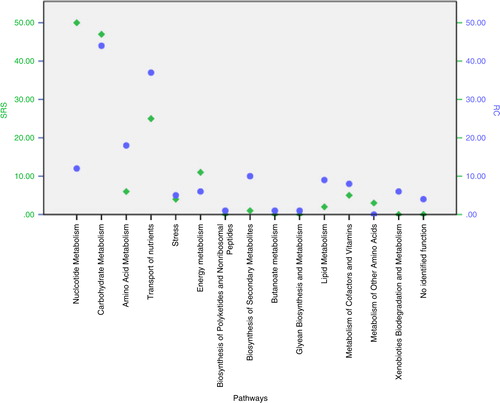
shows the number of overexpressed genes per group (SRS and RC). A higher number of genes involved in amino acid metabolism were overexpressed in RC samples. Nucleotide metabolism had a higher number of overexpressed genes in SRS. Both groups of samples (SRS and RC) indicated overexpression of genes associated with carbohydrate metabolism.
Fig. 3. Number of overexpressed genes by pathway class for root caries’ (blue) and sound root surfaces’ (green) biofilms based on the differential expression analysis for the selected Actinomyces spp.
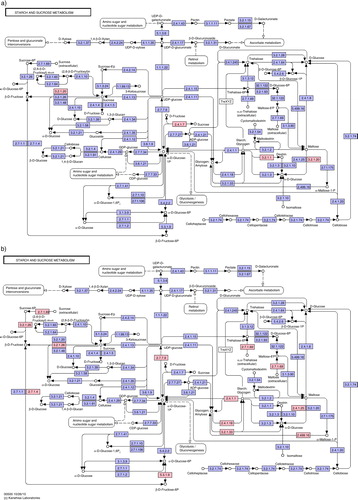
shows the starch and sucrose metabolism pathways, highlighting the overexpressed functions in SRS and RC. As can be observed, all overexpressed genes are different among groups. While in RC, Actinomyces spp. especially seem to be metabolizing simple sugars (as sucrose and galactose), in SRS they are metabolizing glycogen. For example, the enzyme glycogen phosphorylase, which catalyses the first step in the degradation of large branched glycan polymers, as starch, was overexpressed in SRS, coded by Actinomyces OT178, Actinomyces OT170, A. oris C505, A. naeslundii, and A. gerencseriae. A. naeslundii was overexpressing sucrose phosphorylase in RC and glycogen phosphorylase in SRS. A. johnsonii was overexpressing alpha-glucosidase, which has a function in galactose metabolism in RC and 4-alpha-glucanotransferase (amylomaltase) in SRS. Actinomyces OT170 was also overexpressing alpha-glucosidase and sucrose phosphorylase in RC; although in SRS, this species was overexpressing PTS system, beta-glucoside, sucrose-6-phosphate hydrolase, and glycogen phosphorylase. Actinomyces OT178 was overexpressing Alpha-amylase and Alpha-1,4-glucan--maltose-1-phosphate maltosyltransferase in RC; and in SRS, it was overexpressing fructokinase, UTP–glucose-1-phosphate uridylyltransferase, glycogen phosphorylase, and alpha-1,6-glucosidase. A. gerencseriae was overexpressing fructokinase in SRS, and A. oris C505 was overexpressing glucose-6-phosphate isomerase, glycogen phosphorylase, and 1,4-alpha-glucan-branching in SRS. The arginin metabolism pathway can be consulted in Supplementary Fig. 3.
Fig. 4. Starch and sucrose metabolism pathway obtained from Kyoto Encyclopedia of Genes and Genomes (KEGG) and displaying overexpressed genes (pink boxes) for root caries and sound root surfaces biofilms, based on the differential expression analysis of selected Actinomyces spp.
Overexpressed in RC: Maltodextrin glucosidase (EC 3.2.1.20) expressed by A. johnsonii (Log2FC=3.47; FDR=4.54E-05) and by Actinomyces OT170 (Log2FC=3.71; FDR=1.53E-05). Sucrose phosphorylase (EC 2.4.1.7) expressed by Actinomyces OT170 (Log2FC=2.32; FDR=1.56E-05) and by A. naeslundii (Log2FC=2.51; FDR=1.85E-04). Alpha-amylase (EC 3.2.1.1) expressed by Actinomyces OT178 (Log2FC=3.08; FDR=5.95E-07).
Overexpressed in SRS: PTS system, beta-glucoside-specific IIB component (EC 2.7.1.69) expressed by Actinomyces OT170 (Log2FC=−2.57; FDR=4.17E-08). Sucrose-6-phosphate hydrolase (EC 3.2.1.26) expressed by Actinomyces OT170 (Log2FC=−3.22; FDR=1.94E-04). Fructokinase (EC 2.7.1.4) expressed by Actinomyces OT178 (Log2FC=−3.07; FDR=1.10E-05) and by A. gerencseriae (Log2FC=−2.17; FDR=1.96E-04). UTPglucose-1-phosphate uridylyltransferase (EC 2.7.7.9) expressed by Actinomyces OT178 (Log2FC2.34; 1.83E-04). Glucose-6-phosphate isomerase (EC 5.3.1.9) expressed by A. oris C505 (Log2FC=−1.97; FDR=6.53E-05). Glycogen phosphorylase (EC 2.4.1.1) expressed by A. gerencseriae (Log2FC=−2.06; 3.62E-04), Actinomyces OT178 (Log2FC=−1.98; FDR=3.62E-04), A. oris C505 (Log2FC=−1.92, FDR= 4.07E-04), A. naeslundii (Log2FC=−1.79; FDR=5.79E-04), and Actinomyces OT170 (Log2FC=−1.72, FDR=6.42E-05). 1,4-alpha-glucan-branching (EC 2.4.1.18) protein expressed by A. oris C505 (Log2FC=−2.67; FDR=2.82E-06). Alpha-1,6-glucosidase expressed by Actinomyces OT178 (Log2FC=−3.28; FDR=2.26E-06) (EC 3.2.1.33). 4-alpha-glucanotransferase (amylomaltase) (EC 2.4.1.25) expressed by A. johnsonii (Log2FC=−2.91; FDR=3.30E-04). Alpha-1,4-glucan--maltose-1-phosphate maltosyltransferase (EC 2.4.99.16) expressed by Actinomyces OT178 (Log2FC=−2.20; FDR=8.72E-07).
Discussion
Many studies have investigated the microbiota associated with human tooth root surfaces in health and disease by culture-based approaches, with the aim of detecting the root caries pathogen (Citation7, Citation9) (Citation11–Citation13, Citation17–Citation22). It was believed that a unique microbiota from root surfaces with and without caries lesions would be comprised mainly of Actinomyces spp. The present analysis focused on transcriptional dynamics among eight abundant Actinomyces spp. in oral microbial populations. Overall, exposed root surface samples were collected from larger surface areas compared to the lesions, which could affect differential analyses; however, normalizations steps were applied, and results showed consistently high levels of gene expression in all Actinomyces strains in both sample groups (RC and SRS). Additionally, the very low number of differentially expressed genes (5.9%) indicates that the Actinomyces present have very similar metabolisms in both caries and caries-free sites. This means that Actinomyces spp. seem able to easily exploit this niche, and that they are able to colonize and proliferate in and on root surfaces in a healthy and cariogenic environment.
The analysed species of Actinomyces seem to have a small number of genes with significantly higher expression for putative cariogenic functions, except for Actinomyces OT178, which had some overrepresented functions in health-related biofilm. The present study found a high expression level of some genes related to cell wall metabolism () in health biofilms and lesions. Other studies that used RNA-seq to identify the transcriptome/metatranscriptome of oral biofilms also found overrepresentation of elongation factors Tu and G, underlining their involvement in oral biofilm formation (Citation14, Citation23) (Citation24). Likewise, putative transposase and multidrug resistance protein were upregulated in RC. These genes take part in mechanisms that can transfer genes or plasmids from a pathogen to oral commensal bacteria. In bacteria, transposons can contain genes for antibiotic resistance or can modify the phenotype of other species by mutation, which can be related to the higher potential for genetic mobility when growing as a biofilm. In another study that evaluated the metatranscriptome of biofilms related to periodontal disease, transposases were overexpressed by Lactobacillus casei and Streptococcus mitis in pathogenic biofilms (Citation25). Furthermore, because many hypothetical proteins were upregulated in both conditions, their functions should be studied to clarify the relationship of Actinomyces to the development of root caries, even though Actinomyces previously have been described as the most prevalent bacteria in root surfaces (Citation2, Citation7) (Citation12, Citation13) (Citation19, Citation26).
It was suggested that microorganisms involved in root caries are less dependent on refined carbohydrates than in coronal caries (Citation9). In the present study, many genes related to glycolysis/gluconeogenesis pathways were identified, concluding that Actinomyces generate energy mainly from glycolysis in both healthy and carious root sites but using different enzymes ( and ). This suggests the importance of sugar availability for the genus’ prevalence in the plaque, despite reports of their low saccharolytic activities (Citation27). Likewise, this also suggests that the metabolism of carbohydrates is the most altered function of Actinomyces in a biofilm in homeostasis and dysbiosis. Actinomyces cells metabolize carbohydrates to organic acids and can also accumulate intracellular polysaccharides, which represent a cariogenic trait in these bacteria.
The main route to degrade glucose is the Embden-Meyerhof-Parnas (EMP) pathway, which is widely distributed in saccharolytic bacteria. However, it was already shown that A. naeslundii cells operate in this pathway in a manner different from that of the oral streptococci, which comprise the other dominant part of the saccharolytic bacteria in dental plaque and whose glycolysis has been studied intensively (Citation28). Actinomyces use the compounds of polyphosphate and phosphoenolpyruvate carboxykinase (GTP) (also called pckA in Actinomyces OT448) as phosphate donors for hexokinase synthesis and phofructokinase phosphatase instead of ATP. GTP converts oxaloacetate into phosphoenolpyruvate and carbon dioxide. Further metabolism will generate the end products lactate, formate, acetate, and succinate through the regular EMP pathway (Citation27, Citation28) like most other saccharolytic bacteria. These specific initial steps of phosphorylation could be implicated in the pathogenesis because this mechanism gives some advantage to Actinomyces cells for energy saving. In the results of this study, phosphoenolpyruvate carboxykinase was one of the higher expressed genes in RC and SRS, with no differential expression (very similar gene expression in both conditions).
Adhesion of bacteria to tooth surfaces is an essential step in the initiation of bacterial pathogenesis. It is already known that Actinomyces spp. can colonize the cervical surfaces and the gingival margin, contributing also to periodontal disease (Citation3, Citation4). Numerous adhesion factors have been studied and implicated in the virulence of these bacteria, especially for periodontal diseases. Bacteria express a diverse array of fimbriae that are involved in bacterial adherence (Citation29) and interbacterial adhesive interactions (Citation30). Fimbriae type 1 and type 2 may confer some advantage in the establishment of Actinomyces (Citation29). Different fimbriae-binding properties may explain the presence of Actinomyces in root sites. High expression of genes that code Type-2 fimbriae were found in both conditions, which relates to epithelial adhesion. Perhaps this confers advantages for Actinomyces adhesion in root surfaces (relationship with the gingival tissue) and also for the community biofilm co-adhesion. Also, collagen-binding protein was highly expressed and could be involved in the Actinomyces adhesion to root sites. It was previously demonstrated that the strains of Actinomyces that possess fimbriae exhibited strong binding to collagen. Therefore, the avidity of Actinomyces spp. for collagen would seem to be at least partially responsible for the high proportions of these organisms found on root surfaces sites (Citation31).
The role of this genus in root caries development or health maintenance may be potentially complex because its species could be capable of surviving in both sites by being able to adapt the metabolism and utilize the available substrate. Several stress-related genes were highly expressed in RC, which means that these species developed mechanisms to survive in that inhospitable environment. One of these mechanisms was the use of lactate as a carbon source. The acidic environment within carious lesions is unlikely to be homogenous despite lactic acid being the major organic acid present (Citation23). Lactate metabolism is an important pH regulating mechanism that facilitates the pH neutralization-producing propionate, acetate, CO2, and H2. Bacteria that utilize organic acids as their energy source may contribute to maintaining health by serving as an acid sink (Citation32). Lactate could be converted to pyruvate by NAD-independent lactate dehydrogenase and further to acetyl CoA by pyruvate dehydrogenase. It was demonstrated that A. naeslundii strains degrade lactate, aerobically, to acetate and CO2 through the conversion of lactate into pyruvate by a NAD-independent lactate dehydrogenase (Citation28). The results of this study showed that the lactate dehydrogenase was upregulated in SRS in Actinomyces OT178, A. naeslundii, A. johnsonii, A. gerencseriae, and A. oris C505. This mechanism may have implications for Actinomyces’ ability to preserve the pH homeostasis in root surfaces’ biofilm.
In conclusion, the results of the present study showed that Actinomyces metabolism is very high and very similar in both health and caries root surface samples. Actinomyces OT178 seems to have some specific functions in health-related biofilms. As determined by past evidence, which found a high prevalence of Actinomyces in both sound and root caries sites, these results indicate their presence as commensals but do not preclude them from contributing to cariogenicity through the expression of fimbriae components for adhesion, genetic mobility, and energy saving for sugar metabolism. However, it is important to point out that these functions in biofilms may be compensated by other non-Actinomyces species, and thorough gene expression analysis of the whole microbial community could help explain these interactions.
Conflict of interest and funding
The authors declare no potential conflicts of interest with respect to the authorship and/or publication of this article.
Supplementary Material
Download MS Word (1.4 MB)Acknowledgements
This study was developed in partnership with the University of Leeds and the Federal University of Rio Grande do Sul (UFRGS). Financial support was provided by Leeds Teaching Hospitals Charitable Foundation (R&D/PP/12011), the Dunhill Medical Trust (R245/0212), the Brazilian National Counsel of Technological and Scientific Development (CNPQ) (process no. 482504/2013-7), the Coordination for the Improvement of Higher Level Education (CAPES) (process no 18097-12-0), and the Rio Grande do Sul State Foundation for Research Support (FAPERGS) (process no. 001/2013–PQG). We are also grateful to the Department of Biochemistry of UFRGS and especially to Dr. Cristiane Matte, who kindly stored the samples used in this study.
Notes
To access the supplementary material to this article, please see Supplementary files under ‘Article Tools’.
Related Research Data
References
- Beck J. The epidemiology of root surface caries. J Dent Res. 1990; 69: 1216–21.
- Syed SA, Loesche WJ, Pape HL, Grenier E. Predominant cultivable flora isolated from human root surface caries plaque. Infect Immun. 1975; 11: 727–31.
- Sumney DL, Jordan HV. Characterization of bacteria isolated from human root surface carious lesions. J Dent Res. 1974; 53: 343–51.
- Socransky SS, Hubersak C, Propas D. Induction of periodontal destruction in gnotobiotic rats by a human oral strain of Actinomyces naeslundii . Arch Oral Biol. 1970; 15: 993–5.
- Jordan HV, Hammond BF. Filamentous bacteria isolated from human root surface caries. Arch Oral Biol. 1972; 17: 1333–42.
- Beighton D, Lynch E, Heath MR. A microbiological study of primary root-caries lesions with different treatment needs. J Dent Res. 1993; 72: 623–9.
- Emilson CG, Klock B, Sanford CB. Microbial flora associated with presence of root surface caries in periodontally treated patients. Scand J Dent Res. 1988; 96: 40–9.
- Emilson CG, Ravald N, Birkhed D. Effects of a 12-month prophylactic programme on selected oral bacterial populations on root surfaces with active and inactive carious lesions. Caries Res. 1993; 27: 195–200.
- Ellen RP, Banting DW, Fillery ED. Longitudinal microbiological investigation of a hospitalized population of older adults with a high root surface caries risk. J Dent Res. 1985; 64: 1377–81.
- Keltjens H, Schaeken T, van der Hoeven H, Hendriks J. Epidemiology of root surface caries in patients treated for periodontal diseases. Community Dent Oral Epidemiol. 1988; 16: 171–4.
- Van Houte J, Jordan HV, Laraway R, Kent R, Soparkar PM, DePaola PF. Association of the microbial flora of dental plaque and saliva with human root-surface caries. J Dent Res. 1990; 69: 1463–8.
- Nyvad B, Kilian M. Microflora associated with experimental root surface caries in humans. Infect Immun. 1990; 58: 1628–33.
- Preza D, Olsen I, Aas JA, Willumsen T, Grinde B, Paster BJ. Bacterial profiles of root caries in elderly patients. J Clin Microbiol. 2008; 46: 2015–21.
- Do T, Sheehy EC, Mulli T, Hughes F, Beighton D. Transcriptomic analysis of three Veillonella spp. present in carious dentine and in the saliva of caries-free individuals. Front Cell Infect Microbiol. 2015; 5: 25.
- Love M, Anders S, Huber W. Differential analysis of count data – the DESeq2 package. bioRxiv. 2014; 15: 550.
- Zeng L, Choi SC, Danko CG, Siepel A, Stanhope MJ, Burne RA. Gene regulation by CcpA and catabolite repression explored by RNA-Seq in Streptococcus mutans . PLoS One. 2013; 8: e60465.
- Schüpbach P, Osterwalder V, Guggenheim B. Human root caries: microbiota in plaque covering sound, carious and arrested carious root surfaces. Caries Res. 1995; 29: 382–95.
- Preza D, Olsen I, Willumsen T, Boches SK, Cotton SL, Grinde B, etal. Microarray analysis of the microflora of root caries in elderly. Eur J Clin Microbiol Infect Dis. 2009; 28: 509–17.
- Brown LR, Billings RJ, Kaster AG. Quantitative comparisons of potentially cariogenic microorganisms cultured from noncarious and carious root and coronal tooth surfaces. Infect Immun. 1986; 51: 765–70.
- Brailsford SR, Lynch E, Beighton D. The isolation of Actinomyces naeslundii from sound root surfaces and root carious lesions. Caries Res. 1998; 32: 100–6.
- Beighton D, Lynch E. Relationships between yeasts and primary root-caries lesions. Gerodontology. 1993; 10: 105–8.
- Benítez-Páez A, Belda-Ferre P, Simón-Soro A, Mira A. Microbiota diversity and gene expression dynamics in human oral biofilms. BMC Genomics. 2014; 15: 311.
- Peterson SN, Meissner T, Su AI, Snesrud E, Ong AC, Schork NJ, etal. Functional expression of dental plaque microbiota. Front Cell Infect Microbiol. 2014; 4: 108.
- Frias-Lopez J, Duran-Pinedo A. Effect of periodontal pathogens on the metatranscriptome of a healthy multispecies biofilm model. J Bacteriol. 2012; 194: 2082–95.
- Brailsford SR, Shah B, Simons D, Gilbert S, Clark D, Ines I, etal. The predominant aciduric microflora of root-caries lesions. J Dent Res. 2001; 80: 1828–33.
- Takahashi N, Kalfas S, Yamada T. Phosphorylating enzymes involved in glucose fermentation of Actinomyces naeslundii . J Bacteriol. 1995; 177: 5806–11.
- van Houte J, Lopman J, Kent R. The predominant cultivable flora of sound and carious human root surfaces. J Dent Res. 1994; 73: 1727–34.
- Takahashi N, Yamada T. Glucose and lactate metabolism by Actinomyces naeslundii . Crit Rev Oral Biol Med. 1999; 10: 487–503.
- Mishra A, Wu C, Yang J, Cisar JO, Das A, Ton-That H. The Actinomyces oris type 2 fimbrial shaft FimA mediates co-aggregation with oral streptococci, adherence to red blood cells and biofilm development. Mol Microbiol. 2010; 77: 841–54.
- Ruhl S, Eidt A, Melzl H, Reischl U, Cisar JO. Probing of microbial biofilm communities for coadhesion partners. Appl Environ Microbiol. 2014; 80: 6583–90.
- Liu T, Gibbons RJ, Hay DI, Skobe Z. Binding of Actinomyces viscosus to collagen: association with the type 1 fimbrial adhesin. Oral Microbiol Immunol. 1991; 6: 1–5.
- Gross EL, Leys EJ, Gasparovich SR, Firestone ND, Schwartzbaum JA, Janies DA, etal. Bacterial 16S sequence analysis of severe caries in young permanent teeth. J Clin Microbiol. 2010; 48: 4121–8.