
Abstract
Background
Estimation of food portion sizes has always been a challenge in dietary studies on free-living individuals. The aim of this work was to develop and validate a food photography manual to improve the accuracy of the estimated size of consumed food portions.
Methods
A manual was compiled from digital photos of foods commonly consumed by the Tunisian population. The food was cooked and weighed before taking digital photographs of three portion sizes. The manual was validated by comparing the method of 24-hour recall (using photos) to the reference method [food weighing (FW)]. In both the methods, the comparison focused on food intake amounts as well as nutritional issues. Validity was assessed by Bland–Altman limits of agreement. In total, 31 male and female volunteers aged 9–89 participated in the study.
Results
We focused on eight food categories and compared their estimated amounts (using the 24-hour recall method) to those actually consumed (using FW). Animal products and sweets were underestimated, whereas pasta, bread, vegetables, fruits, and dairy products were overestimated. However, the difference between the two methods is not statistically significant except for pasta (p<0.05) and dairy products (p<0.05). The coefficient of correlation between the two methods is highly significant, ranging from 0.876 for pasta to 0.989 for dairy products. Nutrient intake calculated for both methods showed insignificant differences except for fat (p<0.001) and dietary fiber (p<0.05). A highly significant correlation was observed between the two methods for all micronutrients. The test agreement highlights the lack of difference between the two methods.
Conclusion
The difference between the 24-hour recall method using digital photos and the weighing method is acceptable. Our findings indicate that the food photography manual can be a useful tool for quantifying food portion sizes in epidemiological dietary surveys.
The accuracy of data collected in dietary surveys is fundamental for assessing nutritional status and analyzing the relationship between diet and a population's health status (Citation1). Traditional dietary surveying techniques used to quantify food intake can be classified into two categories: 1) those in which foods are weighed directly, commonly called the ‘food weighing’ (FW) method and 2) those in which the ingested food amount is estimated by methods such as food history, 24-hour recall, and recording the amount of food (Citation2). The most accurate method for measuring food intake is weighing foods before and after eating (Citation3). However, weighing each food item can introduce changes in eating habits. In practice and in epidemiological studies, FW is very difficult to use with a large sample of people and does not permit assessment of past intakes (Citation4, Citation5). Therefore, the data collected by FW may be unrepresentative of the usual diet of the subject. Dietary survey methods based on questioning or recording are faced by considerable difficulty in estimating quantities (Citation6). The use of scales may minimize the error of portion size estimation when measuring food consumption using the methods mentioned above, outside weighing (Citation7). Assessment of the amount of food consumed should then rely on the subject's ability to describe his or her consumption.
Visual aids used to help subjects remember and describe the food amounts include portion size models, replicate food models, household measures, and photographs (Citation8). A number of studies have reported the benefits of using photographs to help subjects assess portion sizes (Citation9–Citation16).
Food photographs depicting standardized portion sizes organized in an atlas are helpful in improving the accuracy of food quantification (Citation17, Citation18). The number and size of photographs vary from one to eight among studies. The authors concluded that increasing the number of photographs per food may help improve reporting accuracy. In Africa, the validity of using food photographs for estimation of portion size has been tested in South Africa (Citation19, Citation20) and Burkina Faso (Citation21).
The aim of this study was to develop and validate a modified 24-hour recall method with a manual of food photographs (FP 24-hR), depicting standard portion sizes of the foods commonly consumed in Tunisia in order to improve the estimation of consumed portions in food surveys such as food history, 24-hour recall, and recording the amount of food.
Materials and methods
Development of the food manual
Typical Tunisian dietary foods were chosen with reference to a number of epidemiologic studies (Citation22–Citation24). The aim was to include a wide range of foods that require some aid to assess portion sizes in a questionnaire and to span the selected visual appearance which is likely to influence perception of amounts from photos.
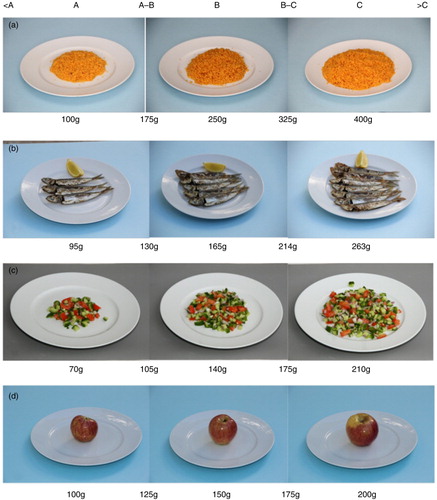
Construction of the food photography manual involved cooking, weighing, and taking digital photographs of three different portion sizes: small (A), medium (B), and large portion (C). Foods that needed to be cooked (vegetables, pasta, meat, fish, etc.) were weighed before and after cooking. Two types of scales of different capacity were used to weigh the different portions (a precision scale Chimazou, BW 420 H with a precision of 0.001 g and a maximum capacity of 420 g, and a Daewoo DKS 2055 scale with a precision of 1 g and a maximum capacity of 5,000 g). Digital photographs of three identified portions were taken under standard lighting conditions in a room by a professional photographer using a digital camera (Canon (R) 40 D Lens, Canon 70–200 mm). The three portion sizes considered to be representative of the range of portion sizes actually consumed (Citation22–Citation24) were placed on a white dining plate (26 cm in diameter) in a colored background contrast. All photographs were taken at approximately the same angle of 45° and from a distance of 50 cm above the plate, which was considered the best compromise between showing the depth and height of the food (Citation25). This technique, sitting at a table, is necessary to show the differences between the size of the portions depending on the height of the food on a plate and depth in a soup bowl (Citation15). This offers the best compromise by showing the size and the depth of the portion, the number and size of items, size and slice thickness, depth in a bowl, etc. These appearance characteristics are likely to influence the perception of portion sizes (Citation26–Citation28).
The 400 photos in the manual cover eight food groups: bread, cereals (including pasta, rice, couscous); potatoes, vegetables (raw and cooked); fresh fruits, animal products (meat and meat products, fish and fish products, eggs); dairy products (milk, cheese); and sweet products. Each page of the manual presents three sets of three pictures of three different foods. Portion sizes were placed in ascending order. shows an example of photographs from the manual. Each food was presented in three portion sizes: small, medium and large (labelled A, B, and C, respectively) that are considered representative of the Tunisian population consumption. But an incorporated scale enables the person to select intermediate sizes as well, giving a total of seven portion sizes: <A, A, A–B, B, B–C, C, and >C. The actual weight of the portions of raw or cooked food was presented in the appendix of the manual. This manual has the advantage of being the first to represent a wide list of foods usually consumed by the Tunisian population, for which a visual aid to estimate portion sizes is necessary (Citation6, Citation7). The photographs were designed to help estimate the amount of foods consumed the previous day by the 24-hour recall method.
Fig. 1 Example of photographs from the photos manual shows portion sizes of food and the amounts in grams. (a) Couscous, (b) fish, (c) fresh vegetables, (d) apples.
Subjects and study design
Thirty-one volunteers of both sexes in the Cap-Bon Governorate (Bouargoub town) were invited to participate in the study. A nutritionist from the same region visited the participants in their homes and explained the procedure of the study and its purpose, explaining that the aim was to assess the usual dietary intake of the participants by the FW method but without indicating that the portion sizes of the foods consumed would also be evaluated on the next day. Their participation depended on their willingness to be followed closely for 1 day during the preparation and consumption of their meals.
Data collection took place for 2 consecutive days. On the first day, participants received the investigator at home during the preparation and consumption of three main meals. The dietary survey technique used to estimate nutrient intake was FW, which was considered as the reference method (Citation3). For each meal, the amount of foods consumed by each individual was recorded and weighed by the trained dietician at the time of serving. If any food was left over, the weight was recorded, and the amount of food eaten was calculated as the difference between the amount served and the amount left. In the case of mixed meals, the raw ingredients used in their preparation were weighed (±0.1 g). The final total weight of the mixed dish was weighed using a second scale with greater capacity (5,000±1 g). Besides, the investigator measured the height and weight of the participants. The body mass index (BMI) was computed as weight (kg)/height squared (m2) and evaluated using the World Health Organization classification (Citation29).
On the following day, the investigator conducted a modified 24-hour recall (FP 24-hR) to estimate the amount of food consumed by the participants the day before. The participants were asked to recall the food intake during the preceding day. For each food, they were asked to mark a cross on the manual photos that they believed represented most closely the size of the portion they had consumed.
Food and nutrient intake
The dietary intakes of participants estimated by the FP 24-hR using the photographic manual and the FW method were transformed into key macro and micronutrients using the BILNUT software.
Statistical analysis
To validate the FP 24-hR method, we used three tests:
The differences between amounts in portion sizes of food categories weighed and estimated were tested using Wilcoxon signed rank test (data not normally distributed), and differences between nutrient intake estimated by FP 24-hR and FW were tested using paired t-test.
Pearson's or Spearman's rank correlation coefficients were calculated to assess the association between the weighed and estimated amounts of food (Spearman) and also nutrient intake (Pearson).
Agreement between the two methods was evaluated according to Bland–Altman analysis (Citation30). The mean differences of food amounts and nutrients intake between the two methods were plotted against their average value, and the 95% limits of agreement and the 95% confidence interval (CI) were marked.
Results
Participants
Thirty-one volunteers (14 women and 17 men) were surveyed. Participants were aged between 9 and 89 (mean: 33.6±14.5 years). Of the 31 participants, 22.6% were aged 9–17 and 77.4% were aged 18–89. The BMI of children and adolescents was 24.1±2.2 kg/m2. According to Cole's cutoff point reference values (Citation31), 43.8 and 14.2% of children were overweight and obese, respectively. The BMI of adults was 25.7±4.9 kg/m2 (24.7±3.1 and 26.3±5.8, for males and females, respectively). Nevertheless, 11.1% of males and 13.3% of females were overweight (25 ≤ BMI < 30) and 11.1% of males and 40% of females are obese (BMI ≥ 30). For the whole sample, prevalence of overweight and obesity was 12.5 and 29.1%, respectively.
Comparison of estimated and actual dietary intake
All the 31 participants successfully completed the FP 24-hR and FW. The overall assessments were grouped in the following eight major food categories: animal products (meat and meat products, fish and fish products, and eggs); vegetables (raw and cooked), potatoes; fruits (fresh); bread, pasta, dairy products (milk and dairy products); and sweet products.
The amounts of food (mean and standard deviation) estimated by FP 24-hR and actually consumed (FW) and the differences in the means are presented in . All food categories were overestimated (ranged from 2.2% for dairy products to 18.6% for pasta), but animals products and sweet products were underestimated by 9.9 and 4.5%, respectively. Statistical analysis by paired t-test series shows that the differences between the amounts estimated by FP 24-hR and those weighed were not statistically significant, except for pasta (p<0.01) and dairy products (p<0.05). The correlation coefficient was calculated to study the relationship at the individual level between the estimated and the actually consumed amounts. A highly significant correlation (p<0.001) was observed for all food groups (). The value of r ranged from 0.882 (potatoes) to 0.989 (dairy products). The agreement between the estimated and the weighed amounts for the eight food groups was assessed by Bland–Altman analysis. The Bland–Altman plots for mean daily intakes for three of the major food groups (meat, vegetables, and fruits) are presented in . Overall, these plots indicate acceptable agreement between the two methods for assessment of dairy products, potatoes, and sweet products. Poorer agreement was observed for bread, pasta, vegetables, and fruits.
Fig. 2 Bland–Altman plots for estimated and weighed food amounts. (a) Meat, (b) vegetables, (c) fruits.
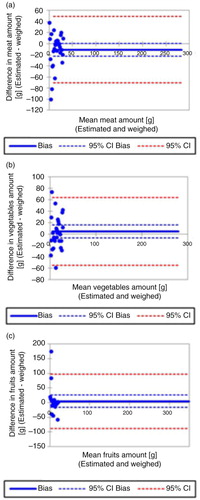
Table 1 Amount of food estimated by FP 24-hR and compared with amount weighed in FW
Comparison of estimated and actual nutrient intake
The means of the estimated and the actually consumed amounts of energy, protein, fat, carbohydrates, dietary fiber, vitamin B1, vitamin C, vitamin E, folate, calcium, iron, and zinc are presented in . The average differences between the recall and weighing methods were negative for lipids (−8.2%), zinc (−11.1%), vitamin B1 (−2.4%), and vitamin E (−11.6%). The differences were positive for protein (0.43%), carbohydrate (6.5%), fiber (9%), and vitamin C (3.6%). The differences vary insignificantly from −11.6% for vitamin E intake to 9% for fiber intake. Significant differences were observed for lipid (p<0.01) and fiber intake (p<0.05). Correlation coefficients for the estimates of nutrient intakes between the two methods are presented in . We observed a highly significant correlation between the estimated and weighed nutrient intakes. The value of the correlation coefficient ranged from 0.644 (folate) to 0.985 (vitamin B1). In order to assess the agreement between the methods for all nutrients, Bland–Altman analysis was performed as shown in (for protein, fat, and carbohydrate). The Bland–Altman plot for carbohydrate indicated broad limits of agreement. In addition, the difference in the estimates of carbohydrate intakes between FP 24-hR and FW became progressively greater with higher mean intakes (). As illustrated in , like carbohydrate intake, the difference in estimates of total protein (g) and fiber (g) intakes between the two methods became progressively greater with higher mean intakes. Poor levels of agreement between the methods were observed for the macronutrients. The mean correlation coefficient for nutrient intake between the two methods was 0.90. Correlations varied from 0.889 (protein) to 0.943 (carbohydrate). For micronutrients, correlation coefficients were low for folate (0.644) and high for vitamin B1 (0.985). The majority of the measurements of calcium, iron, and vitamin E were scattered along the equality line. The Bland–Altman plots demonstrated an acceptable level of agreement between the two methods.
Fig. 3 Bland–Altman plots for estimated and weighed food amount. (a) Protein, (b) fat, (c) carbohydrate.
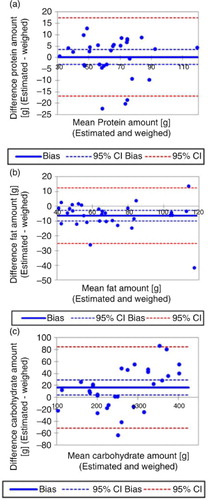
Table 2 Mean nutrient intake and comparison of the results obtained with the FP 24-hR and FW methods
Discussion
The aim of this work was to develop and validate a Tunisian food photography manual. This manual could be used as a visual aid to improve the accuracy of the estimation of food quantities consumed by surveyed individuals. This food photography manual has the advantage of being the first to represent a wide list of foods usually consumed by the Tunisian population and requiring a visual aid for estimating portion sizes. Many studies have shown interest in using food photography to reduce the errors in estimating the quantities of consumed foods (Citation27, Citation32) (Citation33). However, it is of utmost importance to validate the photographic manual and to determine the presence or absence of bias and its direction when estimating food amounts. Comparison of the amount of consumed food estimated by the FP 24-hR method and weighing method showed that the mean differences between the two methods were not significant for all food groups, except for pasta (18.6%) and dairy products (2.2%) (p<0.05). Some researchers (Citation15, Citation34) reported that the portion size of some foods seems to be more difficult to estimate accurately than others. De Souza et al. indicated that it was easier to estimate the portions of food that are part of the food habit (Citation35). Associations between the estimated quantities and weights were highly significant (0.876 < r<0.989, p<0.001) for all foods. The consistency between portion weights and estimated portion sizes of the foods eaten is revealed by the high mean correlation coefficients. Regarding nutritional intake, the average differences between the two methods ranged from −11.6 (vitamin E) to 8.9% (fibers). These average differences in dietary intake were not statistically significant. On the contrary, the estimate of food and nutrient intakes estimated by the recall of 24 hours with photos is highly correlated with the actually consumed amounts. These results are consistent with those found in the literature (Citation13, Citation15) (Citation27, Citation28).
In and , the Bland–Altman method was used to evaluate the difference between the two methods. The approach involves linearly regressing the difference depending on the average. Almost all of the points are in a band of plus or minus double the standard deviation of the straight equality of means. Bland–Altman analysis shows that most measures of categories of foods and nutritional intake are scattered on either side of the mean differences and all along the line of equality (difference=0). Our data analyses of individual food categories and nutrients intake show that the FP 24-hR was able to adequately estimate the weights of food portions and gave results that are comparable to the actually consumed amounts (FW).
The number and size of the photos used to estimate portion sizes vary from one study to another, from one to eight (Citation27). It has been shown that the greater the number of serving size categories, the smaller the estimation error (Citation36). A complex process is triggered when using photographs to identify the portion size of food during a food interrogation. This process includes three elements: perception, conceptualization, and memory. These three elements depend on the number of different portion sizes, location in the manual, the size of each photo, and some characteristics of the respondents (gender, age, body size, etc.) (Citation13, Citation37). However, a study in South Africa (Citation18) showed that accuracy of estimation was not affected by sex, age, or education. The estimated size of the portions was not influenced by sex and BMI of the individuals and that it was easier to estimate the portions of food that are habitual (Citation35). In a dietary study using the 24-hour recall method, two main tasks are required by the subject in estimating portion size: 1) memory of the foods eaten and 2) conceptualization (i.e. the ability to translate an abstract mental impression of an amount eaten into an amount depicted in a photograph) (Citation28). More recently, portion size photographs have also been developed to be used on a computer screen. Recent studies have reported that the photos taken by the participants themselves when food intake occurs in many environments, for example, cafes and restaurants, can improve the accuracy of collected data (Citation38–Citation40). These images are then compared with images of ‘standard’ portions of food using computer software. The amount of food is estimated on the basis of this comparison and the application automatically calculates the energy and nutrient intake. This use of digital photography has the advantage of reducing the burden on participants when estimating portion sizes. But it does not exclude the need for a manual of standards for evaluating the photographed portion sizes and those consumed by the subjects (Citation41, Citation42). In Tunisia, no such tools for assessing dietary intake have been published yet.
Possible limitations of the present study are the small number of participants (which affects the power of the statistical tests), wide age range, and the simplicity of the examined menus. Such limits may explain the high correlations and low differences between the results of the two methods. One possible reason for the poor agreement is that respondents might be less able to conceptualize portion sizes and are less practiced in estimating measures. The validation method bears international relevance for individual-level dietary assessment, because it is one of the few studies that have used measures of agreement to test a photographic atlas for this purpose under ‘real’ field conditions. The interest of this study is that it was conducted under the conditions of normal living on a population sample that is heterogeneous regarding sex, age, and BMI. Therefore, the food consumption of the participants can be considered as representative of their usual consumption. Our study may be the first using photographs to assess nutrient intake in free-living conditions in Tunisia. Several aspects should be addressed in future.
Conclusion
In this study, we constructed and validated a food photography manual. It appears to be a useful tool for portion size estimation of the common foods in the Tunisian diet. The analysis of data of food and nutrient intake shows that 24-hour recall with the use of food photos yields results that are comparable to those obtained by FW. The 24-hour recall method in combination with food photos will minimize the food portion size estimation error. Therefore, this food photography manual can be used as a standard basis for dietary surveys to estimate the amounts of consumed food. It is a better alternative for obtaining an accurate and representative estimation of the current or usual nutrient intake in large-scale dietary surveys in Tunisia. Further work to develop and test sets of food photographs for use in different areas and population groups in the Mediterranean region and Africa is needed.
Authors' contributions
Mongia Bouchoucha contributed to the formulation of the research, the study design, and writing the article. Fadwa Tarhouni and Rim Bouchoucha performed the food survey: 24-hour recall method and FW. Mouna Akrout and Béchir Zouari contributed to the formulation of the research and analyzed the data. Abderraouf Ben Mansour and Hédia Bellali helped to analyse data and reviewed the paper.
Conflict of interest and funding
No conflict of interest to declare. The authors have not received any funding or benefits from industry or elsewhere to conduct this study.
Ethical standards disclosure
This study was conducted according to the guidelines laid down in the Declaration of Helsinki, and all procedures involving human subjects/patients were approved by the Ethic Committee of Abderrahman Mami Hospital, Ariana, Tunisia. Verbal informed consent was obtained from all subjects: verbal consent was not formally recorded.
References
- Gibson R. Principles of nutritional assessment. 2nd ed. 2005; New York: Oxford University Press.
- Nelson M. BM Margetts, M, Nelson. The validation of dietary questionnaires. Design concepts in nutritional epidemiology. 1991; Oxford: Oxford University Press. 266–96.
- Wolper C, Heshka S, Heymsfield SB. A, Allison. Measuring food intake: an overview. Handbook of assessment measures for eating behaviours and weight-related problem. 1995; Thousand Oaks, CA: Sage. 215–40.
- Nelson M, Bingham SA. BM Margetts, M, Nelson. Assessment of food consumption and nutrient intake. Design concepts in nutritional epidemiology. 1997; Oxford: Oxford University Press. 123–69.
- Bingham SA. Limitations of the various methods for collecting dietary intake data. Ann Nutr Metab. 1991; 35: 117–27.
- Ben Mansour A, Akrout M, Gharbi M, Abid A, Chabchoub-Blouza S, Zouari B, etal. Dietary assessment: limits of the 24 hour recall method. Méd Nut. 1997; 5: 194–8.
- Akrout M, Gharbi M, Ben Mansour A, Ben Ali B, Nagati K, Zouari B. Difficulties in the approach of the alimentary consumption in Tunis hospitals. Tun Méd. 1998; 76: 250–3.
- Chambers Iv E, Godwin SL, Vecchio FA. Cognitive strategies for reporting portion sizes using dietary recall procedures. J Am Diet Assoc. 2000; 100: 891–7.
- Hankin JH, Nomura AM, Lee J, Hirohata T, Kolonel LN. Reproducibility of a diet history questionnaire in a case-control study of breast cancer. Am J Clin Nutr. 1983; 37: 981–5.
- Kim J, Lee HJ, Lee HJ, Lee SH, Yun J-Y, Choi M-K, etal. Energy content estimation by collegians for portion standardized foods frequently consumed in Korea. Clin Nutr Res. 2014; 3: 24–32.
- Pietinen P, Hartman AM, Haapa E, Räsänen L, Haapakoski J, Palmgren J, etal. Reproducibility and validity of dietary assessment instruments. I. A self-administered food use questionnaire with a portion size picture booklet. Am J Epidemiol. 1988; 128: 655–66.
- Pietinen P, Hartman AM, Haapa E, Räsänen L, Haapakoski J, Palmgren J, etal. Reproducibility and validity of dietary assessment instruments. II. A qualitative food frequency questionnaire. Am J Epidemiol. 2005; 128: 667–76.
- Turconi G, Guarcello M, Berzolari FG, Carolei A, Bazzano R, Roggi C. An evaluation of a colour food photography atlas as a tool for quantifying food portion size in epidemiological dietary surveys. Eur J Clin Nutr. 2005; 59: 923–31.
- Haraldsdottir J, Tjonneland A, Overvad K. Validity of individual portion size estimates in a food frequency questionnaire. Int J Epidemiol. 1994; 23: 786–96.
- Nelson M, Atkinson M, Darbyshire S. Food photography. I: the perception of food portion size from photographs. Br J Nutr. 1994; 72: 649–63.
- Nelson M, Atkinson M, Darbyshire S. Food photography II: use of food photographs for estimating portion size and the nutrient content of meals. Br J Nutr. 1996; 76: 31–49.
- Hernández P, Morón M, Velazco Y, Oráa E, Bernal J, Mata C. Development of a photographic atlas of Venezuelan food portions. Rev Esp de Nutr Hum Diet. 2015; 19: 68–76.
- Bernal-Orozco MF, Vizmanos-Lamotte B, Rodríguez-Rocha NP, Macedo-Ojeda G, Orozco-Valerio M, Rovillé-Sausse F, etal. Validation of a Mexican food photograph album as a tool to visually estimate food amounts in adolescents. Br J Nutr. 2013; 109: 944–52.
- Venter CS, MacIntyre UE, Vorster HH. The development and testing of a food portion photograph book for use in an African population. J Hum Nutr Diet. 2000; 13: 205–18.
- Korkalo L, Erkkola M, Fidalgo L, Nevalainen J, Mutanen M. Food photographs in portion size estimation among adolescent Mozambican girls. Public Health Nutr. 2013; 16: 1558–64.
- Huybregts L, Roberfroid D, Lachat C, Van Camp J, Kolsteren P. Validity of photographs for food portion estimation in a rural West African setting. Public Health Nutr. 2008; 11: 581–7.
- Gharbi M, Akrout M, Zouari B. Trends in nutritional and health status in Tunisia since 1965. Méd Nut. 2005; 41: 29–37.
- Gharbi M, Bel Hani A, Aouidet A, Akrout M, Nasraoui A, Tritar B. Dietary intake in the urban and rural populations of the Cap-Bon. Rév Epidémiol Santé Publique. 1998; 46: 164–75.
- Gharbi M, Bel Hani A, Aouidet A, Ben Rayana C, Achour A, Nasraoui A, etal. Cardiovascular risk factors in the urban and rural populations of the Cap-Bon: Tunisia. Rev Epidémiol Santé Publique. 1996; 44: 125–32.
- Harris-Fry H, Paudel P, Karn M, Mishra N, Thakur J, Paudel V, etal. Development and validation of a photographic food atlas for portion size assessment in the southern plains of Nepal. Public Health Nutr. 2016; 21: 1–13.
- Nelson M, Haraldsdottir J. Food photographs: practical guidelines I. Design and analysis of studies to validate portion size estimates. Public Health Nutr. 1998; 4: 219–30.
- Lazarte CE, Encinas ME, Alegre C, Granfeldt Y. Validation of digital photographs, as a tool in 24-h recall, for the improvement of dietary assessment among rural populations in developing countries. Nutr J. 2012; 11: 1–14.
- Nelson M, Haraldsdottir J. Food photographs: practical guidelines II. Design and analysis of studies to validate portion size estimates. Public Health Nutr. 1998; 1: 231–7.
- World Health Organization (WHO). Use and interpretation of anthropometric indicators of nutritional status. Bull World Health Organ. 1986; 64: 929–41.
- Bland JM, Altman DJ. Statistical methods for assessing agreement between two methods of clinical measurements. Lancet. 1986; 8: 307–10.
- Cole TJ, Bellizzi MC, Flegal KM, Dietz WH. Establishing a standard definition for child overweight and obesity worldwide: international survey. BMJ. 2000; 320: 1240–3.
- Martin CK, Han H, Coulon SM, Allen HR, Champagne CM, Anton SD. A novel method to remotely measure food intake of free-living individuals in real time: the remote food photography method. Br J Nutr. 2009; 101: 446–56.
- Tueni M, Mounayer A, Birlouez-Aragon I. Development and evaluation of a photographic atlas as a tool for dietary assessment studies in Middle East cultures. Publ Health Nutr. 2012; 15: 1023–8.
- Amougou N, Cohen E, Mbala ML, Grosdidier B, Bernard JY, Saïd-Mohamed R, etal. Development and validation of two food portion photograph books to assess dietary intake among adults and children in Central Africa. Br J Nutr. 2016; 20: 1–8.
- De Souza RGM, Campos MIVAM, Cordeiro MM, Monego ET, Peixoto MRG. Validation of food's photographs for estimating the consumption food. Rev Nutr. 2016; 29: 415–24.
- Lombard M, Steyn N, Burger HM, Charlton K, Senekal M. A food photograph series for identifying portion sizes of culturally specific dishes in rural areas with oesophageal cancer. Nutrients. 2013; 5: 3118–30.
- Martin CK, Nicklas T, Gunturk JB, Correa JB, Allen HR, Champagne C. Measuring food intake with digital photography. J Hum Nutr Diet. 2014; 27: 72–81.
- Jia W, Chen HC, Yue Y, Li Z, Fernstrom J, Bai Y, etal. Accuracy of food portion size estimation from digital pictures acquired by a chest-worn camera. Public Health Nutr. 2014; 17: 1671–81.
- Naska A, Valanou E, Peppa E, Katsoulis M, Barbouni A, Trichopoulou A. Evaluation of a digital food photography atlas used as portion size measurement aid in dietary surveys in Greece. Public Health Nutr. 2016; 26: 1–8.
- Subar AF, Crafts J, Zimmerman TP, Wilson M, Mittl B, Islam NG, etal. Assessment of the accuracy of portion size reports using computer-based food photographs aids in the development of an automated self-administered 24-hour recall. J Am Diet Assoc. 2010; 110: 55–64.
- Foster E, Hawkins A, Simpson E, Adamson AJ. Developing an interactive portion size assessment system (IPSAS) for use with children. J Hum Nutr Diet. 2014; 27: 18–25.
- Gemming L, Utter J, Ni Mhurchu C. Image-assisted dietary assessment: a systematic review of the evidence. J Acad Nutr Diet. 2015; 115: 64–77.