Abstract
Background: Hydrogen peroxide (H2O2) is a common reactive oxygen intermediate generated by various forms of oxidative stress.
Aim: The aim of this study was to investigate the DNA damage capacity of H2O2 in HepG2 cells.
Methods: Cells were treated with H2O2 at concentrations of 25 µM or 50 µM for 5 min, 30 min, 40 min, 1 h, or 24 h in parallel. The extent of DNA damage was assessed by the comet assay.
Results: Compared to the control, DNA damage by 25 and 50 µM H2O2 increased significantly with increasing incubation time up to 1 h, but it was not increased at 24 h.
Conclusions: Our findings confirm that H2O2 is a typical DNA damage-inducing agent and thus is a good model system to study the effects of oxidative stress. DNA damage in HepG2 cells increased significantly with H2O2 concentration and time of incubation but later decreased likely due to DNA repair mechanisms and antioxidant enzymes.
Introduction
Oxidative DNA damage induced by reactive oxygen species (ROS) and free radicals is important in the pathogenesis of many human diseases, including cancer, muscle degeneration, coronary heart disease and ageing Citation1. ROS induce both cytotoxic and mutagenic damage Citation2. When the production of ROS and free radicals exceeds the antioxidant capacity of cellular antioxidants in a biological system, it leads to progression of degenerative diseases in human Citation3Citation4. Antioxidant enzymes such as superoxide dismutase convert the superoxide anion into H2O2, which is then converted by glutathione peroxidase and catalase into water Citation5. To prevent build-up of superoxide and oxidative damage in crucial tissues, a fine balance between the activity of these enzymes is necessary Citation6. Hydrogen peroxide (H2O2), one of the main ROS, is known to cause DNA damage in various cell types Citation7. Also, Caspase-3, a cysteine protease that is one of the effectors of apoptosis and necrosis, is activated by H2O2Citation8.
H2O2 is produced endogenously by several physiological processes, such as the inflammatory respiratory burst and during oxidative phosphorylation. H2O2 is a natural source of oxidative damage in cells, causing a spectrum of DNA lesions, including single and double strand breaks. DNA damage due to H2O2 results from production of the hydroxyl radical (·OH) in the presence of transition metal ions such as iron via the Fenton reaction, in which H2O2 is reduced in the presence of ferrous ions: H2O2+Fe2+→OH·+OH–+Fe3+Citation9.
Levels of DNA damage have been measured in HepG2 cells by using a single-cell gel electrophoresis technique known as the comet assay, which has rapidly become one of the most popular methods used in genetic toxicology. This method allows detection and quantification at the single-cell level of a variety of DNA lesions Citation10. Moreover, it can be used for almost any cell type. The comet assay, especially in its alkaline version, has been used to address a variety of questions, including DNA damage, DNA repair mechanisms of mutagenesis and ecogenotoxicological questions Citation11.
The purpose of this study was to investigate the susceptibility of HepG2 cells to oxidative DNA damage induced by different concentrations of H2O2 at different times of exposure.
1 Materials and methods
1.1 Chemicals
Comet lysis buffer (2.5 M sodium chloride, 100 mM EDTA (pH 8.0), 1% sarkosyl, 10 mM Tris–HCl (pH 8.0), 10% DMSO, 10% Triton X-100). Comet alkali solution (0.3 M sodium hydroxide, 1 mM EDTA). Comet neutralizing buffer (0.5 M Tris–HCl, pH 7.5). Cryopreservation medium (50% foetal calf serum [FCS], 10% DMSO, 40% Dulbecco's modified Eagle's medium [DMEM]). Resuscitation medium (50% FCS, 10% dextrose, and 40% DMEM). Culture medium for HepG2 cells (DMEM, 10% FCS, 50 U/ml penicillin, 50 U/ml streptomycin, 2 mM L-glutamine). All chemicals were purchased from Sigma Chemicals Co., Dorset, UK.
1.2 Cell culture
HepG2 cells were obtained from the European Cell Culture Collection (ECCC, UK). HepG2 cells are human Caucasian hepatocyte carcinoma cells taken from a primary hepatoblastoma (liver biopsy) from an 11-year-old male from Argentina in 1979. The frozen vials of the cells were held at room temperature for 1 min and then placed in a 37°C incubator for 1 min until thawed and the cells were pipetted into a flask containing 10 ml of pre-warmed DMEM. HepG2 cells were grown in DMEM supplemented with 10% FCS, 2 mM glutamine, 100 µg/ml penicillin and 100 µg/ml streptomycin. All cultures were done at 37°C in an atmosphere of 5% CO2. The cells were fed three times a week and split when confluence was reached. To split the cells, the medium was removed, the cells were washed with Hank's Buffered Salt Solution (HBSS), and then gently harvested with 1 ml detachment trypsin neutralising solution. Once all the cells were loosened from the plate, 1 ml of detachment trypsin neutralising solution was added. The cell suspension was pipetted into a sterile falcon tube and centrifuged at 1,200 rpm for 5 min. The supernatant was removed and the pellet was gently resuspended in an appropriate volume of medium. The cell suspension was placed in fresh culture flasks at a 1:2 split ratio.
1.3 Hydrogen peroxide (H2O2) treatment
Cells were plated in a multi-well plate: 1 ml at 5×10⁶ cells/ml in DMEM. Supplemented with 10% FCS, 2 mM glutamine, 100 µg/ml penicillin and 100 µg/ml streptomycin. The cells were allowed to attach for 24 h at 37°C. Then the medium was replaced by DEMEM containing 25 µM or 50 µM H2O2 and duplicate cultures were incubated at 37°C for 5 min, 30 min, 40 min, 1 h, or 24 h. At the end of incubation the cells were harvested and used in comet assay analysis of DNA damage.
1.4 Comet assay
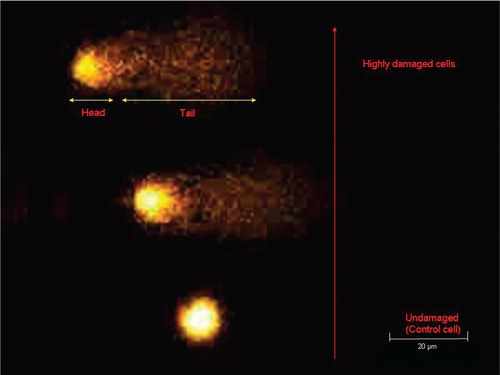
The principle of the comet assay is that smaller DNA molecules migrate faster in an electric field than larger molecules. The treated cells are encapsulated in gel and lysed by alkali, which also denatures the DNA. Subsequent electrophoresis causes migration of the DNA. While the undamaged DNA appears as a ‘head’, fragmented DNA move faster, giving the characteristic appearance of a comet tail ().
Figure 1. Levels of DNA damage after exposure to hydrogen peroxide evaluated by the comet assay.
illustrates the comet assay Citation12. This assay has been adapted from that originally proposed by Singh et al. Citation13. Partly frosted microscope slides were pre-coated with a smear of 1% low melting-point agarose (LMPA) and allowed to dry for 1 h at 37°C. The slides were then placed on a bed of ice to pre-cool them before adding an agarose sandwich. An aliquot of 170 µl of 1% LMPA was placed onto the slide and immediately covered with a coverslip. Whilst this was setting, 170 µl of the suspended lymphocytes were mixed 1:1 with 2% LMPA. The coverslip was then removed from the initial agarose layer. An aliquot of 170 µl of the agarose/lymphocyte mix was placed on top of the first layer and again covered immediately with a coverslip. Once set, the coverslip was removed and a final layer of 170 µl 1% LMPA was applied to the existing gel to form an agarose sandwich, with the cells in the middle layer. The final coverslip was removed once the gel had set. For each lymphocyte sample, two slides were prepared. At this point the lights were switched off and the remainder of the assay was performed using indirect light.
Figure 2. Flowchart showing the comet assay for single-cell gel electrophoresis to determine DNA damage (12).
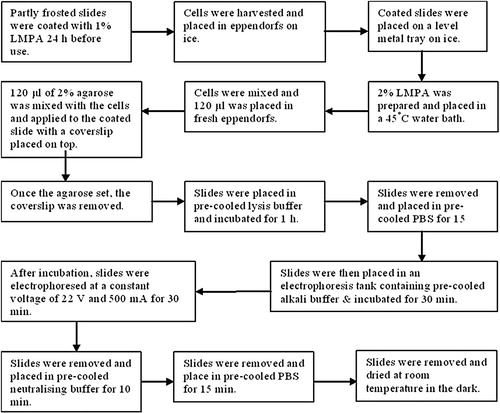
A pyrex tray containing 500 ml of ice-cold lysis buffer was placed onto a bed of ice and the slides were gently lowered into it. After 1 h, the slides were removed and washed by placing them in 500 ml ice-cold PBS (again in a pyrex tray on a bed of ice) and allowing them to sit for 15 min. This removed the salt from the lysis buffer and prepared the slides for the next step. A horizontal electrophoresis tank was surrounded by ice and filled with 2 l of ice-cold lysis buffer. Then the slides were gently lowered into a horizontal electrophoresis tank filled with 2 l of cold lysis buffer and surrounded by ice. The slides were placed for 30 min to allow the DNA to unwind in the alkali buffer. Electrophoresis was then performed at 22 V (500 mA) for 30 min. Next, the slides were removed and rinsed by placing them in 500 ml of ice-cold neutralising buffer for 10 min and then in 500 ml of ice-cold PBS for 15 min.
SYBR Gold dye was added to each slide to stain the DNA. DNA damage was measured using the comet assay and expressed as Olive Tail Moment (OTM). Results are given as mean±SEM for the 50 cells (25 per slide).
1.5 Cell viability
To determine cell viability Citation14, 100 µl of cell suspension was mixed 1:1 with trypan blue stain (0.4% w/v, Biowhittaker) and pipetted into a Neubauer haemocytometer (VWR Scientifics, West Chester, PA). If membrane integrity has been compromised (dead cells), the cells absorb the dye and appear blue. In our study, if cell viability <80%, the cells were discarded and a new batch was started. For the experiments we report, cell viability was 90–95% after culturing and before starting the comet assay.
1.6 Statistical analysis
Data are expressed as mean±SEM. One-way ANOVA was performed when more than two groups were compared with a single control. Differences between individual groups were assessed by a Dunnett post hock test, using Prism software (version 4).
1.7 Scoring DNA damage
The slide was visualised using either a BioRad MRC 600 confocal microscope or a Leica TCS SP2 UV confocal microscope. Images were obtained with the BioRad using a Krypton/Argon laser, 20× magnification, and excitation wavelength at 568 nm, lens aperture of 0.4 and z series slices of 3-µM steps. Images were obtained with the Leica using a 543 Helium/Neon (He/Ne) laser at 55% power and 20× magnification, and the emission was collected using a detection window of 570–655 nm wavelength. Twety-five images per slide were captured. Images were analysed using the kinetic Komet version 5.5 software.
2 Result
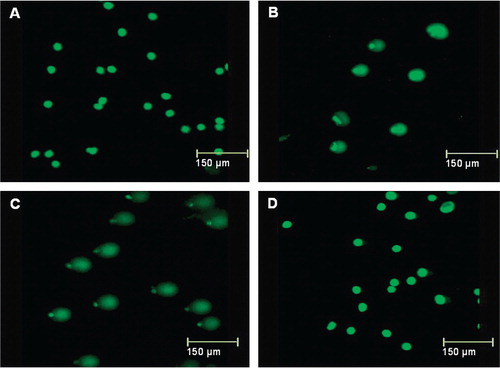
We treated HepG2 cells with different concentrations of H2O2 for different durations. Cell viability following different treatments was 90–95% and no floating cells were noticed in the medium. We analysed DNA damage by the comet assay. Following single-cell electrophoresis, the lengths of the comets (DNA trails) depended on the treatment, with longer tails indicating more DNA damage. shows representative examples for treatment with 50 µM H2O2. Untreated control cells showed no tails (A). Tails were evident after 5 min of H2O2 treatment (B) and were substantially longer after 1 h of treatment (C). However, cells incubated with H2O2 for 24 h appeared similar to untreated control cells (D). A similar pattern was observed for treatment with 25 µM H2O2.
Figure 3. Comet assay of the effect of duration of incubation with hydrogen peroxide on DNA damage: untreated HepG2 cells (A) and HepG2 cells treated with 50 µM H2O2 for 5 min (B), 1 h (C) or 24 h (D). Longer tails indicate more damage.
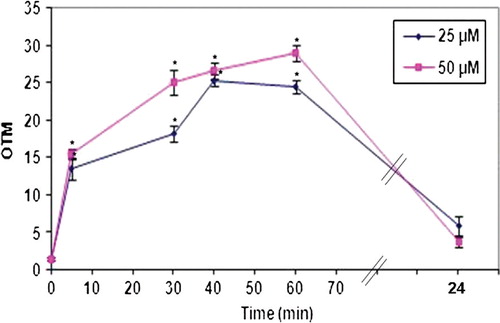
The extent of DNA damage, measured in OTM, increased rapidly and significantly (p<0.001) from baseline levels of 1.4 OTM±0.2 SEM to 13.4±1.3 OTM after 5 min of treatment with 25 µM H2O2 and 15.5±0.6 OTM after 5 min of treatment with 25 µM H2O2 (). The extent of damage increased further with time but at a slower rate, reaching about 25–30 OTM after 1 h of treatment. However, at the 24-h time-point the values for treatment with 25 and 50 µM H2O2 (5.9±1.3 and 3.7±0.6 OTM, respectively) were not significantly higher than the baseline levels. The extent of DNA damage was higher for cells treated with 50 µM H2O2 than for those treated with a 25 µM concentration at the 5, 30, 40 and 60 min time-points ().
Figure 4. Dose and time dependence of the extent of DNA damage. HepG2 cells were treated with 25 µM or 50 µM H2O2 for 5, 30, 40 min, 1 h or 24 h and DNA damage was assessed by the comet assay. Damage is expressed in olive tail moment (OTM). The values are the mean±SEM of 50 cells from two pooled wells (25 cells per slide). * p<0.001 (One-Way ANOVA) compared to control.
3 Discussion
When formation of ROS exceeds the biological defence capacity, the result is oxidative stress and tissue injury Citation15. H2O2 can cause oxidative stress because it uses water channels (aquaporins) to rapidly cross-cell membranes Citation20, reach the nucleus and cause damage to DNA by generating hydroxyl-free radicals (OH·) Citation21. These radicals attack DNA at the sugar residue of the DNA backbone, leading to single strand breaks. They also modify purines and pyrimidines to their hydroxyl derivatives, such as 8-hydroxyguanine Citation16.
One study examined DNA damage resulting from treatment of cultured human leukocytes with H2O2 concentrations of 25, 50, 100 and 200 µM for 4 h. DNA damage, assessed by the comet assay, increased significantly with increasing dose Citation17. In our study, we treated HepG2 cells with 25 µM or 50 µM H2O2 for different durations: 5 min, 30 min, 40 min or 1 h. DNA damage was both dose and duration dependent. DNA damage increased with increasing time of incubation with H2O2, but only between 5 and 60 mins of incubation. After 24 h of incubation with H2O2, the extent of DNA damage was not different from that in control cells, quite likely due to the action of DNA repair mechanisms. As we did not use incubation times longer than an hour but shorter than 24 h, we do not know at what time point the effects of such repair mechanisms became evident. However, a similar study on colonocytes Citation18 showed that at a H2O2 concentration of 15 mM the DNA damage was reduced when incubation times were >30 min. Similarly, treatment of human lymphocytes with 20 µM H2O2 for 5 min induced DNA damage but incubation of the cells for 2 h led to a considerable decrease in DNA damage Citation19. Based on these reports we suggest that DNA damage in our setup starts to decrease shortly after 1 h of incubation.
In conclusion, the extent of DNA damage was dose-dependent and incubation time-dependent. DNA damage increased with time but later decreased, likely due to metabolism of H2O2 to water and the effects of DNA repair. HepG2 cells were susceptible to induction of DNA damage by low doses of H2O2.
4 Conflict of interest and funding
The authors have not received any funding or benefits from industry to conduct this study.
Related Research Data
References
- Dong-Hyun L, Timothy R, Gred P. Oxidative DNA damage induced by copper and hydrogen peroxide promotes CG–TT tandem mutations at methylated CpG dinucleotides in nucleotide excision repair-deficient cells. Nucleic Acids Res. 2002; 30: 3566–73.
- Cadet JD, Douki T, Gasparutto T, Pouget D, Ravanat JP, Sauvaigo JL. Hydroxyl radicals and DNA base damage. Mutat Res. 1999; 424: 9–21.
- Kleiman NJ, Wang RR, Spector A. Hydrogen peroxide-induced DNA damage in bovine lens epithelial cells. Mutat Res. 1990; 240: 35–45.
- Subhashinee SK, Wijeratne LC, Vikcy S. Hydrogen peroxide induced oxidative stress damage and antioxidant enzyme response in Caco-2 human colon cells. J Agric Food Chem. 2005; 53: 8768–74.
- Davies K. Oxidative stress, antioxidant defenses and damage removal, repair and replacement systems. IUBMB Life. 2000; 50: 279–89.
- Jornot PH, Junod A. Hydrogen peroxide-induced DNA damage is independent of nuclear calcium but dependent on redox-active ions. Biochem J. 1998; 335: 85–94.
- Sun-Yee K, Ryung-Hyo K, Tae-Lin H, Jeen-Woo P. α-Phenyl-N-t-butylnitrone protects oxidative damage to HepG2 cells. J Biochem Mol Biol. 2000; 34: 43–6.
- Piperakis M, Karanastasi G, Lakovidou-Kritsi Z, Piperakis M. The use of comet assay in measuring DNA damage and repair efficiency in child, adult, and old age populations. Cell Biol Toxicol. 2009; 25: 65–71.
- Collins A. Oxidative DNA damage, antioxidants, and cancer. Bioessays. 1999; 21: 238–46.
- Tenopoulou M, Doulias P, Barbouti A, Brunk U, Galaris D. Role of compartmentalized redox-active iron hydrogen peroxide-induced DNA damage and apoptosis. Biochem J. 2005; 387: 703–10.
- Rojas E, Lopez M, Valverde M. Single cell gel cell electrophoresis assay: methodology and applications. J Chromatogr B Biomed Sci Appl. 1999; 722: 225–54.
- Tice RR, Agurell E, Anderson D, Burlinson B, Hartmann A, Kobayashi H, et al.. Single cell gel/comet assay: guidelines for in vitro and in vivo genetic toxicology testing. Environ Mol Mutagen. 2000; 35: 206–21.
- Singh NP, Tice DB, Pearson RR, Brant JD, Schneider EL. DNA damage and repair with age in individual human lymphocytes. Mutat Res. 1990; 237: 123–30.
- Philips HJ. Dye exclusion tests for cell viability. In: Kruse Jr. PF, Patterson Jr. MKDye exclusion tests for cell viability. NY: Academic press. 1973. p. 406–8.
- Wang CC, Fang KM, Yang CS, Tzeng SF. Reactive oxygen species-induced cell death of rat primary astrocytes through mitochondria-mediated mechanism. J Cell Biochem. 2009; 107: 933–43.
- Wang K, Hong YJ, Huang ZQ. Protective effects of silybin on human umbilical vein endothelial cell injury induced by H2O2 in vitro. Vascul Pharmacol. 2005; 43: 198–206.
- Frenzilli GB, Barale E. Validation of single cell gel assay in human leukpcytes with 18 reference compounds. Mutat Res. 2000; 468: 93–108.
- Rosignoli P, Fabiani R, De Bartolomeo A, Spinozzi F, Agea E, Pelli MA, et al.. Protective activity of butyrate on hydrogen peroxide-induced DNA damage in isolated human colonocytes and HT29 tumor cells. Carcinogenesis. 2001; 22: 1675–80.
- Gasiorowski K, Brokos B. DNA repair of hydrogen peroxide-induced damage in human lymphocytes in the presence of four antimutagens. A study with alkaline single cell gel electrophoresis (Comet assay). Cell Mol Biol Lett. 2001; 6: 897–911.
- Henzler T, Steudle E. Transport and metabolic degradation of hydrogen peroxide in chara corallina: model calculations and measurements with the pressure probe suggest transport of H2O2 across water channels. J Exp Bot. 2000; 51: 2053–66.
- Jaruga P, Dizdaroglu M. Repair of products of oxidative DNA base damage in human cells. Nucleic Acids Res. 1996; 24: 1389–94.