Abstract
Background and aims: To determine renal volume in adult patients with essential hypertension and correlate it with age, sex, body mass index (BMI), body surface area (BSA) and duration of hypertension.
Patients and methods: A total of 150 patients (75 males, 75 females) with essential hypertension and normal renal status were evaluated sonographically in this prospective study. Fifty healthy individuals (25 males, 25 females) without hypertension were also evaluated as control. Renal volume was then calculated from the kidney's length, width and anterio-posterior diameter using the formula L×W×AP×0.523.
Results: The range of renal volume obtained was 51.65–205.02 cm3, with a mean of 114.06±29.78 cm3 for the left kidney and 47.37–177.50 cm3 with a mean of 106.14±25.42 cm3 for the right kidney. The mean volumes of the right and left kidneys in males (112.98±25.56 cm3 and 123.11±32.49 cm3, respectively), were significantly higher than in females (99.31±23.07 cm3 and 105.01±23.77 cm3, respectively). Renal volume correlated significantly with BSA and BMI, but decreased with age. The renal volume showed no correlation with duration of hypertension.
Conclusion: Renal volume is higher in the left than the right kidney in hypertensive patients of both sexes and female hypertensive patients have smaller kidney size compared to males. The study also shows that volume of both kidneys decreases with age and positive correlation between renal volume, BSA and BMI. However, there is no correlation between renal size and duration of hypertension.
Introduction
Hypertension is one of the most common non-communicable diseases world wide especially essential hypertension, which is a multifactorial disorder Citation1. The kidney plays a major role in the regulation of blood pressure (BP) and is one of the main organs affected by high BP Citation1. The high prevalence of hypertension in Nigeria, which is estimated to be about 10% Citation2, makes it important to study the effect it has on the kidneys.
Renal ultrasound scan is a simple non-invasive method for estimating the kidney size in vivo and has many advantages over other imaging methods. These include use of non-ionising radiation, little or no patient preparation and no need for medication or injection of contrast media. It is also readily available, cheap and easily reproducible to a large extent. Renal length and volume are important parameters in clinical settings, such as the evaluation and follow up of patients with kidney transplants, renal artery stenosis, recurrent urinary tract infection and vesico ureteral reflux Citation3. Where the facility is available, Doppler ultrasound scan of the renal vessels can also be important in the diagnosis of renal artery stenosis and renovascular disease Citation4Citation5. It is also useful in assessment of intra renal haemodynamics in different pathological conditions such as essential hypertension, acute and chronic renal failure (CRF) Citation6.
Kidney length is the most easily reproducible parameter in assessing kidney size. However, renal volume is a better approximation of size than length because the shape of the kidney varies considerably. It has also been shown that renal volume correlates well with kidney weight Citation1.
A few studies have been done in Nigeria on renal size, but most of them used renal length and width as the determinant parameters. Very few studies have been done on renal volume in Nigeria, either in healthy people or in those with conditions such as hypertension, diabetes mellitus and renal disease. We aimed to evaluate renal volume in patients with essential hypertension who have not developed chronic renal disease, and correlate it with age, somatic parameters and duration of hypertension.
2 Subjects and method
A prospective ultrasonographic evaluation of renal volume in patients with essential hypertension was done at the Department of Radiology, Obafemi Awolowo University Teaching Hospitals Complex (OAUTHC), Ile-Ife Osun state, Nigeria between January and November 2007. A total of 150 adult patients with essential hypertension attending the cardiology unit outpatient clinic of the hospital were examined sonographically after informed consent was obtained. The sample size was based on an estimated 10% prevalence of hypertension in Nigeria. Ethical clearance was obtained from the ethical committee of the hospital.
The patients were selected using a gender-stratified random sampling technique. The sample size was stratified such that 75 males and 75 females were examined. Patients with chronic renal disease were excluded from the study, namely those with serum creatinine ≥130 mol/l and creatinine clearance < 100 ml/min. Also excluded from the study were pregnant women and women who had given birth in the last 12 months. Patients with congenital anomalies such as a horse shoe-shaped or ectopic kidney and those with renal cysts were also excluded. In addition, we excluded patients with secondary causes of hypertension such as renovascular stenosis, coarctation of aorta (identified by the presence of bruit on abdominal auscultation with stethoscope).
A control group of 50 healthy individuals (25 males and 25 females) without hypertension were also sonographically examined. These individuals were recruited from members of staff of the hospital and members of the public visiting the hospital following an advert placed on the hospital's notice board. The inclusion criteria included absence of any history of hypertension in the individual which was confirmed by monitoring of BP and absence of chronic renal disease. The exclusion criteria for the control group were the same as those used for the hypertensive patients.
The patients’ age, gender and duration of hypertension (calculated from the time of diagnosis in the hospital to the time of ultrasound examination) were obtained before ultrasound examination. The height (in metres) and weight (in kilograms) of the patients were measured. The body mass index (BMI) and body surface area (BSA) were calculated using the formula weight/height2 and weight0.425×height0.725×71.84, respectively. BP was measured using a sphgymomanometer.
Real-time grey scale ultrasound examination was performed with a Fukuda Denshi FF sonic UF-750XT ultrasound machine using the 3.5–5 MHz curvilinear probe. Sonography was performed on the patients with an empty urinary bladder and in prone position. Acoustic gel was applied to the skin (to obliterate the air interface between the probe and skin). The kidney was clearly identified as having a brightly echogenic renal capsule with a central (sinus) echogenicity.
The superior and inferior poles were clearly identified and marked in the longitudinal scan of the kidney, the renal length (L) was taken as the longest distance between the poles using an electronic calliper. The antero-posterior diameter (AP) (thickness) was also measured on longitudinal scan, and the maximum distance between the anterior and posterior walls at the mid-third of the kidney was taken as AP diameter. The renal width (W) was measured on transverse scan, and the maximum transverse diameter was taken at the hilium as the renal width. The unit of measurement was centimetre (cm).
Kidney volume was calculated using the formula: L×W×AP×0.523 Citation7.
Data processing and statistical analysis were carried out using Microsoft Excel and Statistical Software Package for Social Sciences SPSS (version 13.0).
3 Results
A total of 150 patients (75 males and 75 females) were examined. The age range was 21–86 years, with a mean of 61.6 years. The ages of the control group of 25 males and 25 females ranged from 25 to 81 years, with a mean of 50.1 years. Among the hypertensive patients, 81 (54%) were above 60 years of age while there were only 20 (40%) in this age group among controls.
The mean BMI in male patients (27.65±5.49 kg/m2) was significantly higher than in female patients (24.72±4.82 kg/m2), p<0.001. In the control group, mean BMI in females (28.75±6.39 kg/m2) was significantly higher than in males (23.11±3.59 kg/m2), p<0.001 ().
Table 1. Age and somatic parameters distribution patterns in hypertensive patients and controls
Among the patients, the mean BSA in males (644.94±60.69 m2) was significantly higher than in females (608.40±66.03 m2), p<0.001. This was also seen in the control group, with mean BSA in males (628.15±48.9 m2), significantly greater than that in females (620.20±65.40 m2), p<0.01 ().
The duration of hypertension ranged between six months and 40 years with a mean of 6.6 years. Less than half of the patients (67; 44.7%) have had hypertension for more than five years, 53 (35.3%) have had it for 1–5 years, and 30 (20%) had it for less than one year ().
Table 2. Duration of hypertension by gender
In the hypertensive group, kidney volume ranged from 51.65 to 205.02 cm3 for the left kidney and 47.37 to 177.50 cm3 for the right kidney. In this group, mean volumes of the right and left kidneys in males (112.98±25.96 cm3 and 123.11±32.49 cm3, respectively) were significantly greater (p<0.001) than in females (99.31±23.07 cm3 and 105.0±23.77 cm3, respectively) (). In the control group, the range of renal volume was 65.51–200.72 cm3 for the left kidney and 64.38–163.96 cm3 for the right kidney. In the control group, the mean renal volume for males on the left (121.71±27.78 cm3) and right (110.44±24.05 cm3) were greater than the mean renal volume in females (111.56±20.76 cm3 and 105.18±16.25 cm3, respectively) (), but the difference between genders was not statistically significant p=0.12 (p>0.05).
Table 3. Comparison between right and left renal volume in male and female hypertensive patients and controls
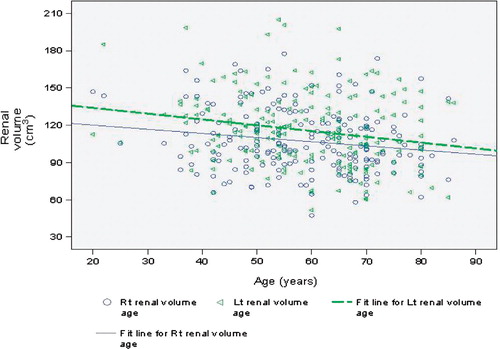
The largest mean renal volumes for right and left kidney were recorded in age groups 21–30 and 31–40 years in the male and female hypertensives, respectively, while the least mean renal volumes for right and left kidney were recorded in the age group older than 60 years in both gender. However, there were no females in age group 21–30 years. There was a significant negative correlation between age and renal volume with r= − 0.22 and −0.19, p<0.05 for right and left kidney, respectively. It was also observed that left kidney volume was significantly larger than right kidney volume in each age group, t=3.96 with p<0.001. represents the relationship of renal volume with age in hypertensives and it shows that as the age increases the renal volume decreases. In the control group, left kidney was also larger than the right kidney for each age group in both genders. A negative correlation which was not significant for both kidneys was also established between age and renal volume in the control group, r= − 0.03 and −0.12, p=0.81 and 0.22 for right and left kidney, respectively. The mean renal volume of both kidneys for male in the hypertensive group was higher than that in the control group while the mean renal volume for female in the control group was higher than that in the hypertensive group.
Figure 1. Scatter plot showing decrease in renal volume as age increases in hypertensive patients.
The distribution of BMI with mean renal volume in the hypertensive group showed that the smallest mean renal volume was in the underweight group (BMI ≤ 20), while the maximum was in the overweight group (BMI = 25–29).
Renal volume correlated significantly with BMI in hypertensive patients (r=0.25 and 0.20; p<0.01 for right and left kidney, respectively) as well as in the control group (r=0.34 and 0.25, p=0.01, respectively) . A significant positive correlation was also seen between renal volume and BSA in the hypertensive group (r=0.50 and 0.54; p<0.01 for right and left kidney, respectively) and in the control group (r=0.32 and 0.41, respectively, p<0.01) ( and ). There was no significant correlation between renal volume and duration of hypertension (r=0.09 and 0.08; p>0.22 and 0.33 for left and right kidneys, respectively).
Figure 2. Scatter plot showing increase in renal volume as BMI increases in hypertensive patients.
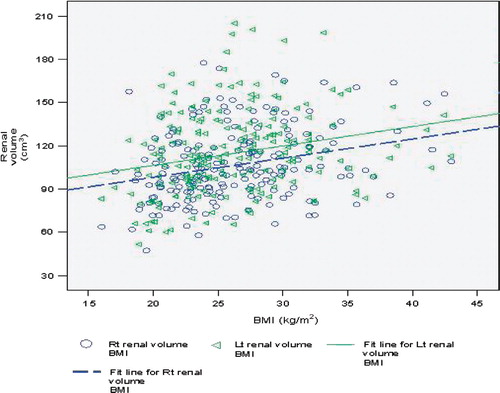
Figure 3. Scatter plot showing increase in renal volume as BSA increases in hypertensive patients.
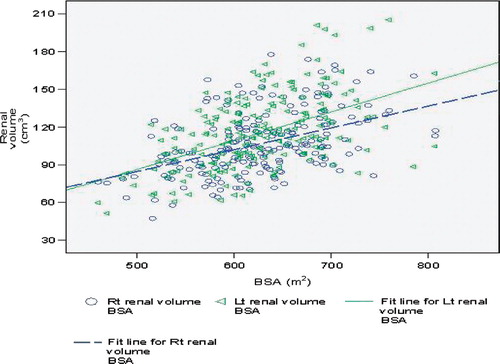
Table 4. The renal volume of both kidneys by BMI in hypertensive patients and controls
4 Discussion
Essential hypertension, which is a major public health issue, frequently complicates renal disease, but no consistent renal abnormality has been demonstrated in essential hypertension Citation8.
The number of nephrons in a kidney correlates with the physical dimensions and size of the organ Citation9. Hence, there is the need to have an accurate measurement of the kidney size because the nephron is the functional unit of kidneys. Measurement of kidney volume by ultrasound is a simple and non-invasive method Citation8. The importance of accurate measurement of renal size cannot be overemphasised because recent studies have suggested that the size of the allograft, or the ratio of the kidney weight to the donor body weight, have a direct positive relationship to graft survival Citation10Citation11.
This study set out to determine renal volume in patients with essential hypertension using ultrasound, which is a better approximation of renal size than length measurement because the shape of the kidney varies considerably Citation1. Our study corroborates the work done in Australia Citation1, UK Citation8 and Denmark Citation12 in normal subjects without hypertension. These studies found that the left kidney is larger than the right kidney, and that kidneys are larger in males than in females. The mean renal volumes we observed were slightly different from those reported in other studies Citation1Citation8Citation12, possibly due to differences among ethnic groups.
Reasons have been postulated for the bigger size of left kidney; one possible explanation is that because the spleen is smaller than the liver, the left kidney has more space for growth Citation12. Another explanation is that because the left renal artery is shorter and straighter than the right one, increased blood flow in the left artery may result in relatively larger size Citation12.
We also show that there is considerable reduction in renal size as age advances. This is corroborated by other studies Citation9Citation12. The explanation for this is that the number of nephrons per normal kidney, which varies between 400,000 and 1,000,000 nephrons per kidney, diminishes with advancing age Citation9.
Renal volume as already proven is the most precise measurement of renal size and tends to show the highest correlation with height, weight and BSA Citation12. Our results are in accordance with this statement because we observed significant correlation between renal volume and BSA, particularly with the left kidney. Significant correlation was also demonstrated between renal volume and BMI. However, right renal volume correlates better with BMI, as reported in other studies Citation12. We also found that BSA has better correlation with renal volume than BMI. The mean BSA in males was significantly larger than in females, which may also explain the higher mean renal volume observed in males.
The duration of hypertension in our patients was calculated from the time hypertension was first diagnosed in the hospital in a patient. It is very difficult to determine the actual duration because of the insidious on-set of the disease, which means that it can go undetected for a long time. There was no significant correlation between renal size and duration of hypertension, though most patients (67; 44.7%) were in the groups that have been diagnosed for more than five years. This is unlike the findings in Turkey Citation13, which showed that renal volume is smaller in hypertensive patients with CRF when compared with non-hypertensive CRF patients, which suggests that renal volume decreases more in patients with CRF and hypertension than in CRF patients who are not hypertensive. This may imply that hypertension affects renal volume when there is a severe underlying renal parenchymal damage or compromise. None of the participants in our study had an underlying renal pathology, as indicated by their normal serum creatinine and creatinine clearance values.
In conclusion, as renal volume is the most precise measurement of renal size Citation1, we established values of renal volume in patients with essential hypertension in our environment. This study has shown that renal size decreases with age in hypertensive adults, and that renal size on the left is larger than on the right. Also female hypertensive patients have smaller kidneys than males. No significant difference was seen in the mean renal volume between the hypertensive and the control group in this study. The renal volume shows significant positive correlation with BSA and BMI. Moreover, renal size and duration of hypertension do not seem to be significantly correlated.
5 Conflict of interest and funding
The authors have not received any funding or benefits from industry to conduct this study.
References
- Singh GR, Wendy EH. Kidney volume, blood pressure and albuminuria; findings in an Australia aboriginal community. Am J Kidney Dis. 2004; 43: 254–9.
- Akinkugbe OO. Non-communicable diseases in Nigeria; series 1. Nigeria: Federal Ministry of Health and Human Services. 1992. p. 2–24.
- Bakker J, Olree M, Kaatee R, de Lange EE, Moons KG, Beutler JJ, et al.. Renal volume measurement; accuracy and repeatability of ultrasound compared with that of MR imaging. Radiology. 1999; 211: 623–8.
- White ME, Choyke PL. Duplex sonography of the abdomen. Duplex sonography. Grant EG, White EMSpringer. New York, 1988; 129–90.
- Pontremoli R, Viazzi F, Martinoli C, Ravera M, Nicolella C, Berruti V, et al.. Increased renal resistive index in patients with essential hypertension; a marker of target organ damage. Nephrol Dial Transplant. 1999; 14: 360–5.
- Veglio F, Frascisco M, Melchio R, Provera E, Rabbia F, Oliva S, et al.. Assessment of renal resistance index after captopril test by Doppler in essential and renovascular hypertension. Kidney Int. 1995; 48: 1611–6.
- Hricak H, Lieto RP. Sonographic determination of renal volume. Radiology. 1983; 148: 311–2.
- Raman GV, Clark A, Campbell S, Watkins L, Osmond C. Is blood pressure related to kidney size and shape?. Nephrol Dial Transplant. 1998; 13: 728–30.
- Nyengard JR, Bendsten TF. Glomerular number and size in relation to age, kidney weight and body surface in normal man. Anat Rec. 1992; 232: 194–201.
- Lim EC, Terasaki PI. Outcome of renal transplantation in different primary diseases. Clinical transplants. Terasaki PI, Cecka JMUCLA Tissue Typing Laboratory. Los Angeles CA, 1991; 293–303.
- Kupin WL, Venkat KK, Mozes M. Predictive value of the donor surface area ratio (DSA/RSA) on the outcome of primary cadaveric transplantation. J Am Soc Nephrol. 1993; 4: 945.
- Emamian SA, Nielsen MB, Pedersen JF, Ytte L. Kidney dimensions at sonography: correlation with age, sex, and habitus in 665 adult volunteers. AJR Am J Roentgenol. 1993; 160: 83–6.
- Zümrütdal AO, Turan C, Cetin F, Adanali S. Relationship between renal size and hypertension in patient with CRF. Nephron. 2002; 90: 145–7.