
Abstract
The hand grip test has been correlated with mobility and physical performance in older people and has been shown to be a long-term predictor of mortality. Implementation of new strategies for enhancing healthy aging and maintaining independent living are dependent on predictable preclinical studies. The mouse is used extensively as a model in these types of studies, and the paw grip strength test is similar to the hand grip test for people in that it assesses the ability to grip a device with the paw, is non-invasive and easy to perform, and provides reproducible information. However, little has been reported on how grip strength declines with increasing age in mice. This report shows that grip strength was decreased in C57BL/6 (B6) NIA and C57BL/6×BALB/c F1 (CB6F1) NIA male mice at 12 months of age compared to 8-month-old mice, and continued a robust decline to 20 months and then 28 months of age, when the study was terminated. The decline was not related to lean muscle mass, but extensive age-related carpal and digital exostosis could help explain the decreased grip strength times with increasing age. In conclusion, the grip strength test could be useful in mouse preclinical studies to help make translational predictions on treatment strategies to enhance healthy aging.
A Corrigendum has been published for this paper. Please see http://www.pathobiologyofaging.net/index.php/pba/article/view/33718
Hand grip is a universal measurement used to assess physical competency in older adults. It is simple to perform and provides information on the ability to grip a device over time. This has been correlated with mobility and physical performance in older adults whose independent living is in question and has been shown to be a long-term predictor of mortality from all causes in humans (Citation1, Citation2). Implementation of new strategies for enhancing healthy aging and maintaining independent living are dependent on predictable preclinical studies (Citation3). The mouse is used extensively as a model in these types of studies, but a number of physiological assessment procedures are not yet well documented to have a translational impact. In this regard, the grip strength test is similar to the hand grip test for people in that it assesses the ability to grip a device with the paw, is non-invasive and easy to perform, and provides reproducible information and has been previously investigated in aging mice as well as an indicator of frailty (Citation4). However, little has been reported on how grip strength declines with increasing age in mice. This report provides data showing that grip strength declines as early as 12 months of age in two different strains of male mice and continues to decline with increasing age.
The grip strength test was conducted on male B6 (C57BL/6) and CB6F1 (C57BL/6×BALB/c) mice obtained from the NIA-aged mouse contract facility (Charles River Laboratories, Wilmington, MA, USA). Age cohorts were 4, 12, 20, and 28 months, with 18–20 mice per age group. This was a cross-sectional study that did not use the same mice throughout lifespan, but used groups of mice at different ages. Mice at each age group were tested to determine peak paw grip strength. Mice were positioned horizontally from a grip bar (San Diego Instruments, San Diego, CA, USA) and pulled back slowly and steadily until they released their grip. This was repeated five times, and the peak force for the forelimb paws was measured. Mice were weighed on the date of their grip strength testing in order for grip strength to be normalized by their body weight, so that peak force was expressed relative to body weight. Quantitative magnetic resonance was used to assess fat mass and lean body mass. Mice were euthanized 4 months later and the paw collected for histopathology assessment. Differences between strains and age groups were assessed using the analysis of variance (ANOVA) with two factors (strain, age group, and an interaction between them). When there was no interaction and a factor was statistically significant, we performed a post-hoc comparison of means using Bonferroni adjustment.
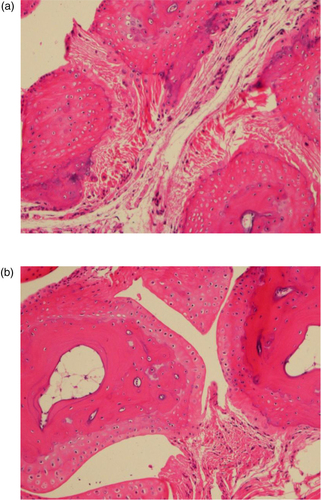
Paw grip showed a decline in peak force in both strains starting at 12 months of age (), with no statistical differences between the two strains. The 4-month-old mice had the highest grip strength values, with each subsequent group of older mice having less. Age groups 4 and 12 were statistically different from age groups 20 and 28, with no other significant differences in pairwise comparison. Peak force values were standardized to body weight because body weight can influence grip strength measurements. As can be seen in , body weights differed between the two strains and at different ages. Each strain had different patterns for body weight, with CB6F1 mice having consistently higher body weight than B6 mice. CB6F1 mice had a lower average percentage of lean body mass than B/6 mice across all age groups () and a consistently higher percentage of fat mass than B/6 mice across all age groups (). It can be seen that paw grip strength and lean muscle mass were not correlated (). Although paw grip declined with age, their lean muscle mass stayed at generally the same levels. So, factors other than loss of muscle mass would need to explain the decreasing strength grip times in older mice. One possible explanation is the presence of lesions in the carpal and digital areas. Exostosis in the carpus and digits occurred in greater than 50% of the mice in the older age cohorts. A representative lesion can be seen in a in a CB6F1 mouse in the oldest age cohort, compared to the absence of lesions in a CB6F1 mouse in the youngest age cohort. Upon intense gripping, these lesions could be associated with some degree of pain, and thus, account for a decreased grip strength time.
Fig. 1 (a) B6 mouse paw strength declined from 121.8±18.5 to 106.2±15.1 to 92.1±15.7 to 88.6±10.9 from ages 4, 12, 20, and 28 months, respectively. Following the same pattern, CB6F1 mouse grip strength declined from 119.2±12.3 to 105.0±15.7 to 93.2±14.0 to 87.9±16.0 through the four age groups. (b) B6 mice had average masses of 31.75±2.1, 33.19±2.19, 33.40±3.73, and 35.60±7.59 g at the 4, 12, 20, and 28 months of age, respectively. CB6F1 mice had increased body weights in the 12- and 20-month age groups compared to 4- and 28-month age groups. The B6 mice had mean masses of 38.57±3.24, 42.93±3.29, 43.19±3.27, and 39.09±2.54 g at 4, 12, 20, and 28 months of age, respectively. Strain, age groups, and the interaction between strain and age were all significant (p<0.001, p=0.001, p=0.001, respectively).
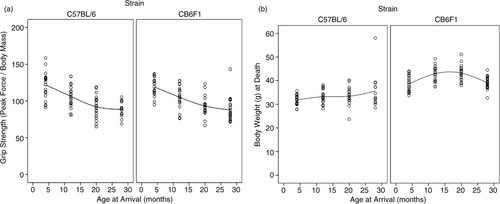
Fig. 2 (a) B6 mice at 4, 12, 20, and 28 months of age had mean lean mass percentages of 79.0±1.4, 77.0±2.1, 78.8±2.4, and 79.4±2.0, respectively. CB6F1 mice at 4, 12, 20, and 28 months of age had mean lean mass percentages of 75.8±2.1, 70.2±3.8, 69.7±5.2, and 74.1±4.7, respectively. (b) B6 mice at 4, 12 20, and 28 months of age had mean percent fat masses of 11.1±1.6, 14.1±1.8, 12.7±2.4, and 11.8±2.1, respectively. CB6F1 mice at 4, 12, 20, and 28 months of age had mean percent fat masses of 16.3±1.7, 21.9±3.3, 21.6±5.2, and 17.3±5.7, respectively.
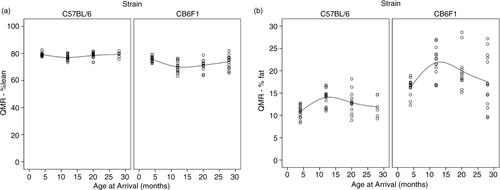
Fig. 3 Exostosis is a significant lesion seen with increasing age in carpal bones of mice. (a) Severe exostosis in a CB6F1 mouse in the oldest age cohort (28 months). (b) Absence of exostosis in a CB6F1 mouse in the youngest age cohort (4 months).
In conclusion, the grip strength test has the potential to be used as an easy assay in determining age-related differences in male mice, showing a significant decline starting at least by 12 months of age. Additional testing of female mice is needed to determine if this observation is non-specific for gender.
Conflict of interest and funding
This work was supported by R24 AG047115 (PI, WL) and P30 AG013280 PI, PR). The authors were not associated with any other funding sources for the conduct of this study.
Notes
A Corrigendum has been published for this paper. Please see http://www.pathobiologyofaging.net/index.php/pba/article/view/33718
Related Research Data
References
- Gale CR, Martyn CN, Cooper C, Sayer AA. Grip strength, body composition, and mortality. Int J Epidemiol. 2007; 36(1): 228–35.
- Hirsch CH, Buzková P, Robbins JA, Patel KV, Newman AB. Predicting late-life disability and death by the rate of decline in physical performance measures. Age Ageing. 2012; 41(2): 155–61.
- Seals DR, Justice JN, LaRocca TJ. Physiological geroscience: targeting function to increase health span and achieve optimal longevity. J Physiol. 2016; 594(8): 2001–24.
- Liu H, Graber TG, Ferguson-Stegall L, Thompson LV. Clinically relevant frailty index for mice. J Gerontol A Biol Sci Med Sci. 2014; 69(12): 1485–91.