Abstract
Ten warm-core winters were distinguished in the period 1975/76–2007/08, drawing on data from the Svalbard Airport weather station in central Spitsbergen and using the conditions t m 1<t m and t m >t m+1 (t is the monthly mean temperature while m 1, m and m+1 denote subsequent winter months) and the parameter of a coreless rate, c r (the ratio of the second, a 2, to the first, a 1, harmonic of the annual temperature wave). Composite maps of sea-level pressure (SLP) and z 500-hPa means, and anomaly maps, were constructed separately for the mid-winter warm events and for the cold months before and after warming. Using the clustering method, different pressure patterns were recognized among the days of mid-winter warm spells. The occurrence of coreless winters in central Spitsbergen seems to be largely controlled by the position, extent and intensity of large-scale atmospheric systems, mainly the Icelandic Low. When the low spreads to the east and its centre is over the Barents Sea the inflow of air masses from the northern quadrant is observed over central Spitsbergen. This inflow of cold air of Arctic origin to the island takes place during the months preceding and following warm mid-winter events. Different circulation conditions appear when the Icelandic Low gets deeper than usual and shifts northwards, which coincides with warm spells. Sometimes a secondary cyclonic centre is located over Fram Strait and its warm sector encompasses Svalbard.
From year to year mean monthly surface air temperatures at high latitudes vary considerably, as does the annual temperature pattern, particularly for the winter season. A characteristic of the annual pattern of surface air temperature in the polar regions is a mid-winter warm spell. This phenomenon of a semi-annual temperature cycle was first recognized in the Antarctic and was called “kernlose”, or coreless, winter (Wexler Citation1958), that is, a winter lacking a cold core (see Van Loon Citation1967). The long warm spells observed during the polar winter are also known as “warm-core events” (Umemoto Citation1998). The occurrence of coreless winters in the Antarctic has been well recognized and widely described (e.g., Van Loon 1967; Dolgin Citation1976; Wendler & Kodama Citation1993; Kejna Citation2002; Lipowska Citation2004; Styszyńska Citation2004; Chen et al. Citation2010). Fewer works deal with the occurrence of coreless winters in the Arctic (Rubinshteyn Citation1962; Umemoto Citation1998).
Two principal mechanisms to account for coreless winter phenomenon have been discussed. One is the influence of air circulation factors that contribute to warm advection from lower latitudes during the polar winter (Wexler Citation1958; Rubinshteyn Citation1962; Dolgin Citation1976; Dolganov Citation1986; Wendler & Kodama Citation1993; King & Turner Citation1997; Styszyńska 2004). The second is a characteristic of the radiation balance during polar nights: a strong inversion reaching the level of 2 km (and amounting to 25°C) in the Antarctic (Connolley Citation1996) and about 1 km over the Arctic Basin (Serreze et al. Citation1992). With this inversion, the upper and middle layers of the troposphere become warmer than the layer close to the ground and emanate a flux of long wave radiation, which reaches the lower layer and warms it up. An additional factor bringing about the temperature increase under the conditions of deep inversion is high-speed katabatic winds, typical of mountainous climates in cold zones, which disturb the inversion layer and mix the air masses.
Over the Arctic, additional possible mechanisms have been postulated by Rubinshteyn (Citation1962): the sensible heat transport from the Arctic Ocean through the sea ice; the release of latent heat at sea ice formation.
Most studies of coreless winters concern Antarctica; the phenomenon is not as well documented or understood in maritime polar regions of the Northern Hemisphere. This study aims to detect the occurrence of coreless winters in Spitsbergen and to identify the pressure fields and circulation factors responsible for the mid-winter warming. In light of the interest in climate changes in the Arctic, this work contributes the larger discussion of winter temperature and circulation feedback in this region.
Study area
The island of Spitsbergen is part of the Svalbard Archipelago, located in the North Atlantic. Svalbard is surrounded by the Arctic Sea in the north, the Barents Sea in the south-east and the Greenland Sea in the south-west. The archipelago is separated from Greenland by the narrow Fram Strait. The surrounding seas are ice-bound for part of the year. The occurrence of sea ice is strongly controlled by the warm West Spitsbergen Current and the cold East Spitsbergen Current. The southern coast of Spitsbergen represents the most northerly penetration of open ocean water in winter in the North Atlantic. This study considers the central part of the island, represented by the Svalbard Airport weather station (78.25°N, 15.46°E, 2 m a.s.l.). The airport is located near the shore of the Isfjorden fjord, which cuts in deeply from the west side of the island.
Data and methods
Daily mean surface air temperatures at Svalbard Airport for the years 1975–2008 were collected from the Norwegian Meteorological Institute, available via the eKlima Internet portal (http://sharki.oslo.dnmi.no/portal/page?_pageid=73,39035,73_39049&_dad=portal&_schema=PORTAL). In the Arctic, determining the homogeneity of a time series is often very difficult because of the absence of neighbouring stations (Nordli Citation1990). In the case of Svalbard Airport no changes in the location of the station took place in the studied period and the series was checked and deemed homogeneous (Førland et al. Citation1997; Nordli et al. Citation2000).
Warm-core events can be simply defined by the following conditions: t
m 1<t
m
and t
m
>t
m+1, where t is the monthly mean temperature, while
m 1,
m
and
m+1 denote the previous month, the very month and the following month, respectively. The occurrence and intensity of the coreless winter can also be determined by a parameter of a coreless rate, c
r, which is defined as the ratio of the second, a
2, to the first, a
1, harmonic of the annual temperature wave (Allison et al. Citation1993; Wendler & Kodama Citation1993; Chen et al. Citation2010). A coreless rate greater than 0.25 denotes a typical coreless winter. Both criteria were applied to identify coreless winters in this study. First and second harmonics of annual temperature wave were found by least square data fitting to the model:
where t i is mean monthly temperature of month i (i=1 … 12).
To recognize the circulation factors responsible for the events of mid-winter warming, the pressure patterns during coreless winters were identified. To this end, the sea-level pressure (SLP) and 500-hPa geopotential heights (z 500 hPa) daily data were selected from the reanalysis data sets produced by the National Centers for Environmental Prediction and the National Center for Atmospheric Research in the US (Kalnay et al. Citation1996).
Composite maps of the SLP and z 500-hPa means and anomaly maps of the region between 60 and 90°N and between 60°W and 80°E were constructed separately for the mid-winter warm events and for the cold months before and after warming. Composite anomaly maps show the SLP and z 500-hPa differences between the selected weather situations and winter means (Birkeland & Mock Citation1996).
To distinguish pressure patterns occurring during the mid-winter warming, Ward's (Citation1963) minimum variance method was conducted on the standardized daily SLP data to cluster the days of mid-winter warm spells. Ward's method is the most frequently used hierarchical clustering technique for climatic classifications (Kalkstein et al. Citation1987). Clustering techniques have been used previously to identify the atmospheric circulation patterns associated with the occurrence of specific weather phenomena (e.g., Birkeland & Mock Citation1996; Esteban et al. Citation2005). The SLP and z 500-hPa contour maps were constructed for each distinguished group, representing different pressure patterns that appear during mid-winter warm spells.
Finally, the relation of the occurrence of coreless winters to the Northern Hemisphere teleconnection patterns was analysed. To this end, the correlation coefficients between c r and indices of each teleconnection pattern were computed for every winter month, and for all months of the year preceding and following the winter season. The Northern Hemisphere teleconnection patterns represented by monthly indices were taken from the US National Oceanographic and Atmospheric Administration's Climate Prediction Centre (CPC) data sets (http://www.cpc.ncep.noaa.gov/data/teledoc/telecontents.shtml).
Results
The annual pattern of the air temperature at Svalbard Airport averaged for 33 years (, ) reaches a maximum of 6.3°C in July, gradually decreasing to the minimum of 14.2°C at the end of the polar night (February). The spring increase in the air temperature is usually rapid, particularly in April and May, caused by the start of the polar day. The lowest temperature ( 12.0 to 14.2°C) occurs in the period from December to March, with an average of 13.3°C. However, the air temperature patterns of particular years show great interannual variability. The temperature of summer months is much less variable (standard deviation [SD] close to 1°C) than the temperature of winter months (SD ranging from 4 to 5°C).
Fig. 1 Annual course of the air temperature for years with coreless winters identified in the period 1975–2008 and a mean course (dashed line) for the whole period 1975–2008 as measured at the Svalbard Airport. The coreless rate (c r) is given for each year.
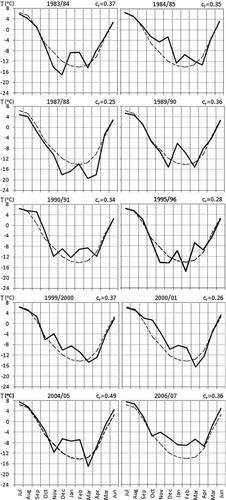
Table 1 Monthly mean temperature (°C) for the period 1976–2008 and for the coreless winters identified in the study. Mid-winter warm episodes are indicated in boldface.
The 10 most typical coreless winters fulfiling the conditions delineated earlier were selected out of 33 analysed seasons. Each of them is characterized by the anomalous annual pattern of air temperature, represented by one or two sub-waves during the winter season (). The amplitude ratio of the second to the first harmonic of the annual temperature wave (coreless rate) exceeds 0.25 for each chosen winter.
After rapid autumn cooling, a temperature increase is observed in winter months, most often in February and/or in January. Afterwards, a secondary decrease in the temperature (usually reaching the annual minimum) occurs before the beginning of the polar day. Due to the long warm spells in the middle of the season, coreless winters are usually warmer than average, with the exception of the winter of 1987/88, when the mean temperature of the coldest months (December–March) was permanently lower than average (). However, in this year the coreless character of the winter was determined by exceptionally low temperatures in December, March and April rather than high temperatures during the winter core.
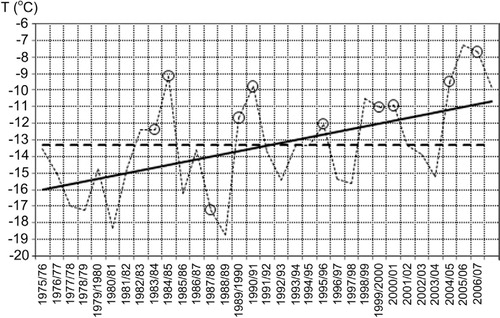
Fig. 2 Multiannual course of winter (December–March) mean air temperature measured at Svalbard Airport with a trend line and the mean for the whole period (−13.3°C) marked with a dotted line. All coreless winters identified in the study are indicated with circles.
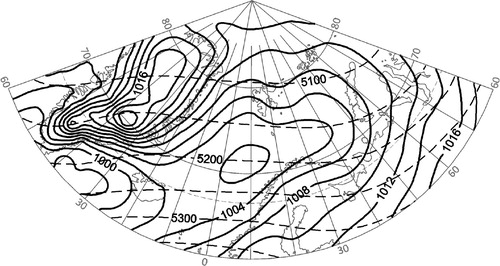
As circulation factors may be the main reason for the anomalous winter temperature pattern, pressure fields and their changes during coreless winters were analysed. The pattern of the mean SLP in winter shows two main centres in the Atlantic sector of the Northern Hemisphere (). One is the constant Greenland High, with a pressure of approximately 1020 hPa in the centre (SLP values over Greenland are fraught with uncertainty because of problems in extrapolating pressure over the high ice sheet). The other one is the Icelandic Low, with a pressure of 998 hPa in the centre, which is located south-west of Iceland. The Icelandic Low spreads to the north-east, forming a secondary centre (1002 hPa) over the North Atlantic, south of Svalbard. There is a big pressure gradient between Greenland and the aforementioned cyclonic centres. A smaller pressure gradient is observed towards the north-eastern Europe where the SLP increases gradually. In winter, the mean z 500-hPa level inclines from the south (5250 m) to the north (<5100 m over the Arctic Ocean). The z 500 hPa is often used to study the upper-level airflow as it relates to the surface weather.
Fig. 3 Mean sea-level pressure (solid lines) and geopotential height of 500 hPa in gpm (dashed lines) over the studied area for winter seasons 1975/76–2007/08.
The composite map and the anomaly map of the SLP and z 500 hPa were constructed for the cold months preceding and following the mid-winter warm spells (). In the SLP contour map, constructed for the above-mentioned cold months, the North Atlantic low moves to the east and its centre locates over the Barents Sea (a). Encompassing the south-eastern part of the studied area, this is a region of negative SLP anomalies (b). Strong positive SLP anomalies (up to 8 hPa) appearing over Iceland indicate weakening of the Icelandic Low, which would suggest the negative phase of the North Atlantic Oscillation (NAO), although the opposite centre over the Azores is not shown. Such a pressure pattern at sea-level implies a northern and north-eastern flow of air, which brings cold Arctic air to the North Atlantic. Contours of z 500 hPa constructed for the cold months during coreless winters bend to the south over the eastern part of the studied area. Small negative anomalies of z 500 hPa spread over the western part of the studied area. Such a z 500-hPa pattern suggests the northerly and north-westerly airflow in the middle troposphere over Svalbard.
Fig. 4 (a) Composite map of mean sea-level pressure (SLP) (solid lines) and geopotential height of 500 hPa in gpm (dashed lines). (b) Anomalies of the SLP (solid lines) and geopotential height of 500 hPa (dashed lines) for the cold months preceding and following the mid-winter warm spells.
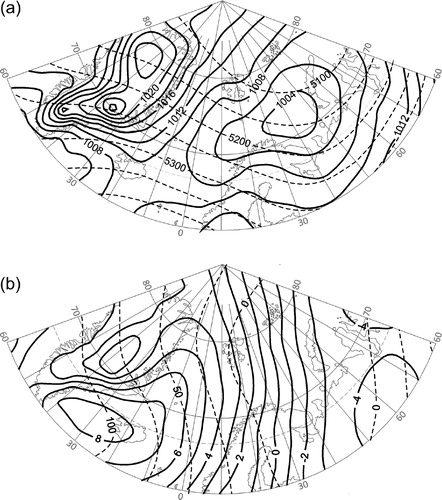
The pressure pattern, mainly the position of the North Atlantic cyclonic centre during the cold months preceding and following the warm mid-winter events, indicates the airflow direction from the northern quadrant over central Spitsbergen. This brings cold air of Arctic origin to the island.
Quite different synoptic situations underlie the mid-winter warm spells. a shows stronger-than-usual Icelandic Low (possibly the positive phase of the NAO), which is pushed slightly to the west and spreads northwards. The area of lower-than-normal SLP encompasses most of the North Atlantic, with the anomalies amounting to 2 hPa north of Iceland. At the same time, positive SLP anomalies (up to 6 hPa) are observed in the south-east, which indicates a stronger-than-usual high-pressure system over continental Europe. Contours of z 500 hPa constructed for the warm mid-winter months bend slightly to the north over the eastern part of the studied area, suggesting a south-westerly airflow in the middle troposphere over the North Atlantic. The centre of positive z 500-hPa anomalies occurs in the eastern part of the studied area. Consequently, circulation during the warm mid-winter events is characterized by a strong south-westerly (in the middle troposphere) and south-easterly (at sea-level) flow component, in contrast to the average winter circulation over the North Atlantic. Stronger-than-usual air flow from the southern quadrant brings about warmer-than-usual air masses over Svalbard, causing a significant mid-winter warming.
Fig. 5 (a) Composite map of mean sea-level pressure (SLP) (solid lines) and geopotential height of 500 hPa in gpm (dashed lines). (b) Anomalies of the SLP (solid lines) and geopotential height of 500 hPa (dashed lines) for the months of mid-winter warm periods.
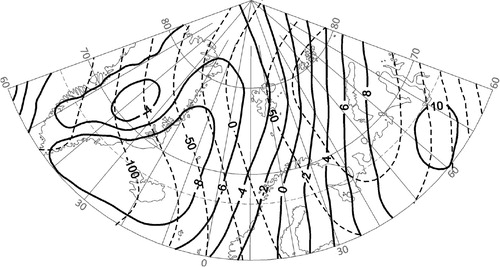
The shift of pressure patterns which takes place during coreless winters, resulting in the temperature increase, is shown in , which depicts the pressure difference between warm and cold months during the selected winters is depicted. The contours indicate that the Icelandic Low gets deeper by 6–8 hPa and spreads widely over the western part of the North Atlantic. At the same time, the continental anticyclone over northern Europe strengthens by 8–10 hPa, forming a blocking system, which pushes the Icelandic Low to the west.
Fig. 6 Difference between mid-winter warm periods composites and cold months composites (preceding or following the mid-winter warm spells). Solid lines indicate sea-level pressure and dashed lines are geopotential height of 500 hPa in gpm.
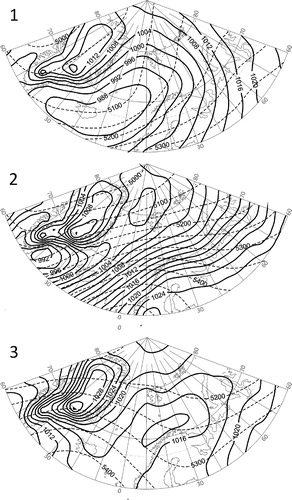
The SD of the SLP and z 500-hPa fields was computed for a and its value (14.6 hPa for the SLP and 153.2 m for the z 500-hPa field) was even higher than the SD computed for the whole analysed period, shown in (14.0 hPa and 148.5 m, respectively). This suggests that the composite map was averaging together a wide range of conditions. Therefore, an attempt was made to classify the pressure patterns during the mid-winter warm spells in central Spitsbergen. After clustering based on the standardized SLP data, composite maps of the three most relevant groups were constructed (). In the three types that were obtained the SLP patterns differ by the location and intensity of the pressure centres. In type 1, the Icelandic Low is much deeper than usual and its centre is shifted to the north-east in comparison with the average position. At the time, a higher-than-normal pressure is observed over north-eastern Europe and north-western Asia. Such SLP anomalies imply a high pressure gradient over the studied area and indicate a very strong south-eastern airflow, which brings warm air masses over Svalbard. Therefore, the mean temperature for type 1 days is 7.4 °C, which is about 5°C higher than the winter average. In type 2, the anticyclone over continental Europe is even stronger than in type 1 and the western cyclones form a narrow trough of low pressure spreading along the eastern coast of Greenland, with one very deep centre located west of Iceland and a secondary centre located over Fram Strait. Again, a high pressure gradient causes a very intensive airflow over the North Atlantic. Southern and south-eastern air masses flow over Svalbard, raising the air temperature during type 2 days to a mean value of 7.5°C. The intensity of the Icelandic Low in both types 1 and 2 is similar to the positive phase of the NAO with negative SLP anomalies over Iceland extended to the north and north-east.
Fig. 7 Circulation types distinguished among the days of mid-winter warm spells. Solid lines indicate sea-level pressure and dashed lines are geopotential height of 500 hPa in gpm.
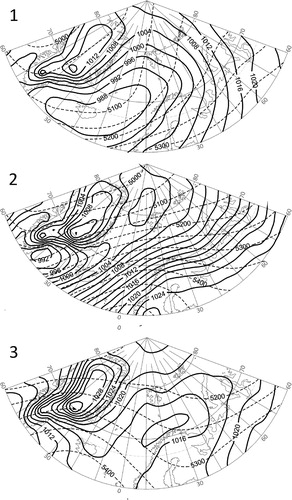
Type 3 represents different circulation conditions, with a very small pressure gradient over the North Atlantic and Europe and a weak low pressure centre spreading along the north coast of Scandinavia. Because such a pressure field results in a weak eastern airflow, the mean temperature during type 3 days is 11.1°C—is lower than in other types.
The relation of the occurrence of coreless winters in central Spitsbergen to the NAO and other Northern Hemisphere teleconnection patterns was analysed. The correlation coefficient between c r and the NAO is positive for December and January, but is not statistically significant. Correlation coefficients with other indices show a great variability from month to month and they are not statistically significant in most cases. Significant values are incidental (e.g., negative correlation coefficient between c r and indices of the polar/Eurasia teleconnection pattern in January). Because of the lack of regularity in these high correlation cases and difficulties in their physical explanation we suspect that they result from a random coincidence rather than a real relationship.
Discussion and conclusions
In the warming observed in recent years in the Arctic, the increase in winter temperature—about 5°C during the past three decades—plays an important role (Rogers et al. Citation2005), highlighting the importance of gaining a better understanding of coreless winters. At higher latitudes in winter, when there is no inflow of solar irradiation, temperature fluctuations are caused by atmospheric circulation (Alekseev et al. Citation1991, cited in Hanssen-Bauer & Førland Citation1998; Przybylak Citation2000). In the Norwegian Arctic, intense cyclonic activity and variation in the extent of air masses, originating from the north-east and south-west, cause great variation in the weather and in temperature conditions (Steffensen Citation1982; Nordli Citation1990; Førland et al. Citation1997). The occurrence of coreless winters in central Spitsbergen seems to be highly controlled by the air circulation, the latter being a consequence of pressure patterns over the North Atlantic and Eurasia. The position, extent and intensity of the two large-scale atmospheric systems are of crucial importance for controlling the temperature field over the North Atlantic. The main centre of action is the Icelandic Low, which strongly modifies the track of the Northern Hemispheric westerlies, so that they transport sensible heat poleward. A small change in the position of the Icelandic Low and in the cyclone track over the North Atlantic completely changes the direction of the air masses advection to Svalbard and causes a dramatic change in the air temperature.
When the low pressure system spreads to the east and its centre locates over the Barents Sea the inflow of air masses from the northern quadrant is observed over central Spitsbergen. This brings cold air of Arctic origin to the island and contributes to an essential drop in the air temperature. Such situation takes place during the cold months preceding and following the warm mid-winter events. Quite different circulation conditions appear when the Icelandic Low gets deeper-than-usual and it is shifted northwards, which takes place during the warm mid-winter events. Sometimes, a secondary cyclonic centre is located over Fram Strait and its warm sector encompasses Svalbard.
The same locations of the main “centres of action” with the intensive cyclogenesis in winter were indicated by Rogers et al. (Citation2005): (1) Fram Strait, which is a pathway of the cyclonic activity towards the High Arctic; (2) the Barents Sea, also identified by Serreze & Barry (Citation1988) and Serreze et al. (Citation1993); and (3) a centre located south-west of Iceland, commonly known as the Icelandic Low. The first and the third locations are responsible for the mid-winter warm events and the second one causes an instant cooling on Spitsbergen.
A mid-latitudes blocking system plays an important role in modifying the cyclone tracks. Such a blocking system (i.e., anticyclone) over the continent of Eurasia modifies the range of cyclonic activity connected with the Icelandic Low and pushes the cyclone track poleward through the Greenland Sea and Fram Strait. Therefore, while strong North Hemisphere blocking systems cause negative temperature anomalies in the middle latitudes, they bring positive temperature anomalies in the high latitudes (Dole & Gordon Citation1983; Colucci Citation1985; Knox & Hay Citation1985; Umemoto Citation1998).
Acknowledgements
This work was partly supported by the Polish National Science Centre under grant number 2011/01/B/ST10/01923.
References
- Alekseev G.V. Podgorni I.A. Svyashčennikov P.N. Hrol W.P. Osobiennosti formirowanija klimata i jego izmienčiwosti w polarnoj klimatičeskoj sistemie atmosfera–morskoj led-okean. (Features of climate formation and its variability in the polar atmosphere–sea ice–ocean climatic system.). Klimatičeskij režim Arktiki na rubeže XX i XXI. (Climatic regime in the Arctic at the turn of 20th and 21st century.). Krutskic B.A. Gidrometeoizdat. St. Petersburg, 1991; 4–29.
- Allison I. Wendler G. Radok U. Climatology of the East Antarctic Ice-Sheet (100°E to 140°E) derived from automatic weather stations. Journal of Geophysical Research—Atmospheres. 1993; 98: 8815–8823.
- Birkeland K.W. Mock C.J. Atmospheric circulation patterns associated with heavy snowfall events, Bridger Bowl, Montana. U.S.A. Mountain Research and Development. 1996; 16: 281–286.
- Chen B.L. Zhang R.H. Xiao C.D. Bian L.G. Zhang T.J. Analyses on the air and snow temperatures near ground with observations of an AWS at Dome A, the summit of Antarctic Plateau. Chinese Science Bulletin. 2010; 55: 1430–1436.
- Colucci S.J. Explosive cyclogenesis and large-scale circulation changes: implications for atmospheric blocking. Journal of the Atmospheric Sciences. 1985; 42: 2701–2717.
- Connolley W.M. The Antarctic temperature inversion. International Journal of Climatology. 1996; 16: 1333–1342.
- Dole R.M. Gordon N.D. Persistent anomalies of the extratropical Northern Hemisphere wintertime circulation: geographical distribution and regional persistence characteristics. Monthly Weather Review. 1983; 111: 1567–1586.
- Dolganov L.V. Atmosfernye uslovija Ju(noj polarnoj oblasti. (Atmospheric conditions of southern polar regions.). Gidrometeoizdat. Leningrad, 1986
- Dolgin L.M. Teplojadernye zimy v Antarktike. (Warm-core winters in the Antarctic.). Trudy Arktičeskogo i Antarktičeskogo Naučno-issledovatel'skogo Instituta. 1976; 327: 118–130.
- Esteban P. Jones P.D. Martin-Vide J. Mases M. Atmospheric circulation patterns related to heavy snowfall days in Andorra, Pyrenees. International Journal of Climatology. 2005; 25: 319–329.
- Førland E.J. Hanssen-Bauer I. Nordli P.Ø. Climate statistics and long term series of temperature and precipitation at Svalbard and Jan Mayen. DNMI Klima Report 21/97. Norwegian Meteorological Institute. Oslo, 1997
- Hanssen-Bauer I. Førland E.J. Long term trends in precipitation and temperature in the Norwegian Arctic: can they be explained by changes in atmospheric circulation patterns?. Climate Research. 1998; 10: 143–153.
- Kalkstein L.S. Tan G. Skindlov J.A. An evaluation of three clustering procedures for use in synoptic climatological classification. Journal of Climatology and Applied Meteorology. 1987; 26: 717–730.
- Kalnay E. Kanamitsu M. Collins W. Deaven D. Gandin L. Iredell M. Saha S. White G. Woollen J. Zhu Y. Chelliah M. Ebisuzaki W. Higgins W. Janowiak J. Mo K.C. Ropelewski C. Wang J. Leetmaa A. Reynolds R. Jenne R. Joseph D. The NCEP/NCAR 40-year reanalysis project. Bulletin of the American Meteorological Society. 1996; 77: 437–471.
- Kejna M. Przebieg roczny temperatury powietrza na Antarktydzie. (Annual course of air temperature on the Antarctic.). Problemy Klimatologii Polarnej. 2002; 12: 5–19.
- King J.C. Turner J. Antarctic meteorology and climatology. Cambridge University Press. Cambridge, 1997
- Knox J.L. Hay J.E. Blocking signatures in the Northern Hemisphere: frequency distribution and interpretation. Journal of Climatology. 1985; 5: 1–16.
- Lipowska S. Zmiennos( przestrzenna wyst(powania zim bezjadrowych na Antarktydzie w latach 1990–1999. (Spatial variability of the occurrence of coreless winters on the Antarctic in years 1990–1999.). Problemy Klimatologii Polarnej. 2004; 14: 19–28.
- Nordli P.Ø. Temperature and precipitation series at Norwegian Arctic meteorological stations. DNMI Klima Report 40/90. Norwegian Meteorological Institute. Oslo, 1990
- Nordli P. !Ø. Førland E.J. Niedzwiedz T. Wind-chill temperature at Svalbard and Jan Mayen. DNMI Klima Report 07/00. Norwegian Meteorological Institute. Oslo, 2000
- Przybylak R. Temporal and spatial variation of surface air temperature over the period of instrumental observations in the Arctic. International Journal of Climatology. 2000; 20: 587–614.
- Rogers J.C. Yang L. & Li L. 2005. The role of Fram Strait winter cyclones on sea ice flux and on Spitsbergen air temperatures. Geophysical Research Letters 32. L06709, 10.3402/polar.v30i0.12218.
- Rubinshteyn Y.S. Warm core and coreless winters. Soviet Geography. 1962; 3: 14–29.
- Serreze M.C. Barry R.G. Synoptic activity in the Arctic Basin, 1979–85. Journal of Climate. 1988; 1: 1276–1295.
- Serreze M.C. Box R.G. Barry R.G. Walsh J.E. Characteristics of Arctic synoptic activity. Meteorology and Atmospheric Physics. 1993; 51: 147–164.
- Serreze M.C. Kahl J.D. Schnell R.C. Low-level temperature inversions of the Eurasian Arctic and comparisons with Soviet drifting station data. Journal of Climate. 1992; 5: 615–629.
- Steffensen E.L. The climate at Norwegian Arctic stations. Klima 5. Norwegian Meteorological Institute. Oslo, 1982
- Styszyńska A. The origin of coreless winters in the South Shetlands area (Antarctica). Polish Polar Research. 2004; 25: 45–66.
- Umemoto T. Warm-core events of the Arctic winters appeared in the annual march of the monthly mean air temperatures. Sundai Historical Review. 1998; 103: 79–94.
- Van Loon H. The half-yearly oscillations in middle and high southern latitudes and the coreless winter. Journal of Atmospheric Science. 1967; 24: 472–486.
- Ward J.H. Hierarchical grouping to optimize an objective function. Journal of the American Statistical Association. 1963; 58: 236–244.
- Wendler G. Kodama Y. The kernlose winter in Adelie Coast. Antarctic meteorology and climatology: studies based on automatic weather stations. Bromwich D.H. Stearns C.R. American Geophysical Union. Washington D.C, 1993
- Wexler H. The kernlose winter in Antarctica. Geophysica. 1958; 6: 577–595.