Abstract
We assess the volume change and mass balance of three ice caps in southern Iceland for two periods, 1979–1984 to 1998 and 1998 to 2004, by comparing digital elevation models (DEMs). The ice caps are Eyjafjallajökull (ca. 81 km2), Tindfjallajökull (ca. 15 km2) and Torfajökull (ca. 14 km2). The DEMs were compiled using aerial photographs from 1979 to 1984, airborne Synthetic Aperture Radar (SAR) images obtained in 1998 and two image pairs from the SPOT 5 satellite's high-resolution stereoscopic (HRS) instrument acquired in 2004. The ice-free part of the accurate DEM from 1998 was used as a reference map for co-registration and correction of the vertical offset of the other DEMs. The average specific mass balance was estimated from the mean elevation difference between glaciated areas of the DEMs. The glacier mass balance declined significantly between the two periods: from −0.2 to 0.2 m yr−1 w. eq. during the earlier period (1980s through 1998) to −1.8 to −1.5 m yr−1 w. eq. for the more recent period (1998–2004). The declining mass balance is consistent with increased temperature over the two periods. The low mass balance and the small accumulation area ratio of Tindfjallajökull and Torfajökull indicate that they will disappear if the present-day climate continues. The future lowering rate of Eyjafjallajökull will, however, be influenced by the 2010 subglacial eruption in the Eyjafjallajökull volcano.
Iceland is located in the North Atlantic Ocean (), at the confluence of air/water masses from the mid-latitudes and from the Arctic. About 11% of Iceland is covered by glaciers, all of which are temperate, have a high annual mass turnover and are highly sensitive to climate fluctuations (e.g., Björnsson Citation1979; Björnsson & Pálsson Citation2008). Glacier meltwater is mainly delivered directly to rivers but in places considerable volumes are delivered to groundwater aquifers. Glacier river discharge provides a significant portion of the river water that is harnessed by hydroelectric power plants. Changes in runoff are important for the design and operation of power plants as well as for the constructions of roads and bridges.
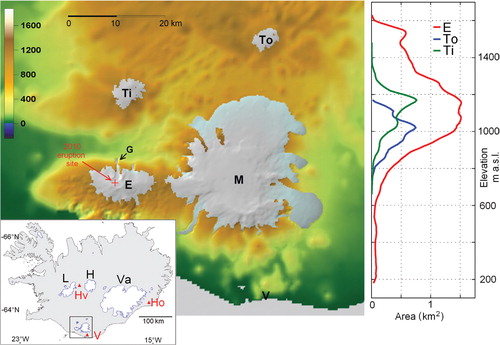
Fig. 1. Eyjafjallajökull (E), Tindfjallajökull (Ti), Torfajökull (To) and Mýrdalsjökull (M) ice caps. The Gígjökull outlet glacier (G) of Eyjafjallajökull is also indicated. The inset map of Iceland shows the location of the study area as well as Langjökull (L), Hofsjökull (H) and Vatnajökull (Va) ice caps and these weather stations: Vík (V) in Mýrdalur (15 m a.s.l., ca. 30 km south-east of Eyjafjallajökul), Hveravellir (Hv; 641 m a.s.l., ca. 100 km north of Tindfjallajökull and Torfajökull) and Hólar (Ho) in Hornafjördur (18 m a.s.l.). The plot shows the elevation distribution of the Eyjafjallajökull, Tindfjallajökull and Torfajökull ice caps as area (km2) per 10 m elevation interval.
Icelandic glaciers are currently melting at a fast rate. Over recent decades, annual mass balance field observations on the three largest ice caps in Iceland—Langjökull (ca. 900 km2), Hofsjökull (ca. 890 km2) and Vatnajökull (ca. 8100 km2)—show a declining specific mass balance from about 0 m yr−1 w. eq. on average from 1980 to 1994 to −1 to −1.3 m yr−1 w. eq. on average after 1995 (Björnsson et al. Citation2002; Sigurdsson et al. Citation2004; Pálsson et al. Citation2007; Björnsson & Pálsson Citation2008; Gudmundsson et al. Citation2009). This is consistent with the warming in Iceland that has taken place since 1994 (e.g., Björnsson et al. Citation2005; Jóhannesson et al. Citation2007). Modelling studies have shown that these large ice caps could lose most of their mass within 200–300 years (e.g., Adalgeirsdóttir et al. Citation2005; Adalgeirsdóttir et al. Citation2006) and the most recent model runs, using a revised climate change scenario, predict that these ice caps will disappear even faster, within 150–200 years (Gudmundsson et al. Citation2009).
Observations of mass balance and volume change commonly serve as key inputs in studies of glacier response to present-day climate variations as well as to calibrate models used to predict the future outlook of glaciers. Annual mass balance observations at locations of stakes have been conducted on the three largest ice caps in Iceland. Such observation methods are time consuming, expensive and infeasible for inaccessible or steep and crevassed mountain glaciers. For a more comprehensive view of glacier changes in Iceland, we aim at obtaining volume and mass balance changes by remote-sensing methods, i.e., by comparing recent elevation maps produced from remote-sensing data to older available maps (e.g., Berthier et al. Citation2004; Magnússon et al. Citation2005a). This approach provides results over large areas in contrast to the few points that traditional mass balance observations yield.
In this paper we use multi-temporal digital elevation models (DEMs; ), obtained by both satellite and airborne remote sensors, to estimate changes in the volume and the specific mass balance of the Eyjafjallajökull, Torfajökull and Tindfjallajökull ice caps over two periods, from 1979–1984 to 1998 and from 1998 to 2004, investigating a phase of climate-driven glacier changes prior to the 2010 subglacial eruption in the Eyjafjallajökull volcano. No traditional mass balance observations are available from these small ice caps that are located in and close to the most maritime climate in Iceland. The ice dynamics have not been studied but our reconnaissance flights over the last decades have not revealed any surges.
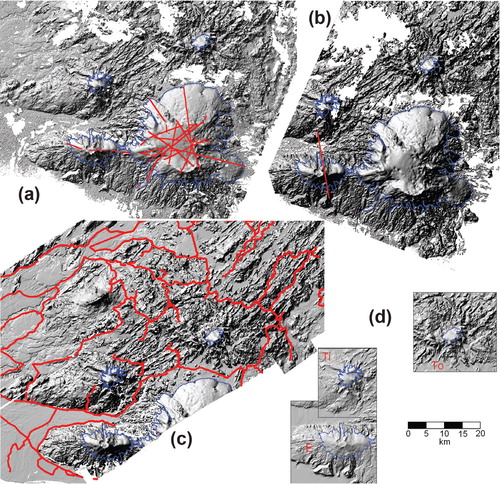
Fig. 2. Shaded relief images of the Eyjafjallajökull (E), Tindfjallajökull (Ti), Torfajökull (To) and Mýrdalsjökull ice caps and surrounding glacier free areas, based on digital elevation maps derived from: (a) SPOT 5 high-resolution stereoscopic images from 5 October 2004; (b) SPOT 5 HRS from 14 August; (c) Electromagnetic Institute Synthetic Aperture Radar Sensor (EMISAR) images from 12 August 1998; and (d) aerial photographs from 1979 (Torfajökull), 1980 (Tindfjallajökull) and 1984 (Eyjafjallajökull). Gaps in (a) and (b) allocate uncorrelated parts of the SPOT 5 HRS image pairs. Red indicates (a) airborne radar altimetry observed seasonally from 2004 to 2007, (b) the line of seasonal Ice, Cloud, and Land Elevation Satellite (ICESat) laser elevation data used in this study, observed from 2004 to 2007 and (c) global positioning system (GPS) profiles and sparse GPS observations at ice-free areas. Blue in (a–d) indicates the ice cap margins.
The three ice caps under consideration are all located on active volcanoes. The most hazardous of those is the central volcano underneath the Eyjafjallajökull ice cap that started erupting in April 2010 (CitationGudmundsson et al. 2010). It is evident from field surveys, reconnaissance flights as well as aerial and satellite photographs that the glacier surfaces of Eyjafjallajökull and Tindfjallajökull showed no evidence of active subglacial geothermal areas over the time period from the 1980s to 2004 and only small, localized geothermal areas have been identified beneath Torfajökull. Hence, the influence of subglacial geothermal heat on the total mass balance from the 1980s to 2004 is small and can be neglected. Knowledge of ice volume changes is important for estimating pressure release on underlying volcanoes as well as to quantify the amount of ice available for hazardous floods during a subglacial eruption. Observations of ice volume changes are needed when interpreting long-term continuous tilting, global positioning system (GPS) levelling observations and displacement maps derived from Interferometric Synthetic Aperture Radar (InSAR) that are available for ice-free areas around Eyjafjallajökull to monitor inflation and deflation of the volcano (e.g., Pinel et al. Citation2007; CitationGudmundsson et al. 2010) both before and after the 2010 eruption.
Data and methods
The multi-temporal DEMs are constructed from the best available Defense Mapping Agency (DMA) aerial photographs taken between 1979 and 1984 in south Iceland, airborne Synthetic Aperture Radar (SAR) images obtained on 12 August 1998 by the Electromagnetic Institute (EMI), Technical University of Denmark and high-resolution stereoscopic (HRS) images taken by the SPOT 5 satellite on 14 August and 5 October 2004 (; e.g., Korona et al. Citation2009). Elevations of the ice caps and surrounding ice-free areas were used to constrain, correct and evaluate the elevation maps. The global positioning system (GPS) profiles on roads (c) were also collected for this purpose. Some of the data were processed using kinematic phase correction and some by using code correction; a vertical accuracy of 1–1.3 m may be expected on the average (Hofmann-Wellenhof et al. Citation1992; Magnússon Citation2003: 29). Several ground control points (GCP) were available, measured with geodetic GPS survey instruments close to the Eyjafjallajökull and Mýrdalsjökull ice caps and at nunataks. Airborne radar altimetry surveys have been conducted in the accumulation areas of the nearby Mýrdalsjökull in May and September–November each year since October 1999 and in the ablation areas in September–November each year since 2004, as well as at a few profiles on Eyjafjallajökull in September–November 1999, 2001 and 2004–2007 (a). The relative error is 1–2 m while the absolute accuracy is 3 m (Högnadóttir & Gudmundsson Citation2006; Gudmundsson et al. Citation2007).
The most accurate glacier map is the EMISAR DEM (<2 m accuracy in elevation for 5-m×5-m spatial resolution and ca. 5-m positioning accuracy), pre-processed using a cross-calibration of single-pass interferometeric C-band synthetic aperture radar data (Dall Citation2003) and further corrected and error estimated with available GCP and differential GPS driven profiles on roads at ice-free areas (; Magnússon Citation2003: 29–31; Magnússon et al. Citation2005a). The surface of all the ice caps on 12 August 1998 consisted mainly of ice and wet firn, yielding a dominating surface backscatter C-band signal (5.6-cm wavelength) with negligible backscatter from the shallow ice and wet snow penetrating parts of the signal. The signal penetration is typically less than half the wavelength in wet snow—1 to 2 cm for C-band (e.g., Ulaby et al. Citation1986; Rott & Davis Citation1993)—and less for wet and dirty summer ice surface. Hence, it is justified to assume that the C-band EMISAR topography closely follows the glacier surfaces and that errors due to signal penetration can be neglected.
The HRS sensor onboard SPOT 5 acquires high-resolution along-track stereoscopic images (pixel size of 5 m along track and 10 m across track) with ±20° forward and backward viewing angles (Bouillon et al. Citation2006; Berthier & Toutin Citation2008). The August 2004 HRS DEM was obtained from the SPOT 5 Stereoscopic Survey of Polar Ice: Reference Images and Topographies (SPIRIT) project (Korona et al. Citation2009). The DEM was delivered with 40-m×40-m spatial resolution, 15-m root mean square accuracy in position and a vertical accuracy better than 5 m in ice-free gentle relief areas and 10 m at higher relief areas with slopes less than 20% (Bouillon et al. Citation2006; Berthier & Toutin Citation2008). A mask including stereo image correlation scores was delivered as a SPIRIT bi-product and used in this study to exclude uncorrelated pixels from the DEM.
We constructed the 2004 October 5 SPOT 5 HRS DEM using Geomatica software (PCI Geomatics; Toutin Citation2006), constrained with a wealth of GPS GCPs in non-glaciated areas. The resulting DEM was further corrected and evaluated using all available profile and point observations both on and away from the glaciers (a,c).
The DMA paper maps consist of 20-m contour lines produced by the DMA Hydrographic/Topographic Center in Washington, D.C. using the best available aerial photographs, from 1979 for Torfajökull, 1980 for Tindfjallajökull and 1984 for Eyjafjallajökull, all acquired in late summer. We digitized the contour lines and created regular 40 m×40 m DEMs by interpolating the contour lines, using a kriging method (e.g., Wise Citation2000). The vertical error of those DEMs is cautiously estimated to 10 m when interpolating over rough mountain areas and more than two times less (<5 m) for gentle terrain and smooth glacier topography (from our long experience of interpreting DMA paper maps at and around Icelandic glaciers and comparison to both more accurate DEMs and GCPs).
Here, we use the EMISAR DEM, pre-corrected with in situ observations, as a reference elevation map for co-registering both the SPOT 5 HRS and DMA elevation maps. For each of the three ice caps under consideration, the horizontal displacement of the HRS and DMA DEMs (40-m×40-m spatial resolution) relative to the EMISAR DEM (5-m×5-m spatial resolution) was eliminated by both maximizing the correlation and minimizing the standard deviation of the elevation differences of ice-free areas in the vicinity of the glaciers (gently sloping areas within ca. 80–800 m away from the glacier margins). This was done by shifting the x and y coordinates of the 40-m×40-m DEMs in 5-m steps and calculating the correlation to the corresponding values of the 5-m×5-m EMISAR DEM. In all cases, both the maximum correlation and minimum standard deviation yielded the same shift. After the co-registration, the same ice-free areas were used to correct the vertical offset of the DMA and HRS DEMs relative to the EMISAR DEM.
Maps of elevation changes of Eyjafjallajökull, Tindfjallajökull and Torfajökull ice caps were calculated as the difference between the available multi-temporal elevation maps (). Missing areas in both the EMISAR and HRS DEMs resulted in gaps in the differential maps. The small amount of gaps (<5%) in the smoothly varying 1980s to 1998 differential maps (from the DEMs in c, d) were interpolated by using the routine “roifill” in Matlab® (MathWorks), which smoothly fills gaps in images by interpolating inward from the pixel values on the boundary of the polygon through solving Laplace's equation. The 1998–2004 differential maps of Eyjafjallajökull and Torfajökull were calculated as the August 2004 DEM minus the August 1998 DEM. Uncorrelated areas in the August 2004 DEM were first filled by smoothly adjusting the October 2004 DEM to the August 2004 DEM individually for each gap (seasonal correction). The small amounts of remaining gaps (<1%) were then smoothly interpolated by using “roifill” in Matlab. A large fraction of Tindfjallajökull was decorrelated in the August 2004 DEM but not in the October 2004 DEM. Hence, about one-third of the 1998–2004 differential map of Tindfjallajökull is based on the difference between the August 1998 DEM and the seasonal corrected October 2004 DEM.
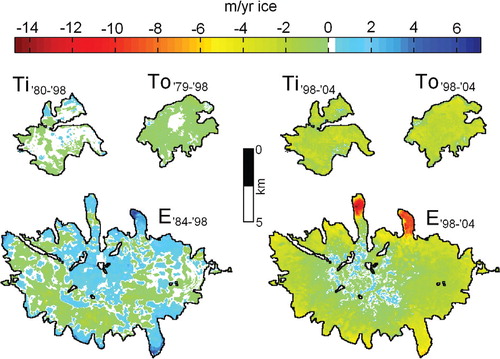
Fig. 3. Maps of annual average elevation changes over the periods displayed as subscripts of Eyjafjallajökull (E), Tindfjallajökull (Ti) and Torfajökull (To). Spatial resolution: 40 m×40 m.
The area (A) of the ice caps during various years from the 1980s to 2004 was estimated by digitizing the glacier margins using (1) Landsat images acquired in the autumns of 1984 and 1996, (2) the SPOT 5 HRS images used to construct the DEMs, (3) ortho-corrected SPOT 5 high-resolution geometric (HRG) images with 2.5-m×2.5-m spatial resolution, acquired in the autumn 2003 and (4) airborne polarimetric synthetic aperture radar images observed simultaneously to the 1998 EMISAR images and the EMISAR DEM viewed as a shaded relief image (Magnússon et al. Citation2005b).
We estimate the average specific net mass balance (in m yr−1 w. eq.) as1 where N is the number of years between the elevation maps, A
1
is the average area (m2) of the ice cap over N years, ρ is the scaling factor from the density of ice (900 kg m−3) to water (1000 kg m−3),
2 is the total volume loss (m3), Δ
is the N year area-average elevation change (m) for the whole ice cap and A
2 is the maximum area (m2) of the ice cap.
In this study we use data from two meteorological stations—Vík in Mýrdalur, close to the ice caps and about 2 km from the coastline and Hveravellir in central Iceland ()—to estimate the mass balance sensitivity to summer and annual temperature variations. Those stations were selected as they include temperature records reaching back to 1979 and describe the different climate conditions south and north of the ice caps and hence the trend in their regional climate. The climate record from Vík in Mýrdalur is close to the ice cap but temperatures there are temperated by the proximity to the ocean, while Hveravellir reflects inland temperatures and is less influenced by the coastal climate.
Error estimation
Both co-registration and offset correction of the HRS and DMA maps, relative to the EMISAR DEM, are crucial steps before calculating surface elevation changes. Ice-free areas close to the ice caps were used to estimate the north and east shifting as well as the vertical offset of the HRS and DMA maps relative to the EMISAR DEM. This shifting of the August 2004 HRS DEM was calculated as 15–20 m east and 5–10 m north for the ice caps () or ≤0.5 pixels east and ≤0.25 pixels north. For the ice caps, we found the mean elevation differences, µ∈[−0.6, 0.2] m and their standard deviations, σ∈[4, 6] m (depending on the ice cap; ) between the EMISAR DEM and the co-registered August 2004 HRS DEM. Given the high accuracy of the EMISAR DEM (<2 m in elevation ca. 5 m accuracy in location) and the low numbers in , we can conclude that the errors of the uncorrected August 2004 HRS DEM, processed by using no check against any ground truth observations, are within the nominal 15-m root mean square accuracy in position and 5 m in elevation given by Bouillon et al. (Citation2006).
Table 1. Estimated east and north shifting, and vertical offset (mean/standard deviation: µ/σ) of the 2004 October SPOT 5 high-resolution stereoscopic (HRS) and Defense Mapping Agency (DMA) digital elevation maps (DEMs) relative to the Electromagnetic Institute Synthetic Aperture Radar Sensor derived DEM at ice-free areas in the nearest vicinity of the Eyjafjallajökull (E), Torfajökull (To) and Tindfjallajökull (Ti) ice caps ().
After correcting for the relative shifts and offsets in , possible residual elevation biases of the HRS and DMA maps relative to the EMISAR map (δh) were estimated by selecting four to six ice-free areas for each ice cap both close to and far away from the ice caps (up to ca. 15 km) that spanned all the elevation ranges of the DEMs. These areas were selected to be from one to three times the glaciated areas in size. Some of the test areas include steep mountains (we allowed slopes up to 20°), while other feature gentle terrain similar to the smooth glacier surfaces. The residual bias was estimated to be always lower than 0.5 m for gentle terrain close to the ice caps for both the HRS and DMA maps and, at most, 0.6 m for the HRS maps and 1–2 m for the DMA maps in ice-free areas of steep relief. Here, we use the highest values as a conservative empirical estimate of δh for the smooth glaciated areas ().
Table 2. Conservatively estimated residual vertical offsets (δh) between the elevation maps and errors of estimating the area (δA) of the Eyjafjallajökull (E), Torfajökull (To) and Tindfjallajökull (Ti) ice caps.
The error in estimating the time evolution of the area (δA) in was determined by quantitatively comparing the variation between the digitized glacier margins. Errors due to snow remaining in nearby mountain areas at the end of the melt season as well as ash and sand layers that are frequently exposed in the ablation areas of the ice caps were also quantified and included in the estimate of (δA).
Results and discussion
During the first period from 1979–1984 to 1998, ice flow compensated for the ablation in the lowest parts of Tindfjallajökull and also more or less in the lower ablation areas of Eyjafjallajökull and Torfajökull (, ); there was mass gain in the lowest three narrow outlet glaciers of Eyjafjallajökull and mass loss in the lowest parts of Torfajökull. In contrast, all the ice caps retreated rapidly during the warmer period from 1998 to 2004 (periods 1 and 2 in ), when 3–5 m yr−1 w. eq. thinning rate was obtained on the lowest parts of Torfajökull and Tindfjallajökull (reaching down to 700–800 m a.s.l.) and up to 14 m yr−1 w. eq. thinning rate on the lowest part of the Gígjökull outlet of Eyjafjallajökull, down to 200 m a.s.l. in 2004 ().
Fig. 4. Scatter plots of elevation changes versus altitude for the three ice caps examined in this study. The data are extracted from and have been scaled to water equivalence by using the density 900 kg/m3 for ice.
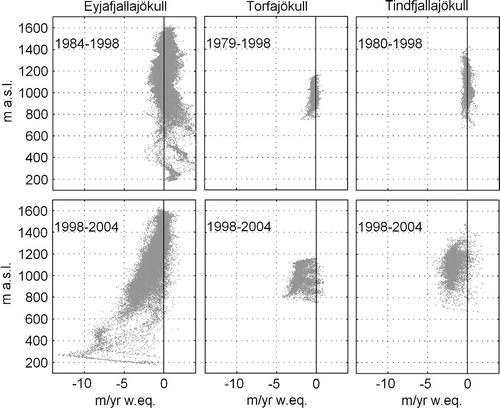
Table 3. (a) Average specific net balance (b n ), at the Eyjafjallajökull (E), Torfajökull (To) and Tindfjallajökull (Ti) ice caps, estimated as the mean difference between available elevation maps for time period 1 and 2. (b, c) Corresponding temperature (T) and precipitation (P) at the Vík and Hveravellir weather stations averaged over all the seasons covered by the differential digital elevation maps. The cold and dry years from 1979 to 1984 are included in the mass balance calculation for Torfajökull and Tindfjallajökull ice caps but not for Eyjafjallajökull.
The mass balance was close to zero (from −0.2 to 0.2 m yr−1 w. eq.) for the first period but declined to −1.8 to −1.5 m yr−1 w. eq. for the latter period (). The corresponding errors in are derived by applying the standard error formula to Eqns. 1 and 2, yielding the approximation3 where A=(A
1+A
2)/2 and δh and δA are uncertainties given in . The assumption of using only density of ice in Eqn. 1 is acceptable for the first period due to the long time span (14–19 years) and the close to zero mass balance. The latter period (1998–2004), is an extension of the warming that took place after 1994. The accumulation area ratio (AAR; e.g., Paterson Citation1994) is not known for 1998. However, we believe that the possible underestimation of b
n
in due to volume decrease of firn in the accumulation zone (typical density of 600 kg m−3 observed on other ice caps in Iceland [e.g., Björnsson et al. Citation2002; Icelandic Glaciological Society, unpubl. data]) is no more than −0.05 m yr−1 w. eq. at Eyjafjallajökull when cautiously assuming 50% AAR in 1998 and gradually reducing with time towards the observed 25% AAR in 2004 (a). The underestimation of b
n
at Torfajökull and Tindfjallajökull is expected to be smaller due to very low AAR (a). Hence, it corresponds only to a small fraction of the given uncertainties over the six-year period. Further, we assume the effect of snow compaction to be negligible.
Table 4. (a) Accumulation area ratio (AAR) in the autumn of 2004, at the Eyjafjallajökull (E), Torfajökull (To) and Tindfjallajökull (Ti) ice caps. (b, c) Estimated mass balance sensitivity to 1 °C temperature rise at the Vík and Hveravellir weather stations, using averages over (1) all the seasons covered by the mass balance observations and (2) only the corresponding summer months (June–August); a 2 to 5% increase in precipitation is ignored. Note: the lower sensitivity at Tindfjallajökull and Torfajökull ice caps compared to Eyjafjallajökull may mainly reflect the cold and dry years from 1979 to 1984 included in the mass balance calculation for Tindfjallajökull and Torfajökull but not for Eyjafjallajökull, rather than an actual sensitivity difference. Effects of cold and dry years are ignored in the uncertainty calculation.
Coupled ice dynamic and mass balance modelling of the largest ice caps in Iceland—Hofsjökull (890 km2),Vatnajökull (8100 km2) and Langjökull (900 km2)—has been based on the assumption that they were close to equilibrium for the climate conditions from 1981 to 2000 (Adalgeirsdóttir et al. Citation2005; Adalgeirsdóttir et al. Citation2006; Gudmundsson et al. Citation2009). Our results indicate that the same applies to the three ice caps studied in this paper. The observed mean specific mass balance was about −1 m yr−1 w. eq. on both Hofsjökull and Vatnajökull and about −1.3 m yr−1 w. eq. for Langjökull for the period from 1998 to 2004 (Sigurdsson et al. Citation2004; Björnsson & Pálsson Citation2008; Gudmundsson et al. Citation2009), which is slightly less negative than for Eyjafjallajökull, Tindfjallajökull and Torfajökull over the same period ().
It is evident from the August and October 2004 SPOT 5 HRS images that there is currently no accumulation area anymore for Torfajökull and that the AAR is less than 5% for Tindfjallajökull (). The annual temperature of Vík in Mýrdalur in 2004 was ca. 0.4 °C higher than the average temperature from 1998 to 2002 but similar to the annual temperatures during 2003–2007. The low AAR and the high mass balance sensitivity (e.g., Jóhannesson Citation1997) to a uniform temperature rise () at both Torfajökull and Tindfjallajökull during the warm last decade are consistent with their low and narrow elevation range ().
An AAR of 20–25% is obtained for Eyjafjallajökull (using the same 2004 SPOT 5 HRS images), which is less than the AAR of about 35% obtained for the Langjökull ice cap in 2004; the AAR of Langjökull has varied between 20 and 45% over the last decade (Pálsson et al. Citation2007). This is in agreement with the more negative specific net mass balance on Eyjafjallajökull than Langjökull (−1.5 and −1.3 m yr−1 w. eq., respectively) for the period from 1998 to 2004.
The mean elevation of Eyjafjallajökull is higher than for Torfajökull and Tindfjallajökull (). This glacier is located at the south coast, the most maritime region of Iceland; the annual precipitation has been about 2.4 m yr−1 on average at the nearby weather station of Vík in Mýrdalur over the last decades (; ). For comparison, a much lower annual precipitation of about 0.7 m yr−1 has been observed at the weather station Hveravellir in central Iceland over the same period () and 1.8 m yr−1 at the weather station Hólar in Hornafjördur in south-east Iceland (). High winter accumulation rates (6–12 m yr−1 of snow) have been observed in the accumulation area of the nearby Mýrdalsjökull ice cap (), which is about 570 km2 in size, by using airborne radar altimetry (Högnadóttir & Gudmundsson Citation2006; Gudmundsson et al. Citation2007) and a few in situ mass balance measurements (Icelandic Glaciological Society unpubl. data). The elevation difference of Ice, Cloud and Land Elevation Satellite (ICESat) laser altimetry data (e.g., Zwally et al. Citation2002; Schutz et al. Citation2005; profile location in b) and the EMISAR DEM show changes up to 10 m between autumn and spring, indicating a thick winter snow pack at the highest flat part of the accumulation area of Eyjafjallajökull.
Temperature observations at both Hveravellir and Vík in Mýrdalur are used to examine the mass balance sensitivity to increase in temperatures (). The temperature rise from the first period 1979–1984 to 1998 to the later period 1998–2004 is 1.0–1.2 °C at Hveravellir in central Iceland and 0.7–0.85 °C at Vík in Mýrdalur, close to the coast (). No appreciable difference is obtained in the mass balance sensitivity calculated using the annual temperatures or only the summer temperatures. The high annual mass turnover of Eyjafjallajökull explains its high mass balance sensitivity. For comparison, the mass balance sensitivity of the more continental Langjökull and Hofsjökull to 1 °C annual temperature changes at Hveravellir, have been estimated as −1.15 and −0.76 m yr−1 °C−1, respectively (Gudmundsson et al. Citation2009). Values ranging from −0.20 to −2.93 m yr−1 °C−1 have been obtained by de Woul & Hock (Citation2005) and Hock et al. (Citation2009) in a study of a large number of glaciers around the globe (their highest values were reported for a glacier outlet of Vatnajökull in south-east Iceland).
The relatively small temperature changes at the coastal station Vík in Mýrdalur, compared to that of the inland station Hveravellir (), is reflected in the higher mass balance sensitivity to temperature changes at Vík compared to Hveravellir (). This is due to oceanic buffering of the coastal temperatures and points out that numerical values for mass balance sensitivities are quite dependent on the choice of the reference meteorological station, even when the stations are close to the glaciers, as in this study. Hence the numbers in should be taken as indicators of high mass balance sensitivities of the three ice caps rather than definite sensitivity values.
The 1998–2004 differential map was compared with the difference between the October 2004 airborne radar altimetry profiles of Eyjafjallajökull and the EMISAR-DEM (location in a). In both cases, the same distribution of elevation differences is obtained. The mean elevation change along the profile with respect to the EMISAR-DEM was found to be −0.9 m yr−1 w. eq. using the differential map and −0.95 m yr−1 w. eq. using the radar altimetry. The annual east-to-west oriented radar altimetry observations extend only down to 1000 m a.s.l. on Eyjafjallajökull and therefore cannot be used to obtain the specific net balance. However, by subtracting the radar altimetry profiles observed in the autumns of 2004–2007 from the EMISAR DEM, we obtain similar results in all cases (e.g., −1.0 m yr−1 w. eq. on average from 1998 to 2007 along the flight lines), indicating the same rapid thinning rate for 2004–2007 as observed from 1998 to 2004. This is consistent with the results of our in situ mass balance observations of the larger ice caps in Iceland (Björnsson & Pálsson Citation2008).
The ice thickness is not known for Tindfjallajökull and Torfajökull ice caps but is roughly estimated to be on the order of 50–150 m. It is evident from the maximum values of the ice thickness, the highly negative average specific mass balance from 1998 to 2004 and the close to 0% AAR (, ) that both ice caps will disappear completely within a century if the average climate of the last decade persists and within only a few decades if the warming scenarios proposed for Iceland occur (e.g., Jóhannesson et al. Citation2007). A thin layer of tephra was spread over Torfajökull and Tindfjallajökull during the 2010 eruption of the Eyjafjallajökull volcano. Also, insulating ash layers from earlier eruptions in Iceland have been observed at some of the lower parts of Tindfjallajökull. Hence, it is evident that the retreat of those ice caps may be affected by tephra; both by thin ash and dust blown over the ice caps that lowers the albedo and speeds up the melting as well as by exposure of old thick insulating tephra layers that prevent melting.
During the 2010 eruption in Eyjafjallajökull volcano, cauldron-sized holes were formed in the ice in the caldera at the centre of the ice cap (with ice reaching up to 1630 m a.s.l.) and lava flowing down the valley beneath the Gígjökull outlet melted ice in its paths (CitationGudmundsson et al. 2010; location in ). The observed fast retreat of Gígjökull outlet from 1998 to 2004 () indicates that the ice flow is at present insufficient to compensate for this extensive ice loss of the outlet. The subglacial topography of the Eyjafjallajökull ice cap has been surveyed at 256 locations on the ice cap (Strachan Citation2001). The uneven distribution of these measurements makes it difficult to estimate the total ice cap volume. However, the measurements show that the ice thickness exceeds 200 m in the high elevated caldera and hence the holes formed in the ice are expected to be filled with time. After the 2010 eruption, the thickness of the tephra reached at least 30 m next to the active craters and it is nowhere less than 5 cm on the ice cap (Earth Science Institute, University of Iceland, unpubl. data). This thick insulating tephra layer will in places slow down melting in the coming years. However, at higher elevations windblown tephra may lower the albedo of winter snow early in the spring and enhance melting. The combined effects of thicker ice, larger AAR as well as the 2010 tephra insulation should result in Eyjafjallajökull lasting considerably longer than the other two ice caps.
Conclusion
Maps of elevation changes, deduced by SPOT 5 HRS, EMISAR and aerial photographs, proved to be useful for observing the average specific mass balance of small Icelandic ice caps with areas from 15 to 80 km2 over periods from 6 to 20 years. The accuracy of estimated elevation changes was greatly improved by using the precise pre-corrected EMISAR DEM as a reference for co-registration and offset correction.
From 1979–1984 to 1998, the average specific mass balance was close to zero on Eyjafjallajökull, Tindfjallajökull and Torfajökull ice caps. In contrast, the average specific mass balance of the three ice caps was >1.5 m yr−1 w. eq. lower from 1998 to 2004 when the average temperature was ca. 1.2 °C warmer in central Iceland and ca. 0.7 °C warmer close to the south coast. A lowering rate of the ice surface of up to 14 m yr−1 was observed at an outlet of Eyjafjallajökull that reaches down to 200 m a.s.l. High mass balance sensitivity was estimated for the low elevation ice caps of Torfajökull and Tindfjallajökull and our remote-sensing data indicate that they currently contain little or no accumulation area. Hence, those ice caps are likely to disappear if the present-day climate persists. High mass balance sensitivity was also found for the maritime Eyjafjallajökull, which is consistent with its high annual mass turnover. The observed fast thinning rate over the last decade and the low present day AAR of only 20–25% indicates that the size of Eyjafjallajökull will be considerably reduced if the climate of the last 10–20 years continues. The climate driven retreat processes presented in this paper will, however, be influenced in the coming years by a thick insulating tephra layer spread over the ice cap during the 2010 eruption in the Eyjafjallajökull volcano. The complicated glacier–volcano interaction after the 2010 eruption calls for continued monitoring of the ice caps.
Acknowledgements
We acknowledge the support of the National Power Company of Iceland, the Public Roads Administration, the Research Fund of Iceland, the University Research Fund, the Nordic Project on Climate and Energy Systems, the Jules Verne French–Icelandic programme and the French Space Agency through the ISIS and TOSCA programmes. DEMs from aerial photographs were constructed by the Defense Mapping Agency Hydrographic/Topographic Center in Washington, D.C., and the Icelandic Geodetic Survey. Airborne EMISAR radar images were made available by the Institute for Electromagnetic Systems at the Technical University of Denmark, now the National Space Institute. SPOT 5 HRS images as well as SPOT 5 HRS digital elevation maps were made available by the Spot Image project Planet Action and the International Polar Year SPIRIT project. The ICESat data were provided by the National Snow and Ice Data Center (Boulder, CO), the Landsat images by the Earth Resources Observation and Science Center (Sioux Falls, SD), ortho-corrected SPOT5 HRG images by the National Land Survey of Iceland and meteorological observations by the Icelandic Meteorological Office. The authors thank the reviewers Geir Moholdt and Tómas Jóhannesson for their constructive comments on the article.
References
- Adalgeirsdóttir G, Gudmundsson G.H. & Björnsson H. 2005. The volume sensitivity of Vatnajökull ice cap, Iceland, to perturbations in equlibrium line altitude. Journal of Geophysical Research—Earth Surface. 110, F04001., 10.3402/polar.v30i0.7282.
- Adalgeirsdóttir G, Jóhannesson T, Björnsson H, Pálsson F. & Sigurdsson O. 2006. Response of Hofsjökull and southern Vatnajökull, Iceland, to climate change. Journal of Geophysical Research—Earth Surface. 111, F03001., 10.3402/polar.v30i0.7282.
- Berthier E, Arnaud Y, Baratoux D, Vincent C. & Rémy F. 2004. Recent rapid thinning of the “Mer de Glace” glacier derived from satellite optical images. Geophysical Research Letters. 31, L17401., 10.3402/polar.v30i0.7282.
- Berthier E. Toutin T. SPOT5-HRS digital elevation models and the monitoring of glacier elevation changes in north-west Canada and south-east Alaska. Remote Sensing of Environment. 2008; 112: 2443–2454. 10.3402/polar.v30i0.7282.
- Björnsson H. Glaciers in Iceland. Jökull. 1979; 29: 74–80.
- Björnsson H, Jónsson T. & Jóhannesson T. 2005. Comment on “Iceland as a heat island” by D.H. Douglass et al. Geophysical Research Letters. 3, L24714., 10.3402/polar.v30i0.7282.
- Björnsson H. Pálsson F. Icelandic glaciers. Jökull. 2008; 58: 365–386.
- Björnsson H. Pálsson F. Haraldsson H.H. Mass balance of Vatnajökull (1991–2001) and Langjökull (1996–2001), Iceland. Jökull. 2002; 51: 75–78.
- Bouillon A. Bernard M. Gigord P. Orsoni A. Rudowski V. Baudoin A. SPOT 5 HRS geometry performance: using block adjustments as a key issue to improve quality of DEM generation. ISPRS Journal of Photogrammetry and Remote Sensing. 2006; 60: 134–146. 10.3402/polar.v30i0.7282.
- Dall J. Cross-calibration of interferometric SAR data. IEE Proceedings—Radar Sonar and Navigation. 2003; 150: 177–183. 10.3402/polar.v30i0.7282.
- de Woul M. Hock R. Static mass balance sensitivity of Arctic glaciers and ice caps using degree-day approach. Annals of Glaciology. 2005; 42: 217–244. 10.3402/polar.v30i0.7282.
- Gudmundsson S. Björnsson H. Jóhannesson T. Adalgeirsdóttir G. Pálsson F. Sigurdsson S. Similarities and differences in the response of two ice caps in Iceland to climate warming. Hydrology Research. 2009; 40: 495–502. 10.3402/polar.v30i0.7282.
- Gudmundsson M.T. Högnadóttir T. Kristinsson A.B. Gudbjörnsson S. Geothermal activity in the subglacial Katla caldera, Iceland, 1999–2005, studied with radar altimetry. Annals of Glaciology. 2007; 45: 66–72. 10.3402/polar.v30i0.7282.
- Gudmundsson M.T. Pedersen R. Vogfjörd K. Thorbjarnardóttir B. Jakopsdóttir K. Roberts M.J. Eruptions of Eyjafjallajökull volcano, Iceland. Eos, Transactions of the American Geophysical Union. 2010; 91: 190–191. 10.3402/polar.v30i0.7282.
- Hock R, de Woul M, Radić V. & Dyurgero M. 2009. Mountain glaciers and ice caps around Antarctica make a large sea-level rise contribution. Geophysical Research Letters. 36, L07501., 10.3402/polar.v30i0.7282.
- Hofmann-Wellenhof B, Lichtenegger H. & Collins J. 1992. Global Positioning System. Theory and Practice. Springer-Verlag, Wien., New York.
- Högnadóttir T. Gudmundsson M.T. Ice cauldrons in the Katla caldera: data on temporal variations from airborne ground clearance radar RH-17-2006. Institute of Earth Sciences, University of Iceland. Reykjavík, 2006
- Jóhannesson T. The response of two Icelandic glaciers to climatic warming computed with a degree-day glacier mass balance model coupled to a dynamic glacier model. Journal of Glaciology. 1997; 43: 321–327.
- Jóhannesson T. Adalgeirsdóttir G. Björnsson H. Crochet P. Elíasson E.B. Gudmundsson S. Jónsdóttir J.F. Ólafsson H. Pálsson F. Rögnvaldsson Ó. Sigurðsson O. Snorrason Á. Sveinsson Ó.G.B. Thorsteinsson T. Effect of climate change on hydrology and hydro-resources in Iceland. OS-2007/011. National Energy Authority, Hydrological Service. Reykjavík, 2007
- Korona J. Berthier E. Bernard M. Rémy F. Thouvenot E. SPIRIT. SPOT 5 stereoscopic survey of polar ice: reference images and topographies during the fourth International Polar Year (2007–2009). ISPRS Journal of Photogrammetry and Remote Sensing. 2009; 64: 204–212. 10.3402/polar.v30i0.7282.
- Magnússon E. 2003. Airborne SAR data from S-Iceland: analyses, DEM improvements and glaciological application. MSc thesis, Department of Physics, University of Iceland.
- Magnússon E, Björnsson H, Dall J. & Pálsson F. 2005a. Volume changes of Vatnajökull ice cap, Iceland, due to surface mass balance, ice flow, and subglacial melting at geothermal areas. Geophysical Research Letters. 32, L05504., 10.3402/polar.v30i0.7282.
- Magnússon E. Björnsson H. Dall J. Pálsson F. The 20th century retreat of ice caps in Iceland derived from airborne SAR: W-Vatnajökull and N-Mýrdalsjökull. Earth and Planetary Science Letters. 2005b; 237: 508–515. 10.3402/polar.v30i0.7282.
- Paterson W.S.B. The physics of glaciers3rd edn. Elsevier. Oxford, 1994
- Pálsson F. Björnsson H. Gudmundsson S. Afkomu- og hraðamælingar á Langjökli jökulárið 2006–2007. (Mass balance and velocity observations on Langjökull 2006–2007.) RH-22-2007. Institute of Earth Sciences, University of Iceland. Reykjavík, 2007
- Pinel V, Sigmundsson F, Sturkell E, Geirsson H, Einarsson P, Gudmundsson M.T. & Högnadóttir T. 2007. Discriminating volcano deformation due to magma movements and variable surface loads: application to Katla subglacial volcano, Iceland. Geophysical Journal International. 169, 325–338. 10.3402/polar.v30i0.7282.
- Rott H. Davis R.E. Multifrequency and polarimetric SAR observations on alpine glaciers. Annals of Glaciology. 1993; 17: 98–104.
- Schutz B.E, Zwally H.J, Shuman C.A, Hancock D. & DiMarzio J.P. 2005. Overview of the ICESat mission. Geophysical Research Letters. 32, L21S01., 10.3402/polar.v30i0.7282.
- Sigurdsson O, Thorsteinsson T, Ágústsson S.M. & Einarsson B. 2004. Afkoma Hofsjökuls 1997–2004. (Mass balance of Hofsjökull 1997–2004.) OS-2004/029. Reykjavík: National Energy Authority, Hydrological Service.
- Strachan S.M. 2001. A geophysical investigation of the Eyjafjallajökull glaciovolcanic system, south Iceland, using radio echo sounding. PhD thesis, University of Edinburgh.
- Toutin T. Generation of DSMs from SPOT5-HRS and across-track HRG stereo data using spatiotrianglulation and autocalibration. ISPRS Journal of Photogrammetry and Remote Sensing. 2006; 60: 170–181. 10.3402/polar.v30i0.7282.
- Ulaby F.T. Moore R.K. Fung A.K. Microwave remote sensing, from theory to applications. Artech House. Dedham MA, 1986
- Wise S.M. Assessing the quality for hydrological applications of digital elevation models derived from contours. Hydrological Processes. 2000; 14: 1909–1929. 10.3402/polar.v30i0.7282.
- Zwally H.J. Schutz B.E. Abdalati W. Abshire J. Bentley C. Brenner A. Bufton J. Dezio J. Hancock D. Harding H. Herring T. Minster B. Quinn K. Palm S. Spinhirne J. Thomas R. ICESat's laser measurements of polar ice, atmosphere, ocean, and land. Journal of Geodynamics. 2002; 34: 405–445. 10.3402/polar.v30i0.7282.