Abstract
The visible reflectance spectroscopy (VRS) and chlorophyll a concentration were determined in three sediment profiles collected from East Antarctica to investigate the potential application of VRS in reconstructing historical changes in Antarctic lake primary productivity. The results showed that the appearance of a trough at 650–700 nm is an important marker for chlorophyll a concentration and can therefore be used to distinguish the sedimentary organic matter source from guano and algae. The measured chlorophyll a content had significant positive correlations with the trough area between 650 and 700 nm, and no distinct trough was found in the sediments with organic matter completely derived from guano. Modelling results showed that the spectra spectrally inferred chlorophyll a content, and the measured data exhibit consistent trends with depth, showing that the dimensionless trough area can serve as an independent proxy for reconstructing historical fluctuations in the primary production of Antarctic ponds. The correlation of phosphorus (P) with measured and inferred chlorophyll a contents in ornithogenic sediments near penguin colonies indicates that the change in primary productivity in the Antarctic ponds investigated was closely related to the amount of guano input from these birds.
Polar regions are sensitive to global environmental changes, and they are important sites for studying palaeoecology and palaeoclimatology at different spatial and temporal scales. Lacustrine sediments from lakes in ice-free areas of Antarctica, with relatively high resolution and continuity are ideal materials for reconstructing palaeoenvironmental records (Hodgson et al. Citation2001; Squier et al. Citation2002; Hodgson et al. Citation2004; Liu et al. Citation2007). Sedimentological and geochemical studies of lake sediments from Polar regions are especially helpful in reconstructing palaeoclimate and palaeoecology (Hodgson et al. Citation2004; Liu et al. Citation2007). In palaeolimnological studies, traditional proxies such as organic matter, biogenic silica, pigments and other bio-geochemical indicators are widely used to indicate change in lake primary productivity, but the chemical analyses for these indices are generally time-consuming and relatively expensive (Foley et al. Citation1998; Liu et al. Citation2011). Additionally, logistical constraints in remote Antarctic areas mean that the samples are always insufficient for multiple chemical analyses in the laboratory. A faster, more efficient and economical method is needed to facilitate the reconstruction of palaeoproductivity in Polar lakes and to improve our understanding of the effects of climate change on lake ecology.
Reflectance spectroscopy is a technology that allows rapid estimates of chemical composition based on the optical properties of different kinds of organic matter (Kooistra et al. Citation2001; Pasquini Citation2003; Font et al. Citation2004; Wolfe et al. Citation2006). Recently, near-infrared reflectance spectroscopy has been widely considered as an important method for compositional analysis of various chemical constituents in soil, sediment and biological samples (Korsman et al. Citation1992; Nilsson et al. Citation1996; Korsman et al. Citation1999; Font et al. Citation2004; Cohen et al. Citation2005; Das et al. Citation2005; Michelutti et al. Citation2005; Wolfe et al. Citation2006; Michelutti, Blais, Cumming et al. Citation2010; Liu et al. Citation2011). Visible reflectance spectroscopy (VRS) has been successfully used in the study of palaeoproductivity changes in Arctic lakes because of its cost-effective and non-destructive features (Das et al. Citation2005; Michelutti et al. Citation2005). For example, Michelutti et al. (Citation2005) found that the trough area of a reflectance spectrum around 675 nm has a linear relationship with chlorophyll a content in Arctic lake sediments, and they inferred that the primary productivity of Arctic lakes increased with global warming. In the laboratory, the corresponding relation between trough area around 675 nm and chlorophyll a concentration has been further confirmed by the simulation method (Das et al. Citation2005; Wolfe et al. Citation2006). Additionally, nutrients derived from animal excrement can impact the structure and function of local ecosystems, particularly in remote polar areas (Polis et al. Citation1997). In the Arctic, previous studies have showed that seabird activity can greatly increase lake primary productivity and influence the lake ecosystem (Michelutti, Blais, Cumming et al. Citation2010; Michelutti, Blais, Mallory et al. Citation2010). Up to now, VRS has been widely used in the rapid reconstruction of historical changes in lake and pond productivity and trophic status in high-latitude Arctic lakes (Das et al. Citation2005; Wolfe et al. Citation2006; Das Citation2007; Michelutti, Blais, Cumming et al. Citation2010; Trachsel et al. Citation2010). However, this technology has not yet been applied to Antarctic lakes.
The study reported upon here serves as a comparative study in an Antarctic region with extreme climatic conditions. VRS and chlorophyll a concentrations were analysed in three sediment profiles from the Ross Sea region, East Antarctica. The influence of penguin guano on the investigated lakes and ponds was also considered.
Study area and sample collection
We collected sediment samples from Ross Island and Beaufort Island in the Ross Sea area (). The Ross Sea is a deep bay of the Southern Ocean in Antarctica. This region receives the influence from land, sea and ice shelf, making it highly sensitive to climate change. The weather in this region is severe due to the conjunction of three different air masses from Victoria Land, Ross Sea and Ross Ice Shelf (Monaghan et al. Citation2005). With an area about 2460 km2, Ross Island is a volcanic island and lies across the McMurdo Sound from Victoria Land. Capes Crozier, Bird and Royds are three ice-free areas on this island. Capes Bird and Royds are on the west coast and Cape Crozier is on the eastern side of Ross Island (Broady Citation1989). A large number of Adélie penguin (Pygoscelis adeliae) rookeries are located at all three areas, forming one of the largest concentrations of this species in Antarctica. Beaufort Island (ca. 18.4 km2), located 21 km north of Ross Island, is also occupied by many breeding Adélie penguins at the eastern and southern ends of the island. In addition to the modern penguin colonies, numerous abandoned penguin colonies also exist in the study areas, allowing for palaeoecological investigations (Emslie et al. Citation2003; Emslie & Woehler Citation2005; Emslie et al. Citation2007). Freshwater algae and cyanobacteria are widely distributed among ponds and catchments near the penguin colonies. The weather here is typically cold and dry, with low precipitation.
Fig. 1 Map of East Antarctica showing the sampling sites.
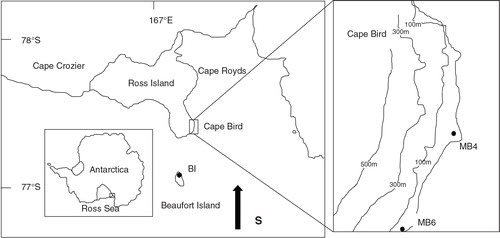
MB4 and MB6 profiles were collected from Cape Bird and BI from Beaufort Island (). Core MB4 was collected in a small dry pond between the fourth and fifth beach ridge (166° 22’ 25.6“ E, 77° 14’ 35.3” S), near abandoned penguin colonies in the middle part of Cape Bird. The profile MB6 (38 cm) was sampled from the catchment on the second terrace of the modern penguin colony on the north side of Cape Bird. Core BI (20.5 cm) was excavated from a small lake near the modern penguin colony on the south-west side of Beaufort Island. Both MB4 and MB6 profiles were sectioned in the field, at intervals of about 0.8 and 0.6 cm, respectively. BI was transported to the laboratory in a PVC plastic gravity pipe and then sectioned at 0.5 cm intervals. Observations made in the field and laboratory indicate that all of the sediment profiles are influenced by the penguin droppings, and some algae remains were found in the sediment samples. The lithologic characteristics of the three sediment profiles are shown in , and more detailed information has been reported previously by Nie et al. (Citation2012) and Liu et al. (Citation2013).
Materials and methods
Spectral reflectance data of each sample were obtained using a Solid Spec-3700 UV-VIS-NIR Recording Spectrophotometer (Shimadzu, Kyoto, Japan). Prior to spectral analysis, sediment subsamples were air-dried and ground in a mortar, and then passed through a 0.074-mm sieve. About 3 g dried and powdered sample was packed into a measuring cell and scanned over 380–2500 nm at 1 nm intervals.
The chlorophyll a concentration of sediment samples was analysed using high-performance liquid chromatography coupled with atmospheric pressure chemical ionization mass spectrometry. Chlorophyll a was extracted and analysed following the method of Leavitt & Hodgson (Citation2001). The frozen sediment samples were freeze–dried and the pigment was extracted with an acetone–methanol mixture (80:20 v:v) at −20°C for 24 h in the dark. Next, the extracts were purified by filtration through a 0.22-µm-pore-size filter and washed with 1 mL fresh acetone. The solution was then combined and freeze–dried. Before analysis, these freeze-dried samples were diluted to a constant volume with methanol. Chromatographic conditions: 35 min gradient elution programme used a solvent system consisting of pure water (containing 0.1% formic acid; mobile phase A), acetone and acetonitrile (volume ratio 1:10; mobile phase B) at a flow rate of 0.2 mL min−1. All solvents were degassed using ultrasound and helium. Liquid chromatography–mass spectrometry settings are as follows: capillary temperature 150°C, atmospheric pressure chemical ionization vaporizer temperature 450°C, discharge current 5 µA, sheath gas flow rate of 45 arbitrary units. The chlorophyll a standard was supplied by Sigma-Aldrich (St. Louis, MO, USA). Phosphorus (P) concentration was determined using an Optima 2100DV inductively coupled plasma–optical emission spectrometer (PerkinElmer, Waltham, MA, USA) after being treated with the HClO4–HNO3–HCl–HF mixture, and the relative standard deviation (RSD) was within 2%.
Results and discussion
Characteristics of reflectance spectra
Typical reflectance spectra of sediments, lake algae and penguin guano produced spectral curves of variable shapes and their reflectance intensity values are also remarkably different (A). An obvious reflection trough between 650 and 700 nm in the spectral curves was observed in most samples except for the guano and the top sediment samples in the MB6 profile (e.g., MB6-02). This exception is attributed to strong chlorophyll a absorption in the red portion of the electromagnetic spectrum around 675 nm (Rundquist et al. Citation1996; Datt Citation1999; Carrere et al. Citation2004; Das et al. Citation2005; Wolfe et al. Citation2006). Some absorption values at 1500, 1900, 2000 and 2200–2400 nm can be identified for all the spectral curves. The values near 1500 and 1900 nm are associated with water and hydroxyl absorption, and the absorption features between 2000 and 2400 nm are generally related to various organic matter components (Butkute & Slepetiene Citation2004; Liu et al. Citation2011). For instance, some studies have shown that the features at 2310 and 2350 nm are associated with C–H combination bands of lipids (Morón & Cozzolino Citation2004; Cozzolino & Morón Citation2006; Liu et al. Citation2011); the one at 2058 nm is related to the N–H bond of proteins (Osborne et al. Citation1993). Organic matter and moisture are the most important factors affecting reflectance in sediments and soils (Malley Citation1997; Lobell & Asner Citation2002; Rosén Citation2005). Here, all the sediment samples were dried and powdered before analysis. Therefore, organic matter content is likely the main controlling factor for the reflectance intensity of the sediment samples. Indeed, some studies have documented that organic matter was one of the most significant factors affecting the reflectance intensity, and the intensity difference may reflect the change of organic matter level in lacustrine sediments (Kooistra et al. Citation2001; Butkutë & Šlepetienė et al. Citation2004; Chen et al. Citation2011; Rouillard et al. Citation2011). The organic matter in all the analytical samples was mainly derived from penguin guano and lake algae residue. Spectral analysis of these two environmental media samples was significantly different. An obvious trough between 650 and 700 nm was not found in the penguin guano, but it can be clearly observed in the lake algae samples (A), suggesting that the appearance of a trough at 650–700 nm is an important marker for distinguishing the organic matter source. For example, the trough was not found at 650–700 nm in the spectral curve of the MB6-02 sample, indicating that the main source of organic matter was not from algae. This result is consistent with the lithological characteristics of the MB6 sediment profile.
Fig. 2 Typical reflectance spectra curves of algae, guano and sediment samples, as well as the calculation method of trough area at 650–700 nm by Wolfe et al. (Citation2006). MB6-02 and MB6-40 are the sediment samples collected at depths of 1.2 and 24 cm in the MB6 profile, respectively. BI-01 is sampled at a depth of 0.5 cm in the BI profile.
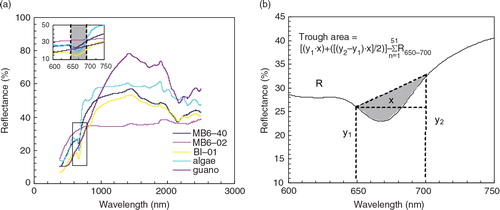
After the death of algae growing in lakes or ponds, pigments from the algae will be deposited and preserved for a long time in the sediments, leaving a record of the original aquatic plants. Therefore, the sedimentary pigment concentrations such as chlorophyll a at different depths can be used to reconstruct historical changes in lake primary productivity (Leavitt & Hodgson Citation2001; Michelutti et al. Citation2005; Wolfe et al. Citation2006). Because determining pigment concentrations is generally time-consuming and costly, some studies have attempted to use reflectance spectroscopy as a rapid technique to assess the content of chlorophyll a in sediments (Das et al. Citation2005; Wolfe et al. Citation2006; Das Citation2007; Michelutti, Blais, Cumming et al. Citation2010). The results showed that the relative level of sedimentary chlorophyll a in sediments can be measured through calculating the dimensionless trough area between 650 and 700 nm. Using the method of Wolfe et al. (Citation2006), we calculated the dimensionless trough area between 650 and 700 nm in all the spectral curves of the East Antarctic pond sediments that we collected. The schematic diagram of the trough area calculation (B) illustrates the trough area between 650 and 700 nm.
Trough area at 650–700 nm and chlorophyll a concentration in the sediments
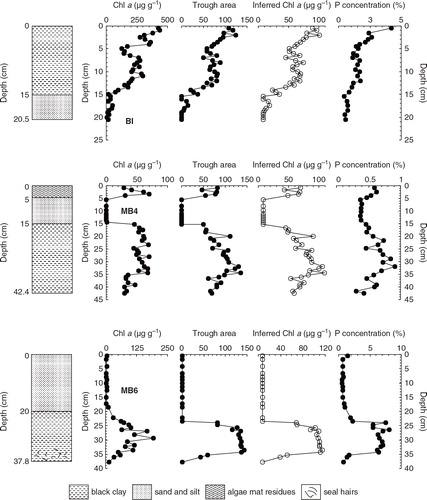
According to the calculation of trough area at 650–700 nm, the changes of trough area values in the BI, MB6 and MB4 sediment profiles with depth as well as levels of chlorophyll a in the sediments displayed very similar change patterns (). The chlorophyll a concentration and trough area in the BI profile exhibits a gradually increasing trend from the bottom to the surface sediment samples. In the samples below 15 cm, both chlorophyll a and trough area reached their lowest values; relatively high values were observed in the sediments at about 11 cm; and then the obviously low values occurred at 5 cm; the peaks of chlorophyll a and trough area were present in the surface sediments. In the MB6 sediment profile, chlorophyll a and trough area values increased gradually from the bottom to the upper layers, where they reached the remarkably high levels at 27–33 cm. After that they decreased sharply to the lowest level at around 20 cm depth. Both chlorophyll a and trough area values in the sediment samples above 20 cm are close to zero, indicating an extremely low productivity recorded in this sediment layer. In fact, all of the sediment samples in the top 20 cm have the similar reflectance spectral curves as the sample of MB6-02 mentioned above, and the trough at 650–700 nm is not obvious, suggesting that the aquatic algae cannot be the main source of organic matter in the MB6 samples above 20 cm. One possible reason for this is that there are few aquatic plants growing in this pond because it was dry at that time. In the MB4 sediment profile, relatively low values of chlorophyll a and trough area appeared below 35 cm depth, and then increased gradually from 35 to 15 cm. After that, these values began to decrease and reached the lowest levels at a depth of 5–15 cm, indicating that the pond primary productivity was relatively low during the deposition of this sediment layer.
Fig. 3 Changes of 650–700 nm trough area, measured and inferred chlorophyll a concentrations and P levels in the BI, MB4 and MB6 sediment profiles.
Correlation analysis showed that the reflectance trough area (650–700 nm) and the measured chlorophyll a concentration displayed a significant positive relationship (correlation coefficients [r] = 0.91 [n = 40, p<0.01], 0.80 [n = 40, p<0.01], 0.86 [n = 29, p<0.01] in the sediment profiles of BI, MB4 and MB6, respectively). Following the method of Michelutti and co-workers (Michelutti, Blais, Cumming et al. Citation2010), we developed a prediction model for trough area and chlorophyll a level based on 32 sediment samples from the three sediment profiles. Our model showed a significant relationship between measured chlorophyll a and the trough area between 650 and 700 nm (r = 0.79, p< 0.0001; ). The sedimentary chlorophyll a content can be inferred by the following equation ():1
Fig. 4 Modelling relationship between the trough area at 650–700 nm and the measured chlorophyll a concentrations for the 32 samples from the three sediment profiles.
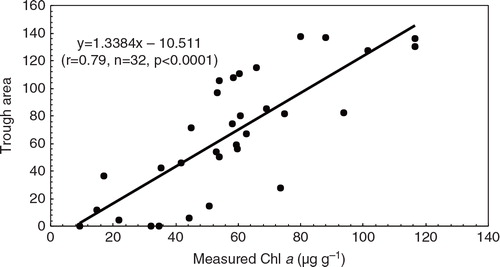
Applying this model, we inferred chlorophyll a concentration in the three lacustrine sediment profiles (). The trough area at 650–700 nm, and measured and inferred chlorophyll a concentrations in BI, MB4 and MB6 profiles displayed very similar change trends when plotted against depth, indicating that the reflectance trough area between 650 and 700 nm can be used to rapidly assess the change of chlorophyll a concentration in the sediments and the historical primary productivity in the Antarctic ponds. The absolute values of inferred and measured chlorophyll a concentrations seemed to not be completely identical, although their change patterns are highly consistent (). There are small differences between measured and inferred chlorophyll a concentrations in all the sediment profiles, except in BI. Average values of measured and inferred chlorophyll a concentrations in the MB6 and MB4 profiles are 52.4 and 48.6 µg g−1 (RSD = 5%), and 40.1 and 56.9 µg g−1 (RSD = 24%), respectively. However, there is a large difference between the inferred and measured chlorophyll a concentrations in the BI profile, and the inferred values are significantly lower than the measure ones (). Considerable deviation in the BI profile may be related to the sample selection in the model calculation, the lake environment and specific sediment components. Since organic matter is one of the most important factors controlling the reflectance in the sediments, different organic matter sources (e.g., guano and algae) and the lithologic features may affect the spectra curves of the samples in BI, which could lead to the large deviation between inferred and measured chlorophyll a concentrations. Considering this point, we suggest that VRS can only be used as a semi-quantitative method to rapidly assess relative change of chlorophyll a concentration in Antarctic pond sediments. To obtain precise chlorophyll a content in the sediments, it is necessary to perform chemical analysis.
Effect of seabird droppings input on East Antarctic lake primary productivity
According to the principle of biological geochemistry, lake phytoplankton biomass is closely associated with climate, photosynthesis and lake nutrient level (Wang & Liu Citation2000). Some studies have shown that the nutrient elements such as N and P are important limiting factors for aquatic plants in oligotrophic Antarctic and Arctic lakes, and allochthonous inputs into lake water may cause eutrophication and thus the increase of phytoplankton biomass (Hawes Citation1983; Blais et al. Citation2005; Keatley et al. Citation2009; Michelutti, Blais, Cumming et al. Citation2010). Nutrient transport by migratory animals generally plays an important role in the development of ecosystems (Anderson & Polis Citation1999; Fariña et al. Citation2003; Blais et al. Citation2007; Hannan et al. Citation2007). The nutrient subsidies derived from animal excrements can impact the ecosystem structure and function, particularly in remote islands (Polis et al. Citation1997; Michelutti et al. Citation2008).
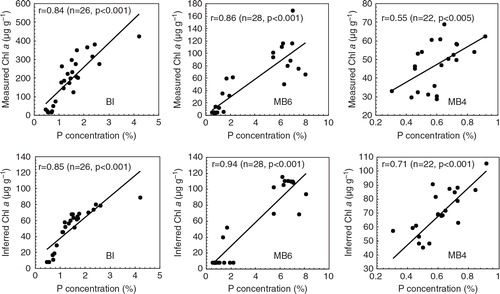
Penguins are the most important seabirds in Antarctica as they are widely distributed and play a key role linking Antarctic inland, freshwater lakes and ponds, intertidal and marine ecosystems (Shen et al. Citation1999). The input of penguin guano provides necessary inorganic nutrients N and P for the growth of algae in lake and pond ecosystems, increasing primary productivity. Changes in P content in ornithogenic sediments can be used to track the amount of guano input and can then be related to seabird populations (Sun et al. Citation2000; Liu et al. Citation2006; Huang et al. Citation2009). Changes of P content plotted against depth in the ornithogenic BI, MB6 and MB4 sediment profiles () show similar patterns to chlorophyll a concentrations. As discussed above, chlorophyll a is present in all phytoplankton and often used as an indicator of phytoplankton biomass. Here, we performed correlation analyses between P and measured chlorophyll a content, and inferred chlorophyll a values in the BI, MB6 and MB4 profiles. The significantly positive correlations of P with measured and inferred chlorophyll a () suggest that the input of penguin guano caused the increase of nutrient levels, which could promote the growth of phytoplankton and the enhancement of primary productivity in these small lakes or ponds (Liu et al. Citation2013). Nevertheless, low P and chlorophyll a levels were observed in some samples not affected by penguin guano. For example, the sediment layer between 5 and 15 cm depth in the MB4 profile () has low P content, indicative of the lack of guano input into the pond. The concentration of chlorophyll a is correspondingly extremely low (almost below detectable limits), which is consistent with the approximate zero trough area between 650 and 700 nm in the reflectance spectra curves (), reflecting the low primary productivity recorded in this sediment layer.
Fig. 5 Correlations of P with measured and inferred chlorophyll a concentrations in the ornithogenic sediments of BI, MB6 and MB4.
Conclusions
We performed analyses on VRS and chlorophyll a concentration in three sediment profiles from East Antarctic lakes and ponds. We conclude that the appearance of a trough at 650–700 nm in the visible spectrum curves is an important marker for chlorophyll a concentrations and can be used to distinguish the sedimentary organic matter source from guano and aquatic algae. The dimensionless trough area between 650 and 700 nm has significantly positive correlations with the measured chlorophyll a content in all the three sediment profiles, indicating that the VRS has the potential to be a valuable tool to rapidly assess chlorophyll a concentrations in East Antarctic ponds.
Modelling results show that although their absolute values seem to have some deviations, the spectrally-inferred and measured chlorophyll a levels have fairly consistent change patterns versus depth, indicating that the trough area can be used as an independent proxy for reconstructing the relative change of Antarctic lake primary production.
For lakes and ponds around the penguin colonies, the input of penguin guano can increase nutrient levels and promote the growth of phytoplankton, resulting in a large increase in primary productivity.
Acknowledgements
We thank the Arctic and Antarctic Administration of the National Oceanic Bureau of China for project support. We also thank the United States Antarctic Program and in particular S. Emslie, J. Smykla, E. Gruber and L. Coats for their valuable assistance in the field. This study was supported by the National Natural Science Foundation of China (grant nos. 41076123 and 40876096) and the Chinese Polar Environment Comprehensive Investigation & Assessment Programmes (CHINARE2013-04-04-09).
References
- Anderson W.B, Polis G.A. Nutrient fluxes from water to land: seabirds affect plant nutrient status on Gulf of California islands. Oecologia. 1999; 118: 324–332.
- Blais J.M, Kimpe L.E, McMahon D, Keatley B.E, Mallory M.L, Douglas M.S.V. Arctic seabirds transport marine-derived contaminants. Science. 2005; 309: 445–445.
- Blais J.M, Macdonald R.W, Mackay D, Webster E, Harvey C, Smol J.P. Biologically mediated transport of contaminants to aquatic systems. Environmental Science & Technology. 2007; 41: 1075–1084.
- Broady P.A. Broadscale patterns in the distribution of aquatic and terrestrial vegetation at three ice-free regions on Ross Island, Antarctica. Hydrobiologia. 1989; 172: 77–95.
- Butkutë B, Šlepetienė A. Near-infrared reflectance spectroscopy as a fast method for simultaneous prediction of several soil quality components. Chemija. 2004; 15: 12–20.
- Carrere V, Spilmont N, Davoult D. Comparison of simple techniques for estimating chlorophyll a concentration in the intertidal zone using high spectral-resolution field-spectrometer data. Marine Ecology Progress Series. 2004; 274: 31–40.
- Chen Q.Q, Liu X.D, Liu W.Q, Jiang S. Near infrared reflectance spectroscopy (NIRS): a novel approach to reconstructing historical changes of primary productivity in Antarctic lake. Spectroscopy and Spectral Analysis. 2011; 31: 2688–2691. (In Chinese with English abstract.).
- Cohen M.J, Prenger J.P, DeBusk W.F. Visible-near infrared reflectance spectrocopy for rapid, nondestructive assessment of wetland soil quality. Journal of Environmenatal Quality. 2005; 34: 1422–1434.
- Cozzolino D, Morón A. Potential of near-infrared reflectance spectroscopy and chemometrics to predict soil organic carbon fractions. Soil & Tillage Research. 2006; 85: 78–85.
- Das B. Reconstruction of historical productivity using visible-near-infrared (VNIR) reflectance properties from boreal and saline lake sediments. Aquatic Ecology. 2007; 41: 209–220.
- Das B, Vinebrooke R.D, Sanchez-Azofeifa A, Rivard B, Wolfe A.P. Inferring sedimentary chlorophyll concentrations with reflectance spectroscopy: a novel approach to reconstructing historical changes in the trophic status of mountain lakes. Canadian Journal of Fisheries and Aquatic Sciences. 2005; 62: 1067–1078.
- Datt B. Visible/near infrared reflectance and chlorophyll content in eucalyptus leaves. International Journal of Remote Sensing. 1999; 20: 2741–2759.
- Emslie S.D, Berkman P.A, Ainley D.G, Coats L, Polito M. Late-Holocene initiation of ice-free ecosystems in the southern Ross Sea, Antarctica. Marine Ecology Progress Series. 2003; 262: 19–25.
- Emslie S.D, Coats L, Licht K. A 45,000 yr record of Adelie penguins and climate change in the Ross Sea, Antarctica. Geology. 2007; 35: 61–64.
- Emslie S.D, Woehler E.J. A 9000-year record of Adelie penguin occupation and diet in the Windmill Islands, East Antarctica. Antarctic Science. 2005; 17: 57–66.
- Fariña J.M, Salazar S, Wallem K.P, Witman J.D, Ellis J.C. Nutrient exchanges between marine and terrestrial ecosystems: the case of the Galapagos sea lion. Zalophus wollebaecki. Journal of Animal Ecology. 2003; 72: 873–887.
- Foley W.J, Mcllwee A, Lawler I, Aragones L, Woolnough A.P, Berding N. Ecological applications of near infrared reflectance spectroscopy—a tool for rapid, cost-effective prediction of the composition of plant and animal tissues and aspects of animal performance. Oecalogia. 1998; 116: 293–305.
- Font R, Del Río M, Vélez D, Montoro R, De Haro A. Use of near-infrared spectroscopy for determining the total arsenic content in prostrate amaranth. Science of the Total Environment. 2004; 327: 93–104.
- Hannan L.B, Roth J.D, Ehrhart L.M, Weishampel J.F. Dune vegetation fertilization by nesting sea turtles. Ecology. 2007; 88: 1053–1058.
- Hawes I. Nutrients and their effects on phytoplankton populations in lakes on Signy Island, Antarctica. Polar Biology. 1983; 2: 115–126.
- Hodgson D.A, Doran P.T, Roberts D, McMinn A, Pienitz R. Paleolimnological studies from the Antarctic and Subantarctic islands. Long-term environmental change in Arctic and Antarctic lakes. Developments in palaeoenvironmental research. 2004; Dordrecht: Springer. 419–474.
- Hodgson D.A, Noon P.E, Vyverman W, Bryant C.L, Gore D.B, Appleby P, Gilmour M, Verleyen E, Sabbe K, Jones V.J. Were the Larsemann Hills ice-free through the Last Glacial Maximum?. Antarctic Science. 2001; 13: 440–454.
- Huang T, Sun L.G, Wang Y.H, Liu X.D, Zhu R.B. Penguin population dynamics for the past 8500 years at Gardner Island, Vestfold Hills. Antarctic Science. 2009; 21: 571–578.
- Keatley B.E, Douglas M.S.V, Blais J.M, Mallory M.L, Smol J.P. Impacts of seabird-derived nutrients in water quality and diatom assemblages from Cape Vera, Devon Island, Canadian High Arctic. Hydrobiologia. 2009; 621: 191–205.
- Kooistra L, Wehrens R, Leuven R.S.E.W, Buydens L.M.C. Possibilities of visible-near-infrared spectroscopy for the assessment of soil contamination in river floodplains. Analytica Chimica Acta. 2001; 446: 97–105.
- Korsman T, Nilsson M, Oehman J, Renberg I. Near-infrared reflectance spectroscopy of sediments: a potential method to infer the past pH of lakes. Environmental Science & Technology. 1992; 26: 2122–2126.
- Korsman T, Nilsson M.B, Landgren K, Renberg I. Spatial variability in surface sediment composition characterised by near-infrared (NIR) reflectance spectroscopy. Journal of Paleolimnology. 1999; 21: 61–71.
- Leavitt P.R, Hodgson D.A, Smol J.P . Sedimentary pigments. Tracking environmental change using lake sediments. Terrestrial, algal and siliceous indicators. 2001; Vol. 3 Dordrecht: Kluwer Academic Publishers. 295–325.
- Liu X, Nie Y, Sun L, Emslie S.D. Eco-environmental implications of elemental and carbon distributions in ornithogenic sediments from the Ross Sea region, Antarctic. Geochimica et Cosmochimica Acta. 2013; 117: 99–114.
- Liu X.D, Sun J, Sun L.G, Liu W.Q, Wang Y.H. Reflectance spectroscopy: a new approach for reconstructing penguin population size from Antarctic ornithogenic sediments. Journal of Paleolimnology. 2011; 45: 213–222.
- Liu X.D, Sun L.G, Xie Z.Q, Yin X.B, Zhu R.B, Wang Y.H. A preliminary record of the historical seabird population in the Larsemann Hills, East Antarctica, from geochemical analyses of Mochou Lake sediments. Boreas. 2007; 36: 182–197.
- Liu X.D, Zhao S.P, Sun L.G, Yin X.B, Xie Z.Q, Luo H.H, Wang Y.H. P and trace metal contents in biomaterials, soils, sediments and plants in colony of red-footed booby (Sula sula) in the Dongdao Island of South China Sea. Chemosphere. 2006; 65: 707–715.
- Lobell D.B, Asner G.P. Moisture effects on soil reflectance. Soil Science Society of America Journal. 2002; 66: 722–727.
- Malley D.F. Use of near-infrared reflectance spectroscopy in prediction of heavy metals in freshwater sediment by their association with organic matter. Environmental Science & Technology. 1997; 31: 3461–3467.
- Michelutti N, Blais J.M, Cumming B.F, Paterson A.M, Rühland K, Wolfe A.P, Smol J.P. Do spectrally inferred determinations of chlorophyll a reflect trends in lake trophic status?. Journal of Paleolimnology. 2010; 43: 205–217.
- Michelutti N, Blais J.M, Mallory M.L, Brash J, Thienpont J, Kimpe L.E, Douglas M.S.V, Smol J.P. Trophic position influences the efficacy of seabirds as metal biovectors. Proceedings of the National Academy of Sciences of the United Stated of America. 2010; 107: 10543–10548.
- Michelutti N, Keatley B.E, Brimble S, Blais J.M, Liu H.J, Douglas M.S.V, Mallory M.L, Macdonald R.W, Smol J.P. Seabird-driven shifts in Arctic pond ecosystems. Proceedings of the Royal Society B-Biological Sciences. 2008; 276: 591–596.
- Michelutti N, Wolfe A.P, Vinebrooke R.D, Rivard B, Briner J.P. Recent primary production increases in Arctic lakes. Geophysical Research Letters. 2005; 32: 19715.
- Monaghan A.J, Bromwich D.H, Powers J.G, Manning K.W. The climate of the McMurdo, Antarctica, region as represented by one year of forecasts from the Antarctic Mesoscale Prediction System. Journal of Climate. 2005; 18: 1174–1189.
- Morón A, Cozzolino D. Determination of potentially mineralizable nitrogen and nitrogen in particulate organic matter fractions in soil by visible and near-infrared reflectance spectroscopy. Journal of Agricultural Science. 2004; 142: 335–343.
- Nie Y.G, Liu X.D, Sun L.G, Emslie S.D. Effect of penguin and seal excrement on mercury distribution in sediments from the Ross Sea region, East Antarctica. Science of the Total Environment. 2012; 433: 132–140.
- Nilsson M.B, Dåbakk E, Korsman T, Renberg I. Quantifying relationships between near-infrared reflectance spectra of lake sediments and water chemistry. Environmental Science & Technology. 1996; 30: 2586–2590.
- Osborne B.G, Fearn T, Hindle P.H. Practical NIR spectroscopy with applications in food and beverage analysis. 1993; Harlow, UK: Longman Scientific and Technical. 13–35.
- Pasquini C. Near infrared spectroscopy: fundamentals, practical aspects and analytical applications. Journal of the Brazilian Chemical Society. 2003; 14: 198–219.
- Polis G.A, Anderson W.B, Holt R.D. Toward an integration of landscape and food web ecology: the dynamics of spatially subsidized food webs. Annual Review of Ecology and Systematics. 1997; 28: 289–316.
- Rosén P. Total organic carbon (TOC) of lake water during the Holocene inferred from lake sediments and near-infrared spectroscopy (NIRS) in eight lakes from northern Sweden. Biogeochemistry. 2005; 76: 503–516.
- Rouillard A, Rosén P, Douglas M.S.V, Pienitz R, Smol J.P. A model for inferring dissolved organic carbon (DOC) in lakewater from visible-near-infrared spectroscopy (VNIRS) measures in lake sediment. Journal of Paleolimnology. 2011; 46: 187–202.
- Rundquist D.C, Han L, Schalles J.F, Peake J.S. Remote measurement of algal chlorophyll in surface waters: the case for the first derivative of reflectance near 690 nm. Photogrammetric Engineering and Remote Sensing. 1996; 62: 195–200.
- Shen J, Xu R.M, Zhou G.F. Research on the structure and relationship of terrestrial, freshwater, intertidaland shallow sea ecosystems in Fildes Peninsula, Antarctica. Chinese Journal of Polar Research. 1999; 11: 100–112. (In Chinese with English abstract.).
- Squier A.H, Hodgson D.A, Keely B.J. Sedimentary pigments as markers for environmental change in an Antarctic lake. Organic Geochemistry. 2002; 33: 1655–1665.
- Sun L.G, Xie Z.Q, Zhao J.L. A 3,000-year record of penguin populations. Nature. 2000; 407: 858.
- Trachsel M, Grosjean M, Schnyder D, Kamenik C, Rein B. Scanning reflectance spectroscopy (380–730 nm): a novel method for quantitative high-resolution climate reconstructions from minerogenic lake sediments. Journal of Paleolimnology. 2010; 44: 979–994.
- Wang J.Q, Liu J.L. Amino acids and stable carbon isotope distributions in Taihu Lake, China, over the last 15,000 years, and their paleoecological implications. Quaternary Research. 2000; 53: 223–228.
- Wolfe A.P, Vinebrooke R.D, Michelutti N, Rivard B, Das B. Experimental calibration of lake-sediment spectral reflectance to chlorophyll a concentrations: methodology and paleolimnological validation. Journal of Paleolimnology. 2006; 36: 91–100.