
Abstract
Terrestrial influences of coastal cliff morphology and hydrological impact on coastal erosion in unlithified cliff sediments in the inner fjords of Svalbard are assessed. Differential global positioning system measurements have been taken annually over the past two to four years at four field sites in central Svalbard. Measurements were combined with aerial imagery using ArcGIS and the Digital Shoreline Analysis System to calculate rates of erosion in varying geomorphological cliff types. A total of 750 m of coast was divided into two main cliff types: ice-poor and ice-rich tundra cliffs and further divided based on their sediment depositional character and processes currently acting upon sediments. The results show that the most consistent erosion rates occur in the ice-poor cliffs (0.34 m/yr), whereas the most irregular and highest rates occur in ice-rich cliffs (0.47 m/yr). Throughout the study, no waves were observed to reach cliff toes, and therefore erosion rates are considered to reflect an effect of terrestrial processes, rather than wave action. Terrestrial hydrological processes are the driving factors for cliff erosion through winter precipitation for ice-poor cliffs and summer precipitation for ice-rich cliffs. Sediment removal from the base of the cliffs appears to be mainly conducted by sea ice and the ice foot during break up as waves did not reach the base of the studied cliffs during the observed period.
To access the supplementary material for this article, please see supplementary files under Article Tools online.
Arctic coasts are characterized by the presence of permafrost, which is affected by variations in geomorphological characteristics of the coast, the presence of infrastructure and hydrology (Manson et al. Citation2005; Rowland et al. Citation2010; Lewis et al. Citation2012). Recent research has suggested that Arctic coastal erosion is generally restricted to a few months of open water during which waves can attack the coast and promote erosion (Are et al. Citation2008; Overeem et al. Citation2011; Lantuit et al. Citation2012). Sea-ice coverage has declined for the entire Arctic over the past four decades (Førland et al. Citation2009), and Svalbard in particular is known to have lower sea-ice coverage due to the warm Atlantic Waters which flow past the western coast and enter into fjords (Ådlandsvik & Loeng Citation1991; Nilsen et al. Citation2008). Although the open-water season is longer in Svalbard, wave action does not appear to have as regular or consistent influence on coastal erosion as might be suspected (Ogorodov et al. Citation2010; Sessford Citation2013; Sessford et al. Citation2015). Automatic camera photographs show that there were no large storm events during the open-water season over the course of this study, suggesting that erosion is mainly caused by terrestrial influences. This does not outweigh the importance of marine/ice influence in removing sediments and thereby keeping the shore-face out of balance so that terrestrial erosion must continue to create equilibrium.
The West Spitsbergen Current (warm Atlantic Water) that flows past Svalbard affects Svalbard's climate and sea-ice conditions, especially during winter (Walczowski & Piechura Citation2011). The decrease in sea ice appears to be affecting air temperature and precipitation by producing a more maritime climate (Førland et al. Citation2009; Førland et al. Citation2012; Kvamstø et al. Citation2012), in which mean annual air temperatures and winter precipitation are increasing (Kattsov et al. Citation2007). Over the past 100 years, Svalbard Airport has recorded a 2% increase in mean precipitation per decade and projected annual precipitation is expected to increase 20–40% for Svalbard by 2050 (Førland et al. Citation2009), with the greatest changes in fall/winter and the weakest in summer (Kattsov et al. Citation2007). This, in turn, potentially affects coastal erosion from the terrestrial side, as maximum snow water equivalent; melt season duration, permafrost thaw and active-layer thickness increase. Results from the International Polar Year 2007–09 showed that Svalbard has the warmest permafrost for its latitude, suggesting that in a warming climate the potential for thaw consolidation is large. This may induce changes in the terrestrial landscape surrounding the coast (Christiansen & Etzelmüller Citation2010; Christiansen et al. Citation2010), with negative implications for coastal stability. An increase in rain-on-snow events during the winter season may enhance permafrost thaw through an increase in active-layer depth; nowhere is this more predominant than in the Arctic maritime climate of Svalbard (Rennert et al. Citation2009; Westermann et al. Citation2011). Permafrost degradation enhances coastal erosion as the ice-bonding of sediment is lost in thawing (Rowland et al. Citation2010; Lantuit et al. Citation2013). It can also affect the soil hydrology causing drainage subsidence (Lewis et al. Citation2012), increasing soil permeability (Rowland et al. Citation2010), changing the distribution of surface waters and increasing active-layer interflow (Ballantyne Citation1978). These processes, which are linked to increased precipitation and spring/summer melt, are largely affected by coastal and adjacent terrestrial geomorphology.
During their investigation of 61 000 km of Arctic coasts, Lantuit et al. (Citation2012) reported an average erosion rate of 0.5 m/yr. This weighted mean coastal erosion rate is derived from a number of regional rates of which Svalbard is the lowest and the American Beaufort Sea coast is the highest, at 0 and 1.15 m/yr, respectively (Lantuit et al. Citation2012). The difference is suggested to come directly from the observation that Svalbard's non-glacier coasts have an “overwhelmingly rocky nature” with “virtually no visible ground ice” (Lantuit et al. Citation2012: 393, 91). On the other hand, the American Beaufort Sea coast has erosional “hot spots” along the coastline (such as at Drew Point, Alaska, with erosion rates of up to 19.0 m/yr), where massive ground ice contributes to high mean annual erosion rates (Lantuit & Pollard Citation2005, Citation2008; Jones et al. Citation2009; Lantuit et al. Citation2013; Barnhart et al. Citation2014). Lantuit et al. (Citation2013) acknowledge how the variability in geomorphology between coastlines affects erosion rates, noting for example that on the Bykovsky Peninsula, northern Russia, 82% of rates observed were less than 1 m/yr, while 15% showed rates of 2 m/yr or more. As on lower latitude coasts, spatial variability in geomorphology may have a large impact on variations in erosion rate (Harper Citation1990; Manson et al. Citation2005; Solomon Citation2005).
The sensitivity of Arctic permafrost coasts to changes in climate has been described in recent years as having a large impact on coastal settlements, infrastructure and cultural sites (Instanes et al. Citation2005; Jones et al. Citation2008; Forbes Citation2011; Lantuit et al. Citation2013). What has not been thoroughly discussed is that the same may be said in reverse, where the presence of nearby infrastructure and or scientific examination/installation affects coastal retreat by increasing erosion rates. Often, coastal protective measures have been built without regard to how a new problem may be created by altering the dynamics of erosional and depositional processes (Instanes et al. Citation2005). Instanes et al. (Citation2005) acknowledge that anthropogenic disturbance at the coastline will affect erosion rates, but the extent of such is unknown and dependent on climatic forcing as well as the surrounding hydrology and geomorphology. This study does not attempt to determine how and at what significance nearby infrastructure affects rates, but simply illustrate that infrastructure and human disturbance may enhance erosion rates. On that note, some possible mechanisms for infrastructure enhancing erosion are: permafrost degradation through heat transfer from buildings and roads, disruption of cohesion between sediments from drilling, redirection of overland runoff to form gulleys and increased human activity/movement (Humlum et al. Citation2003; Instanes et al. Citation2005). Niu et al. (Citation2012) and Alfaro et al. (Citation2009) discuss the effects a road has on the thermal status of the permafrost soil beneath. Wu et al. (Citation2007) reveal how there is a large difference in the response of permafrost to engineering construction and that the change in cold (<−1.5°C) permafrost is greater than that in warm (≥−1.5°C) permafrost under the effect of climate change, while the cold permafrost is less sensitive to disturbances from engineering activities. The local thermal effects of infrastructure and snow cover on seasonal freeze–thaw cycles show an increase in thaw depth of the active layer and increase in the length of freeze–thaw cycles which adversely affects the foundation, stability and safety of infrastructure (Duan & Naterer Citation2009). The thermal effect of drilling itself has been investigated in Svalbard, where thermistor strings were installed in holes predrilled using saline water at a temperature between 0°C and 5°C (Gregersen & Eidsmoen Citation1988). Results showed that the drilling operation increased the temperature of the surrounding soil and that the dissipation of excess heat takes less time in the lower part of the profile than in the upper part. The stabilization can take up to five or six months (Gregersen & Eidsmoen Citation1988).
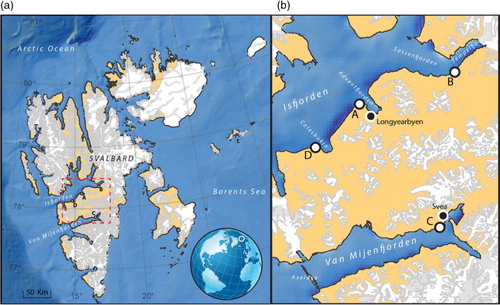
The term “terrestrial-sourced hazards” (Nicholls et al. Citation2007: 318) was originally proposed to cover river floods and inputs of sediment or pollutants; however, in this study the term is extended to refer to geomorphological characteristics of the retreating cliffs, the influence of human activity on or near the cliffs and the effects of increased precipitation and nivation water on erosion rates (Irvine Citation2013). The specific focus of this paper is to look into the impact of these terrestrial-sourced hazards on coastal erosion. Our objective therefore is to present annually (from 2010 to 2013) collected data of coastal retreat from four field sites in central Spitsbergen, Svalbard () and use them to discuss terrestrial influences causing erosion to vary along short coastal stretches. It is understood that by focusing on short, local sections measured rates have the tendency to be higher than what might be observed over longer stretches of coastline. However, if the same amount of detail was collected from longer sections of coastline, we believe that high rates would still be found. These data are also a foundation for a better-rounded and larger data set for Svalbard which is yet to be established, especially for unlithified permafrost coasts in inner fjord regions (Strzelecki Citation2011b; Lantuit et al. Citation2013; Overduin et al. Citation2014). As noted by both Forbes (Citation2011) and Lantuit et al. (Citation2013), understanding of the processes and rates of change for permafrost coasts is dependent on a circumpolar network of local observations which can be used to represent the Arctic as a whole. It is our intent to begin this network for Svalbard.
Fig. 1 (a) Svalbard; (b) the location of field sites: Vestpynten (A), Fredheim (B), Damesbukta (C) and Kapp Laila (D), with their associated fjords.
Regional setting
All field sites are located within the inner fjord regions of Svalbard (). As documented by Etzelmüller et al. (Citation2003), the inner fjord areas of Svalbard are dominated by glacier fronts or glacier meltwater outlets, high abundance of beaches and many deltas. They are more prone to “rapid changes than anywhere else on Svalbard” (Etzelmüller et al. Citation2003: 38). Unlithified sediment cliffs consisting of Holocene beach, fluvial and glacial sediments that are susceptible to coastal erosion are commonly found in Van Mijenfjorden and are known to exist in much of the inner fjord regions (Mangerud et al. Citation1992; Johannessen Citation1997; Etzelmüller et al. Citation2003; Flyen Citation2009). All the field sites are located within non-glacierized zones, that is, all hydrological influence acting directly on the cliffs comes from precipitation runoff, snowmelt and groundwater flow. These are also locations where modern and historical infrastructure are present and in some cases in danger of being lost or damaged by coastal erosion (Johannessen Citation1997; Flyen Citation2009; Sessford et al. Citation2015).
Climate and permafrost measurements indicate a warming trend that will continue over the next 100 years or more as discussed by Førland et al. (Citation2012). Measured mean annual air temperature at the Svalbard Airport in Longyearbyen has seen a rise from −6.7°C in the period 1961–1990 to −4.6°C in the 1981–2010 period (Førland et al. Citation2012). A 2% increase in winter precipitation has been recorded at Svalbard Airport rising from 52 mm/winter in the 1961–1990 period to 55 mm/winter in the 1981–2010 period (Førland et al. Citation2012). A significant warming of Svalbard permafrost has been observed over the past decade, rising approximately 0.04–0.07°C, and shows the warmest permafrost so far north in the Northern Hemisphere (Christiansen & Etzelmüller Citation2010).
Vestpynten
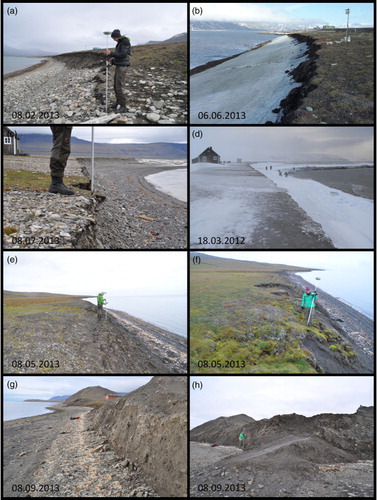
Vestpynten is situated 5 km west of Longyearbyen along Adventfjorden (). The bluff rises from one to approximately 6 m a.s.l. (a). The sediments are stratified, well-graded, beach sediments that range from silt to gravel fractions. Permafrost and an active layer of 150 cm thick are present. There are no indications of ice lenses. Pore water pressure at the base of the active layer is highest between May and July beginning rapidly and dropping relatively quickly as well, reflecting typical seasonal variations for spring/summer melt in the Arctic (Wold et al. Citation2012). A large snowdrift builds up along the bluff during winter and usually does not disappear until late June/early July (b). The bluff is actively undercut behind the snowdrift producing a cavity that measured up to 69 cm cutback in 2012 (Wold et al. Citation2012). Wind waves and ocean swell are commonly found breaking along the beach and can be up to 1 m in height for a one-year return period and up to 1.8 m for a 100-year return period (Lothe & Finseth Citation2012). Fast sea ice is not common at this site, however an ice foot, defined here as, a fringe of ice of varied width at the edge of the shores in cold regions which forms during the winter and either melts out in place or detaches as an ice floe in the spring/summer (Caline Citation2010; Strzelecki Citation2011a) is usually present. There is often drift ice that can become beached. There are no glaciers or rivers directly affecting runoff in the area, and the main source of water is spring and summer snowmelt.
Fig. 2 Photographs from each field location showing (a, b) Vestpynten, (c, d) Fredheim, (e) Kapp Laila Cliff A, (f) Kapp Laila Cliff B and (g, h) Damesbukta. The left column of photographs shows the main cliff areas at each site and the right column of images indicates some of the terrestrial processes that affect each location: (b) large snow drifts, (d) ice foot build up and surface channel ice where active-layer interflow is present, (f) permafrost subsidence and (h) melt-out of dead ice.
Fredheim
Fredheim is located in central Spitsbergen, on the southern shores of Sassenfjorden where the Sassen and Nøis rivers flow into the fjord (, c). This site is home to four cultural heritage buildings that are threatened by coastal erosion. The 190 m long and 3–6 m high section is made up of unlithified Holocene fluvial sediments that form an inactive, uplifted section of the Nøis River delta containing an active layer 90 cm thick (Sessford & Hormes Citation2013). The sediment distribution ranges from silt (<8%) to boulders with the majority of sediment within the sand to gravel fractions (Sessford Citation2013). Uplifted marine terraces landward of the shore zone accumulate large snowdrifts during the winter. Two meltwater channels extend from above the terraces onto the relict fluvial plain that makes up the Fredheim site. Meltwater infiltration leads to active-layer interflow (Ballantyne Citation1978) via relict fluvial channels until it reaches the shoreline. The Nøis River flows from the Fimbulisen glacier catchment and is actively building up the Nøis River delta but not directly eroding the coast.
The area is well protected from wave action due to the prograding Nøis River delta, leaving the longest wave fetch as 14 km from the north–east, a seldom-occurring wind direction (Eliassen Citation2013). Wave heights have not been measured or modelled at this site. In the winter of 2011/12, no fast ice was present at Fredheim. Recent years have shown that even if fast ice is not present in the fjord during winter months, there is still an ice foot attached to the shoreline, with snow drifts that build on top of it (d; Sessford et al. Citation2015).
Kapp Laila
Kapp Laila is located on the southern shores of Isfjorden, the largest fjord in Svalbard (). It lies between the ghost town of Colesbukta and the active town of Barentsburg, both of which have been run by Russia for coal-mining purposes. There is no cultural heritage or infrastructure within 105 m of the cliff edge. The site is made up of two coastal cliff sections, where Cliff A (e) is approximately 6.5 m high and 70 m in length and, Cliff B is about 5 m high and 100 m in length (f). The raised beach sediments at Kapp Laila incorporate gravel, sand and silt. The majority of sediment is within the sand and gravel fraction. Vertically, both Cliffs A and B contain higher quantities of fine sands and silt in the lower regions of the cliff, than in the upper sections. Laterally, the bluff contains finer sediment towards the west and coarser materials—including boulders—to the east. There are no glaciers in the near vicinity; however, some small river channels (snow-patch and groundwater fed) flow between the cliff sections. Most of the cliff sections show evidence for solifluction and or slumping processes (f).
The site is exposed to both Atlantic Swell and local storm wind waves up to approximately the same significant wave height of 1 m for a return period of one year as modelled by Lothe & Finseth (Citation2012). With a 100-year return period, the significant wave height modelled is 1.9 and 1.5 m for local wind and Atlantic Swell, respectively (Lothe & Finseth Citation2012). The dominant swell direction for all waves is from 240° (Lothe & Finseth Citation2012). High tide was not observed at the same time as strong wave action during this survey; however, a high-water line is visible from the large amount of sea vegetation that has washed up along the base of the cliffs, suggesting that waves do sometimes reach the toe. This may have large influence on the removal of sediments from the base of the cliff. There is not often fast ice in this region of the fjord on account of the Warm Atlantic Waters within the fjord currents. However, an ice foot made up of wave spray is usually present along the shoreline during the winter months.
Damesbukta
Damesbukta is located in the inner part of Van Mijenfjorden, just west of Coal Quay in the settlement of Svea. There is a cabin located approximately 20 m from the cliff edge. The cliff is sub-vertical and up to 18 m high. The coastal escarpment is made up of moraine material that has been deposited by the glacier, Paulabreen, surging multiple times during the Holocene (g; Rowan et al. Citation1982; Kristensen et al. Citation2009). An unknown extent of dead glacier ice is also buried within the moraine, identified by direct current resistivity and has been seen to melt out (h; Kristensen et al. Citation2009). Solifluction processes are active at the top of the cliff section, and debris flows and slides deposits towards the middle and base. A large snowdrift tends to build up in front of the cliff during winter, especially in the western part, but does not reach the cliff top. The island of Axeløya protects the inner fjord, minimizing the cliff's exposure to the open sea. However, large local waves have been modelled by Lothe & Finseth (Citation2012), suggesting that the fetch length of 60 km long can generate significant wave heights of 1.35 and 2.35 m for one- and 100-year return periods, respectively.
The presence of Axeløya at the mouth of Van Mijenfjorden inhibits inflow of the warm Atlantic Water (Høyland Citation2009) and allows for the formation of fast sea ice (0.72–1.3 m thick) in the fjord in most winters. An ice foot is typically present as well (Caline Citation2010). Svea has a semidiurnal micro-tidal environment, with a tidal range of less than 2 m (Caline Citation2010). The tide lags Longyearbyen by about 40 min (Caline Citation2010).
Methods
Differential global positioning system
The differential global positioning system (DGPS) method has been used to establish retreat points along the coastal escarpments. All measurements were taken in July, August or September and therefore years are measured from 1 August to 31 July. Measurements were taken approximately every 0.5 m in 2013 or at smaller intervals if the cliff-line shape was irregular. In previous years (2012, 2011 and 2010), points were taken often but at no specified distance, so there is some irregularity between years. In places where a cliff edge was not highly distinguishable (i.e., where subsidence is taking place and the cliff edge contains large cracks at the top, and slumping down to the beach), the uppermost crack was measured (excluding some sections at Damesbukta where it is uncertain what precisely was measured as the retreat appears too high; this section is marked as “uncertainty” within the Damesbukta results). Field parameters were the same for all collected points. Global positioning system and Global Navigation Satellite System satellite systems were used with a cut-off angle of 10°. All data points were collected and registered in the WGS1984 datum using the UTM33X projection. Accuracy of the ATX1230 GG Rover with post-processing during the kinematic phase in moving mode after initialization for horizontal measurements is in root mean square (RMS) documented to be 0.001 m+1 ppm. However, automatic post-processing output of points collected in 2013 in this study produced a point position quality control RMS value of 0.005 m±0.014 m. Post-processing was done using Leica Geo Office L1/L2 software.
DGPS data analysis
DGPS measurements of coastal retreat were analysed to determine the rates of erosion associated with various morphosedimentary conditions and processes. Three of the four sites have DGPS measurements from 2012 to 2013 and a coastline measurement via aerial photographs from 2011 and therefore reflect a two-year, observation period. However, one site, Fredheim, contains DGPS measurements from 2010 to 2013 plus an aerial photograph from 2009, thereby stretching across a four-year, observation period. Following DGPS point processing with Leica GeoOffice software, points and aerial images were imported into ArcGIS and analysed using the Digital Shoreline Analysis System (DSAS; Thieler et al. Citation2009). Shorelines were drawn by connecting DGPS points and with some interpretation between points using photographs. Aerial images, orthorectified and provided by the Norwegian Polar Institute, were used as an extra year for measurements by drawing the cliff edge for the year image was taken and using it as a baseline (Supplementary Table S1). The orthorectification process did not produce an RMS error; however, known locations of stable landforms and or infrastructure were determined using aerial imagery and compared with collected DGPS points for their locations to calculate the total RMS error associated with orthorectification of the aerial images. Comparisons were done using ArcGIS, first-order polynomial, auto-adjust transformation.
To produce very high spatial resolution, transects were cast every 0.5 m along the shoreline from a baseline derived from the orthorectified aerial photographs. Transects are automatically drawn by the DSAS programme perpendicular to the baseline shoreline and stretch across each corresponding annual shoreline retreat line as drawn by the user. The distance from the baseline to where the transect crosses each shoreline corresponds to erosion. This allows for consistency between points and decreases the error associated with operator manipulation.
Erosion error calculation
The estimated dilution of accuracy, that is the total loss of accuracy, has been calculated by following an adaptation of that described by Lantuit & Pollard (Citation2008), with the following equation:where RMS
1 is the average RMS of the error associated with aerial image orthorectification, RMS
2 is the average RMS of the 2013 DGPS cliff edge points automatically processed during data collection and computation, LOA is the loss of accuracy associated with operator manipulation while connecting collected data points to create shorelines and ΔT is the time interval for the coastal retreat rate. Errors are shown in .
Table 1 Dilution of accuracy (DOA) associated with shoreline erosion rates for each site location.
Cliff and beach profiles
Cliff and beach profiles were measured using the Emery Rod method. The time at which the waterline was measured was noted during fieldwork so as to calculate the correct elevations above mean sea level, as delineated by the Ny-Ålesund tidal charts (Norwegian Mapping Authority Citation2014). Ny-Ålesund was used as a reference for profiles as it is currently the only location on Svalbard that has a continuous record of tidal fluctuations. Ny-Ålesund has a mean water level of 91 cm, mean high water level of 137 cm and mean spring high tide of 154 cm above the chart datum. The highest observed tide was 13 January 1997 where water reached 217 cm above chart datum. It is understood that there are variations in tidal range between the study sites and Ny-Ålesund; however, it is not considered significant to calculate for this article as wave and tidal action on coastal erosion are considered negligible within the study time period. The online resources of the Norwegian Mapping Authority (Citation2014) have been used to approximate the high and low tidal changes at the time of profile measurements where tidal values are rounded to the nearest hour.
Time-lapse imagery
Two automatic cameras recorded time-lapse imagery at Vestpynten and Fredheim for parts of the study period. At Fredheim, one image was taken daily between 5 July 2012 and 2 February 2013. The camera at Vestpynten was installed in May 2012, and has not yet been removed.
Results
In this study, although accumulation of the beach face and deltas was observed, only cliff erosion is examined. As the focus of this study concerns the terrestrial influence on erosional differences between diverse geomorphologies, removal of eroded sediments and (re)deposition is not thoroughly discussed or given examination.
Previous work acknowledges that cliff morphology plays a large role in coastal erosion (Harper Citation1990; Solomon et al. Citation1994; Manson et al. Citation2005; Lantuit et al. Citation2011). In 1990, Harper defined four erosional coastal types, including “ice-poor tundra cliffs” and another “ice-rich tundra cliffs.” With the exception of Damesbukta, all cliffs in this study are considered as ice-poor tundra cliffs as described by Harper (Citation1990). The average erosion rate for ice-poor cliffs was 0.34 m/yr (), which is within the suggested low-to-moderate retreat rate described by Harper (Citation1990) of <1 m/yr. Damesbukta was considered an ice-rich tundra cliff as it contains massive ground ice, even though the erosion rate—0.47 m/yr—was lower than suggested by Harper for ice-rich tundra cliffs (0.5–1.0 m/yr; Harper Citation1990). Note that most ice-rich cliffs described in the literature, such as those at Drew Point, Alaska (Jones et al. Citation2009; Barnhart et al. Citation2014), vary from these in their geomorphic character and process of erosion. All sites were visited personally by one or more of the authors on multiple occasions, and cliffs were further divided and defined by their geomorphic character as well as by processes acting upon the cliffs and enhancing erosion (). Because the morphology of each cliff type is not restricted to a specific field site, rates in represent erosional differences based on geomorphology, hydrology and infrastructure, and not by study site. Therefore, at Vestpynten there were beach sediments with infrastructure affecting erosion through permafrost thaw; at Fredheim we saw fluvial deposits, with active-layer interflows and infrastructure assisting in erosion; and at Kapp Laila there were beach sediments with solifluction and slumping processes affecting sediments. Damesbukta was the only site consisting of moraine material and undergoing ice melt out; however, it is similar to Kapp Laila in that it also is affected by solifluction.
Table 2 Mean erosion rates for all sites pertaining to coastal type where locations are F (Fredheim), V (Vestpynten), KLA (Kapp Laila Cliff A), KLB (Kapp Laila Cliff B) and D (Damesbukta). Note that even though processes are taking place within specific sediment types, that section of cliff is not included in the sediment-type erosion rate (i.e., infrastructure sections at Fredheim are not included in the fluvial sediment erosion rate). At Damesbukta, transects where large uncertainty exists, as shown in , are not included in table results.
Of each morphological cliff type, the raised beach produced the highest rates of erosion and moraine sediments (where no massive ice is present), the lowest with 0.35 and 0.03 m/yr, respectively. When sections were further divided into geomorphological processes acting upon sediments, the largest erosion resulted from ice melt-out (f) and the lowest by active-layer interflow resulting in 3.38 and 0.25 m/yr, respectively. Within cliff sections of fluvial sediments (Fredheim), the weakest naturally occurring bonds within the sediment appear to be where relict fluvial channels are present and spring melt water flows between the permafrost (90 cm depth) and the ground surface (active-layer interflow), resulting in 0.25 m/yr erosion (example: c). However, the highest rates—0.58 m/yr—were found where infrastructure was previously been located. The same high rates of disturbed cliff sections could be seen at Vestpynten, where drilling for installation of piezometer and thermistor strings and core sampling conducted by another study produced rates up to a maximum of 0.94 m/yr. Solifluction areas also had a high erosion rate of 0.62 m/yr in ice-poor zones and 0.65 m/yr in ice-rich zones. However, these values represent retreat from the top of the cliff edge, and not necessarily sediment loss to the sea. Slumping resulted in more sediment loss downslope of the cliff top, and also resulted in a lower average erosion rate of 0.35 m/yr. These findings are displayed spatially and graphically in CitationFigs. 3–(Citation7), which also show the temporal variation in erosion.
Fig. 3 Erosion measurements at Vestpynten overlying a schematic depiction of the site. The erosion total represents the real relative change on the horizontal shape of the cliff. The profile line is drawn in . Note that the highest rates of erosion are where scientific equipment has been installed for coastal technology research.
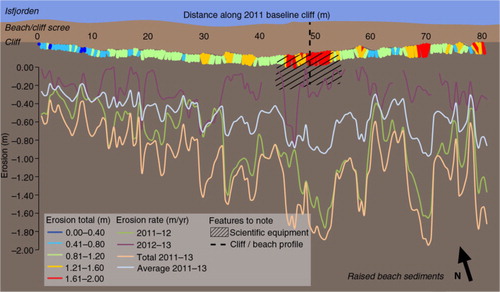
Fig. 4 Erosion measurements at Fredheim overlying a schematic depiction of the fluvial sediments and features of interest affecting erosion. Total erosion represents the actual horizontal cliff shape. Erosion rates indicate the differences between years. Note the location of the active-layer interflow via relict river channels and the old building foundation, where erosion rates appear higher. The profile lines can be viewed in .
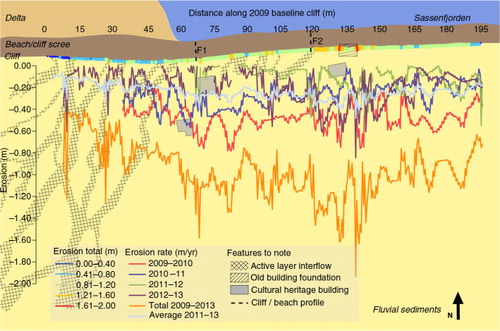
Fig. 5 Erosion measurements overlying a schematic depiction of Kapp Laila Cliff A within the raised beach sediments. The total erosion indicates the horizontal shape of the cliff retreat. The profiles can be viewed in .
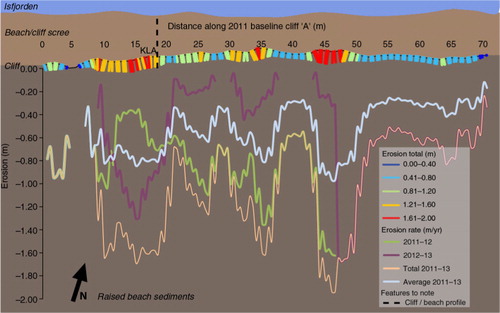
Fig. 6 Erosion measurements overlying a schematic depiction of Kapp Laila Cliff B, where the most dramatic loss in sediment occurs in conjunction with slumping. Total erosion shows the shape of the cliff horizontally. The profiles can be viewed in .
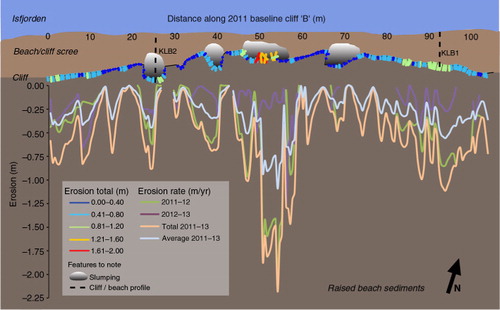
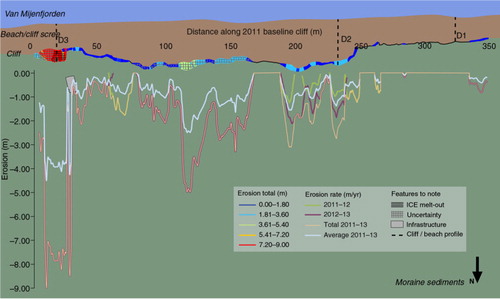
Fig. 7 Erosion measurements overlying a schematic depiction of Damesbukta in the moraine deposits, where total erosion shows the horizontal changes in cliff shape. Take note of the areas of uncertainty, where it is unknown where measurement placement followed the highest crack or most predominant cliff edge. Note the ice melt-out area, where in spring/summer of 2013 a large piece of dead ice melted out. The majority of the remaining sections are influenced by solifluction. The profiles can be viewed in .
On average, the highest rates measured for ice-poor tundra cliffs were from the 2011 to 12 year but the ice-rich cliffs yielded the highest erosion rates for the 2012–13 year (CitationFigs. 3–(Citation7)). Supplementary Fig. S1 shows temperature and precipitation measurements from Longyearbyen Airport during the field study years. Interestingly, the majority of precipitation in the winter of 2011/12 fell mainly as rain between 27 January and 8 February 2012 (Eliassen Citation2013). During the winter of 2012/13, most winter precipitation fell as snow; however, we see an increase in precipitation as rain during the melt season of May and June. Therefore, it appears that during spring thaw, there was less snow to melt in 2012 than there was in 2013, and 2013 had increased precipitation as rain during the thaw. Snow distribution in Svalbard is heavily dependent on the wind and therefore snow will build up in certain locations, and not in others, independent of how much snow actually falls. At Fredheim, Kapp Laila and Vestpynten, snowdrifts build up from the beach to the top of the cliffs during the winter season. At the top of the cliffs, there is generally less snow close to the cliffs and it builds up further away on account of infrastructure and or geomorphological characteristics of the cliffs. These cliffs also slope towards the coast, causing drainage towards the cliffs and fjord. However, at Damesbukta snowdrifts do not reach to the top of the cliff and moraine morphology causes the snow to build up in some regions and not others, producing water pools or hotspots during the spring that generally drain away from the coast, as the highest point is often the edge of the cliff and the land slope inland.
Discussion
According to Liverman et al. (Citation1994) and Irvine (Citation2013), the duration of this study is not sufficient to allow for long-term reliable estimates of coastal change and projections of coastal land loss. These authors, among others, suggest a minimum of annual measurements spanning five years to produce robust estimates of shore retreat rates. However, given the lack of observational data for coastal erosion rates in unlithified sediments on Svalbard (Overduin et al. Citation2014), these initial short-term measurements can begin to fill the gap. They also provide a basis for a brief analysis of ongoing terrestrial processes affecting shoreline retreat rates.
Permafrost is a predominant factor in Arctic coastal landscapes. Permafrost thaw increases the permeability of previously frozen soils and alters the distribution of surface runoff and active-layer interflow waters (Ballantyne Citation1978; Rowland et al. Citation2010). Permafrost degradation affects the stability of frozen soils to an extent that varies with sediment-type, ground-ice content and the evolution of the snowpack during the winter and spring (Boike et al. Citation2003; Westermann et al. Citation2009; Rowland et al. Citation2010; Lantuit et al. Citation2013).
The cliffs in this study are developed in sediments derived from three main depositional environments: fluvial (sand to cobbles), beach (silt to gravel) and moraine (clay to boulders). The corresponding mean erosion rates are 0.23, 0.35 and 0.03 m/yr, respectively (). In the fluvial deposits at Fredheim, the active-layer depth is 90 cm (Sessford Citation2013). Beach sediments found at Vestpynten have an active layer of 150 cm. The depth of the active layer in the beach sediments at Kapp Laila has not been measured but is assumed to be bound by the depth at Vestpynten (150 cm) and 180 cm, as suggested for raised beaches by Christiansen et al. (Citation2010). The active-layer depth at Damesbukta is 110 cm (Kristensen et al. Citation2009; Christiansen et al. Citation2010).
Soil-saturation-induced runoff and active-layer interflow (i.e., spring melt water that flows within the active layer via relict alluvial channel beds) discharge are considered to be the dominant runoff components during the initial spring melt period (Genxu et al. Citation2009; Westermann et al. Citation2011). Genxu et al. (Citation2009) also write that for an active-layer thawing depth <50 cm, surface runoff increases sharply with depth, whereas a depth >60 cm appears to decrease runoff as soil moisture at depth increases and water flows deeper within the active layer. This would affect all regions in this study similarly during spring melt, as the active layer thickens and all are >60 cm in depth at full thaw. It would therefore be expected that surface runoff and instability of surface soils is greater in the early melt season in comparison to further on in the year when snowmelt is complete (or nearly so). This is seen through remote camera images taken at Vestpynten in May and July 2012, where a section of the coast was substantially eroded within two months (, Supplementary Fig. S2). This suggests that the majority of erosion tends to occur at the start of the spring melt season and decreases comparatively within a relatively short time period over the summer.
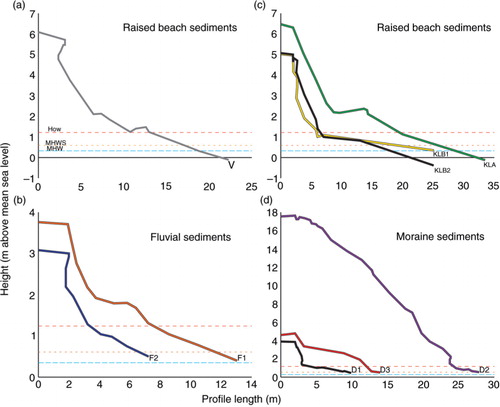
Fig. 8 Cliff/beach profiles at (a) Vestpynten, 17 August 2014, (b) Fredheim, 8 September 2014, (c) Kapp Laila, 15 September 2014 and (d) Damesbukta, 23 September 2014. The horizontal axis at zero indicates the mean sea level at Ny-Ålesund, which is 91 cm above the chart datum. Dashed lines indicate highest observed water level (HOW), mean high spring water level (MHWS) and mean high water line (MHW) at Ny-Ålesund.
Between years, it is observed that the ice-poor cliffs (Vestpynten, Fredheim and Kapp Laila) underwent greater erosion in the year 2011–12, which may largely have to do with the winter thaw in January–February of 2012 (CitationFigs. 3–(Citation8)). Rain-on-snow events also affect the ground surface temperature at the bottom of a snowpack or icing, helping to maintain it around 0°C for a large part of the winter season (Westermann et al. Citation2009; Westermann et al. Citation2011). Repeated or long-lasting precipitation as rain and melt events during the winter significantly impacts the thermal regime of permafrost and thereby weakens the surface bonds between sediment (Westermann et al. Citation2011). This is suggested as one possible reason for higher erosion rates in 2011–12 for ice-poor cliffs. It has been described for clay cliffs in cold temperate climates (Bernatchez & Dubois Citation2008) and for rock coasts in polar and sub-polar regions (Ødegård & Sollid Citation1993), but has not been thoroughly investigated for unlithified cliffs in permafrost settings. Because of the relatively low slope angle inland of the cliff lip towards the fjord, high surface runoff and the snowdrift accumulation at the cliffs, the ice-poor cliffs were more affected than the ice-rich cliff. The moraine morphology at Damesbukta causes runoff to flow into the moraine and through channel systems to the sea via overland river flow rather than directly towards the sea (c, ). Therefore, the high melt period would not have affected the cliff similarly to the others. However, with added precipitation during June and July in 2013, the melt-out at Damesbukta had a greater chance for erosion as the surface of the massive ice body was likely less than the active-layer depth and therefore affected by summer rain events.
If we turn now to review the geomorphology of the cliffs and processes acting upon the sediments, a large difference in rates appears. We see that fluvial (0.23 m/yr) and beach (0.35 m/yr) sediments have a much higher erosion rate than moraine sediments (0.03 m/yr). This is likely mainly due to the compactness of the diamicton making up the moraine. Due to their sorted character, fluvial and beach sediments have weaker bonds when the active layer is thawed. It may also be associated with the size of snowdrift that builds up in front of cliffs during the winter (b, d). The ice-poor cliffs are smaller and snowdrifts build up from the base (toe) to the tops (lip) of the cliffs. It is suggested that pro-nival erosion of the cliff bank assists in erosion through nivation hollowing during spring melt (Christiansen Citation1998). However, on the ice-rich cliff the snowdrift only reaches partway up the cliff and appears to have little effect on the cliff.
However, we do see that solifluction affects sediment types similarly. This likely has to do with the amount of water that is within the system at the end of the summer, when freezing begins. As most erosion likely takes place during melt in the spring, the water quantity of all sediments is quite possibly the same by fall. This goes for all sediments and processes similarly, except at Fredheim where erosion is thought to continue throughout the summer in those places where the relict fluvial channels are located as soil moisture at depth increases and follows these channels as active-layer interflow (Genxu et al. Citation2009). This may explain the cutback system seen where channels meet the erosional cliff (c, ).
Slumping (0.35 m/yr) was the main erosional agent at Kapp Laila Cliff B, yet it is no higher than erosion occurring just in the beach sediments in general (0.35 m/yr; , ). This is likely because large slumping events which formed the back cut regions and small gullies took place before this study began (h, ). However, there is slightly higher erosion at the edge of the back cut sections furthest away from the fjord (). There is little indication of larger ice bodies within the permafrost. It is thought that increased wind-blown snow entrainment occurs during the winter in those cut back sections, which may increase back cutting during the spring. There is no indication from aerial photographs, or field observations that the back cutting is from active-layer interflow as seen at Fredheim. However, back cutting sections at the lip of the cliff appear to be eroding the sediments at a similar average rate to sections without back cutting.
The cliff at Damesbukta is consistently more stable than ice-poor cliffs. Erosional retreat of the majority of the cliff is minimal and in many places zero (, ). This likely has much to do with the compactness and minor water content of the diamicton making up the moraine. The main bulk of the cliff has low ice content, and it is only where dead ice is located that large melt-outs occur. Unfortunately, the extent of ice is unknown (Kristensen et al. Citation2009) and future ice melt-out could occur in a zone where zero erosion has been measured until now. The ice melt-out that occurred in the eastern section of the cliff (3.38 m/yr) during the spring melt/early summer of 2013 raised the average erosion rate from 0.34 to 0.47 m/yr, a low rate that can be attributed to the large section of the cliff type referred to as “moraine sediments,” where zero erosion occurs (). The general tendency of the cliff where erosion occurs is to undergo solifluction at the top and some slumping/debris flows towards the base. However, even the high rate of 0.47 m/yr may be exaggerated as much of the sediments are not being removed from the cliff only undergoing solifluction, thereby pushing the largest cracking/affected surface backward. Uncertainty regions shown in are not included in rate results shown in .
Infrastructure on permafrost coasts is usually considered to be the victim of coastal erosion, and not the culprit. However, construction activity itself may lead to permafrost damage and soil instability (Humlum et al. Citation2003). This effect may be observed at both Fredheim and Vestpynten, where human influence has drastically affected erosion rates (average of 0.58 m/yr). At Fredheim, the specific location is in reference to one of the cultural heritage buildings that used to be located nearer the coast. This building foundation was placed directly on the subsoil, allowing the building to transfer heat to the permafrost soil, and thus thawing it and changing its properties. This building has been moved back 6 m from the cliff in 2001 (Sessford Citation2013) because of its vulnerability to coastal erosion. The question arising is if the presence of the building itself, through thermal conduction of heat and/or disruption of hydrological cycles or the act of moving the building, affected erosion more? This cannot be answered here, but may be worth attention in future studies. At Vestpynten, there have been no buildings at the indicated location in ; however, drilling into the permafrost with air flushing was undertaken in April/May of 2012 at this site (Wold et al. Citation2012). The results, shown in , indicate high erosion (especially where drilling took place) for the August 2011–August 2012 year (up to −1.76 m) and relatively low erosion for the August 2012–August 2013 year. It seems likely that the drilling significantly impacted the stability of sediments; however, there is a general trend of greatly decreased rates in the 2012–13 year. Multiple studies support the warming of the ground thermal regime where drilling in permafrost takes place. Nonetheless, most suggest that it is using water to flush the hole that affects the thermal regime (Hanson & Hoelzle Citation2005; Ramos et al. Citation2009); however, these drillings were flushed with air. The impact of drilling on the surrounding sediments was not measured at the time, and external influences cannot be disregarded.
A coastal erosion assessment would not be complete without a brief look at marine influence and transport of eroded sediments away from the cliff base. At all field sites in this study, waves are not thought to be the consistent transportation agent as they often fail to reach the cliff base on account of low wave heights. The time-lapse photos taken at Fredheim and Vestpynten indicate that during much of the study period, no waves reached the toe of the cliffs. Wide beaches made up of sand to cobbles also help to dissipate wave power (Kobayashi et al. Citation1999; Mars & Houseknecht Citation2007). The wave cut cliffs in this study likely undergo wave cutting on rare occasions when storms generate large waves that coincide with high or spring tide. All cliffs in this study are wave cut scarps; however, throughout the duration of the study no waves were observed to have reached the base of the cliffs and none of the scree deposits were removed from the base of the cliffs. It is therefore assumed that all erosion over the observation period should be attributed to terrestrial processes. This is not to overrule the possibility of waves having the most impact on erosion; rather, the erosion measured in this study was caused by terrestrial processes. It is likely that during large storm events, the scree deposits at the base of the cliffs are removed.
The annual transport agent is suggested to be plucking, as parts of the ice foot containing frozen in beach sediments, detach and float away (Eicken et al. Citation1997; Are et al. Citation2008; Strzelecki Citation2011a; Irvine Citation2013). This is supported by the presence of an ice foot at all study sites during each winter throughout the observation period. Note that only parts of the ice foot were observed to detach and float away, and it is likely that much of it melts in place, thereby having less direct impact on the removal of sediments.
It is understood that this study takes place in a small local region and our findings cannot be directly applied to a global scale. However, the processes and rates presented here are noteworthy as coastal erosion has heretofore been considered non-existent in Svalbard (Lantuit et al. Citation2012).
Conclusion
This study presents new field measurements for coastal erosion in unlithified sediments in the inner fjord regions of Svalbard. Contrary to past studies, coastal erosion is active and removing sediment at an average annual rate of 0.34 m/yr in ice-poor tundra cliffs and 0.47 m/yr in ice-rich tundra cliffs. Overall, ice-poor tundra cliffs have a more consistent and higher annual erosion rate; however, with the exposure of an ice block within the cliff face, retreat rates at ice-rich cliffs exceed all others by a factor of five. In all respects, terrestrial hydrological processes and not the standard wave action mainly drive erosion at the studied field sites. The main erosional period is thought to be during the spring when there are still snowdrifts against the cliffs and the active layer begins to thaw. Rain-on-snow events during the winter seem to heighten erosion in the spring by raising the temperature at the base of snowdrifts and thereby decreasing sediment stability. Increased rain-on-snow events in combination with the warmest permafrost so far north in the Northern Hemisphere may prove to be an example of what is to come in the future for colder permafrost regimes elsewhere as the climate warms.
Supplementary Material
Download PDF (453.5 KB)Acknowledgements
The authors acknowledge the support from the Sustainable Arctic Marine and Coastal Technology (SAMCoT) and the Centre for Research-Based Innovation through the Research Council of Norway and all the SAMCoT partners. Special thanks are directed towards Jomar Finseth for project guidance, and Håkon Tangen and Joar Justad for data collection in the field. Many thanks also to our reviewers, Donald Forbes and Irina Overeem.
Notes
To access the supplementary material for this article, please see supplementary files under Article Tools online.
Related Research Data
References
- Ådlandsvik B., Loeng H. A study of the climatic system in the Barents Sea. Polar Research. 1991; 10: 45–59.
- Alfaro M., Ciro G., Thiessen K., Ng T. Case study of degrading permafrost beneath a road embankment. Journal of Cold Regions Engineering. 2009; 23: 93–111.
- Are F., Reimnitz E., Grigoriev M., Hubberten H.W., Rachold V. The influence of cryogenic processes on the erosional Arctic shoreface. Journal of Coastal Research. 2008; 24: 110–121.
- Ballantyne C.K. The hydrologic significance of nivation features in permafrost areas. Geografiska Annaler Series A. 1978; 60: 51–54.
- Barnhart K.R., Anderson R.S., Overeem I., Wobus C.W., Clow G.D., Urban F.E. Modeling erosion of ice-rich permafrost bluffs along the Alaskan Beaufort Sea coast. Journal of Geophysical Research—Earth Surface. 2014; 119: 1155–1179.
- Bernatchez P., Dubois J.-M.M. Seasonal quantification of coastal processes and cliff erosion on fine sediment shorelines in a cold temperate climate, north shore of the St. Lawrence maritime estuary, Québec. Journal of Coastal Research. 2008; 24: 169–180.
- Boike J., Roth K., Ippisch O. Seasonal snow cover on frozen ground: energy balance calculations of a permafrost site near Ny-Ålesund, Spitsbergen. Journal of Geophysical Research—Atmospheres. 2003; 108 article no. 8163, doi: http://dx.doi.org/10.1029/2001JD000939.
- Caline F. Coastal-sea-ice action on a breakwater in a microtidal inlet in Svalbard. 2010; PhD thesis, Norwegian University of Science and Technology.
- Christiansen H.H. ‘Little Ice Age’ nivation activity in northeast Greenland. The Holocene. 1998; 8: 719–728.
- Christiansen H.H., Etzelmüller B. Report from the International Permafrost Association: Third European Conference on Permafrost (EUCOP III) in Longyearbyen, Svalbard. Permafrost and Periglacial Processes. 2010; 21: 366–369.
- Christiansen H.H., Etzelmüller B., Isaksen K., Juliussen H., Farbrot H., Humlum O., Johansson M., Ingeman-Nielsen T., Kristensen L., Hjort J., Holmlund P., Sannel A.B.K., Sigsgaard C., Åkerman H.J., Foged N., Blikra L.H., Pernosky M.A., Ødegård R.S. The thermal state of permafrost in the Nordic area during the International Polar Year 2007–2009. Permafrost and Periglacial Processes. 2010; 21: 156–181.
- Duan X., Naterer G.F. Heat conduction with seasonal freezing and thawing in an active layer near a tower foundation. International Journal of Heat and Mass Transfer. 2009; 52: 2068–2078.
- Eicken H., Reimnitz E., Alexandrov V., Martin T., Kassens H., Viefoff T. Sea-ice processes in the Laptev Sea and their importance for sediment transport. Continental Shelf Research. 1997; 17: 205–233.
- Eliassen A. Weather statistics for Svalbard. 2013. Accessed on the internet at http://www.yr.no/place/Norway/Svalbard/Longyearbyen/statistics.html on 18 October 2013.
- Etzelmüller B., Ødegård R.S., Sollid J.L. Rachold V., etal. The spatial distribution of coast types on Svalbard. Arctic Coastal Dynamics: report of the 3rd International Workshop University of Oslo (Norway) 2–5 December 2002. Berichte zur Polarforschung und Meereforschung 443. 2003; 33–40.
- Flyen A.C. Coastal erosion—a threat to the cultural heritage of Svalbard?. Polar Research in Tromsø. 2009 2009: 13–14.
- Forbes D.L. State of the Arctic coast 2010—scientific review and outlook. 2011. Geesthacht, Germany: International Arctic Science Committee, Land–Ocean Interactions in the Coastal Zone, Arctic Monitoring and Assessment Programme, International Permafrost Association.
- Førland E.J., Benestad R., Hanssen-Bauer I., Haugen J.E., Skaugen T.E. Temperature and precipitation development at Svalbard 1900–2100. Advances in Meteorology 2011. 2012. article no. 893790, doi: http://dx.doi.org/10.1155/2011/893790.
- Førland E.J., Benestad R.E., Flatøy F., Hanssen-Bauer I., Haugen J.E., Isaksen K., Sorteberg A., Ådlandsvik B. Climate development in North Norway and the Svalbard region during 1900–2100. Norsk Polarinstitutt Rapportserie 128. 2009; Tromsø: Norwegian Polar Institute.
- Genxu W., Hongchang H., Taibin L. The influence of freeze–thaw cycles of active soil layer on surface runoff in a permafrost watershed. Journal of Hydrology. 2009; 375: 438–449.
- Gregersen O., Eidsmoen T. Senneset K. Permafrost conditions in the shore area at Svalbard. V International Conference on Permafrost in Trondheim, Norway, August 1988. Vol. 3. 1988; Trondheim: Tapir Publishers. 933–946.
- Hanson S., Hoelzle M. Installation of a shallow borehole network and monitoring of the ground thermal regime of a high alpine discontinuous permafrost environment, eastern Swiss Alps. Norwegian Journal of Geography. 2005; 59: 84–93.
- Harper J.R. Morphology of the Canadian Beaufort Sea coast. Marine Geology. 1990; 91: 75–91.
- Høyland K.V. Ice thickness, growth and salinity in Van Mijenfjorden, Svalbard, Norway. Polar Research. 2009; 28: 339–352.
- Humlum O., Instanes A., Sollid J.L. Permafrost in Svalbard: a review of research history, climatic background and engineering challenges. Polar Research. 2003; 22: 191–215.
- Instanes A., Anisimov O.A., Brigham L., Goering D., Khrustalev L.N., Ladanyi B., Larsen J.O., Smith O., Steverner A., Weatherfield B., Weller G. Symon C. Infrastructure: buildings, support systems, and industrial facilities. Arctic climate impact assessment—scientific report. 2005; New York: Cambridge University Press. 907–944.
- Irvine M. Pereira C.P.G., Walsh D.G. Coastal monitoring in Newfoundland and Labrador: 2012 update. Current Research. Report 13-1. 2013. Pp. 43–54. St. John's: Geological Survey of Newfoundland and Labrador..
- Johannessen L.J. Villa Fredheim. 1997; Longyearbyen: Governor of Svalbard.
- Jones B.M., Arp C.D., Jorgenson M.T., Hinkel K.M., Schmutz J.A., Flint P.L. Increase in the rate and uniformity of coastline erosion in Arctic Alaska. Geophysical Research Letters. 2009; 36: 03503. http://dx.doi.org/10.1029/2008GL036205.
- Jones B.M., Hinkel K.M., Arp C.D., Eisner W.R. Modern erosion rates and loss of coastal features and sites, Beaufort Sea coastline, Alaska. Arctic. 2008; 61: 361–372.
- Kattsov V.M., Walsh J.E., Chapman W.L., Govorkova V.A., Pavlova T.V., Zhang X. Simulation and projection of Arctic freshwater budget components by the IPCC AR4 global climate models. Journal of Hydrometeorology. 2007; 8: 571–589.
- Kobayashi N., Vidrine J.C., Nairn R.B., Soloman S.M. Erosion of frozen cliffs due to storm surge on Beaufort Sea Coast. Journal of Coastal Research. 1999; 15: 332–344.
- Kristensen L., Benn D.I., Hormes A., Ottesen D. Mud aprons in front of Svalbard surge moraines: evidence of subglacial deforming layers or proglacial glaciotectonics?. Geomorphology. 2009; 111: 206–221.
- Kvamstø N.G., Steinskog D.B., Stephenson D.B., Tjøstheim D.B. Estimation of trends in extreme melt-season duration at Svalbard. International Journal of Climatology. 2012; 32: 2227–2239.
- Lantuit H., Atkinson D.E., Overduin P.P., Grigoriev M., Rachold V., Grosse G., Hubberton H. Coastal erosion dynamics on the permafrost-dominated Bykovsky Peninsula, north Siberia, 1951–2006. Polar Research 30. 2011. http://dx.doi.org/10.3402/polar.v30i0.7341 article no. 7341.
- Lantuit H., Overduin P.P., Couture N., Wetterich S., Are F., Atkinson D., Brown J., Cherkashov G., Drozdov D., Forbes D.L., Graves-Gaylord A., Grigoriev M., Hubberten H.W., Jordan J., Jorgenson T., Ødegård R.S., Ogorodov S., Pollard W., Rachold V., Sedenko S., Solomon S., Steenhuisen F., Streletskaya I., Vasiliev A. The Arctic Coastal Dynamics database. A new classification scheme and statistics on Arctic permafrost coastlines. Estuaries and Coasts. 2012; 35: 383–400.
- Lantuit H., Overduin P.P., Wetterich S. Recent progress regarding permafrost coasts. Permafrost and Periglacial Processes. 2013; 24: 120–130.
- Lantuit H., Pollard W.H. Temporal stereophotogrammetric analysis of retrogressive thaw slumps on Herschel Island, Yukon Territory. Natural Hazards and Earth System Sciences. 2005; 5: 413–423.
- Lantuit H., Pollard W.H. Fifty years of coastal erosion and retrogressive thaw slump activity on Herschel Island, southern Beaufort Sea, Yukon Territory, Canada. Geomorphology. 2008; 95: 84–102.
- Lewis K.C., Zyvoloski G.A., Travis B., Wilson C., Rowland J. Drainage subsidence associated with Arctic permafrost degradation. Journal of Geophysical Research—Earth Surface. 2012; 117: 04019. http://dx.doi.org/10.1029/2011JF002284.
- Liverman D.G.E., Forbes D.L., Boger R.A. Coastal monitoring on the Avalon Peninsula. Current Research, Newfoundland Department of Mines and Energy, Geological Survey Branch, Report. 1994; 94-1: 17–27.
- Lothe A., Finseth J. Coastal structures at Svalbard: lessons learned from structures in the past. 2012; Trondheim: SINTEF Building and Infrastructure. Internal report.
- Mangerud J., Bolstad M., Elgersma A., Helliksen D., Landvik J.Y., Lønne I., Lycke A.K., Salvigsen O., Sandahl T., Svendsen J.I. The last glacial maximum on Spitsbergen, Svalbard. Quaternary Research. 1992; 38: 1–31.
- Manson G.K., Solomon S.M., Forbes D.L., Atkinson D.E., Craymer M. Spatial variability of factors influencing coastal change in the western Canadian Arctic. Geo-Marine Letters. 2005; 25: 138–145.
- Mars J.C., Houseknecht D.W. Quantitative remote sensing study indicates doubling of coastal erosion rate in past 50 yr along a segment of the Arctic coast of Alaska. Geology. 2007; 35: 583–586.
- Nicholls R.J., Wong P.P., Burkett V.R., Codignotto J.O., Hay J.E., McLean R.F., Ragoonaden S., Woodroffe C.D. Parry M.L. Coastal systems and low-lying areas. Climate change 2007. Impacts, adaptation and vulnerability. Contribution of Working Group ll to the fourth Assessment Report of the Intergovernmental Panel on Climate Change. 2007; Cambridge: Cambridge University Press. 315–356.
- Nilsen F., Cottier F., Skogseth R., Mattsson S. Fjord–shelf exchanges controlled by ice and brine production: the interannual variation of Atlantic Water in Isfjorden, Svalbard. Continental Shelf Research. 2008; 28: 1838–1853.
- Niu F., Wu Q., Ma W., Cheng G. Thermal status of the main roadbeds of the Qinghai–Tibet railway in permafrost regions after 5 years’ service. Cold Regions Engineering. 2012; 2012: 424–433.
- Norwegian Mapping Authority. Tidevannstabell. Ny-Ålesund, Svalbard. (Tide table. Ny-Ålesund.). 2014. Accessed on the internet at http://vannstand.no/index.php/nb/tidevannsdata/tidevannstabell on 1 September 2014.
- Ødegård R., Sollid J. Coastal cliff temperatures related to the potential for cryogenic weathering processes, western Spitsbergen, Svalbard. Polar Research. 1993; 12: 95–106.
- Ogorodov S.A., Belova N.G., Kamalov A.M., Noskov A.I., Volobueva N.N., Grigoriev M.N., Wetterich S., Overduin P.P. Storm surges as a forcing factor of coastal erosion in the western and eastern Russian Arctic. 2010; Hamburg. Paper presented at Storm Surges Congress 2010: Risk and Management of Current and Future Storm Surges. 13–17 September 2010.
- Overduin P.P., Strzelecki M.C., Grigoriev M.N., Couture N., Lantuit H., St-Hilaire-Gravel D., Günther F., Wetterich S. Coastal changes in the Arctic. Geological Society of London Special Publication. 2014; 388: 103–129.
- Overeem I., Anderson R.S., Wobus C.W., Clow G.D., Urban F.E., Matell N. Sea ice loss enhances wave action at the Arctic coast. Geophysical Research Letters. 2011; 38: 17503. doi: http://dx.doi.org/10.1029/2011GL048681.
- Ramos M., Hasler A., Vieira G., Hauck C., Gruber S. Drilling and installation of boreholes for permafrost thermal monitoring on Livingston Island in the maritime Antarctic. Permafrost and Periglacial Processes. 2009; 20: 57–64.
- Rennert K.J., Roe G., Putkonen J., Bitz C.M. Soil thermal and ecological impacts of rain on snow events in the circumpolar Arctic. Journal of Climate. 2009; 22: 2302–2315.
- Rowan D.E., Péwé T.L., Péwé R.H., Stuckenrath R. Holocene glacial geology of the Svea Lowland, Spitsbergen, Svalbard. Geografiska Annaler Series A. 1982; 64: 35–51.
- Rowland J.C., Jones C.E., Altmann G., Bryan R., Crosby B.T., Hinzman L.D., Kane D.L., Lawrence D.M., Mancino A., Marsh P., McNamara J.P., Romanvosky V.E., Toniolo H., Travis B.J., Trochim E., Wilson C.J., Geernaert G.L. Arctic landscapes in transition: responses to thawing permafrost. Eos, Transactions of the American Geophysical Union. 2010; 91: 229–230.
- Sessford E.G. Spatial and temporal analysis of Holocene coastal development: applications to erosion assessment and cultural heritage mitigation in Svalbard . 2013; University of Oslo. MSc thesis.
- Sessford E.G., Hormes A. Quaternary geological and geomorphological maps of Fredheim and Skansbukta. 2013; Tromsø: Norwegian Polar Institute. Norwegian Polar Institute Rapportserie 142.
- Sessford E.G., Strzelecki M.C., Hormes A. Reconstruction of past patterns of change in a High Arctic coastal landscape, southern Sassenfjorden, Svalbard. Geomorphology. 2015; 234: 98–107.
- Solomon S.M. Spatial and temporal variability of shoreline change in the Beaufort–Mackenzie region, Northwest Territories, Canada. Geo-Marine Letters. 2005; 25: 127–137.
- Solomon S.M., Forbes D.L., Kierstead B. Coastal impacts of climate change: Beaufort Sea erosion study. 1994; Ottawa: Geological Survey of Canada. Open File 2890.
- Strzelecki M.C. Cold shores in warming times—current state and future challenges in High Arctic coastal geomorphological studies. Quaestiones Geographicae. 2011a; 30: 103–115.
- Strzelecki M.C. Schmidt hammer tests across a recently deglaciarized rocky coastal zone in Spitsbergen—is there a “coastal amplification” of rock weathering in polar climates?. Polish Polar Research. 2011b; 32: 239–252.
- Thieler E.R., Himmelstoss E.A., Zichichi J.L., Ergul A. The Digital Shoreline Analysis System (DSAS) version 4.0—an ArcGIS extension for calculating shoreline change . 2009; Woods Hole, MA: US Geological Survey. U.S. Geological Survey Open-File Report 2008-1278.
- Walczowski W., Piechura J. Influence of the West Spitsbergen current on the local climate. International Journal of Climatology. 2011; 31: 1088–1093.
- Westermann S., Boike J., Langer M., Schuler T.V., Etzelmüller B. Modeling the impact of wintertime rain events on the thermal regime of permafrost. The Cryosphere. 2011; 5: 945–959.
- Westermann S., Lüers J., Langer M., Piel K., Boike J. The annual surface energy budget of a High-Arctic permafrost site on Svalbard, Norway. The Cryosphere Discussions. 2009; 3: 631–680.
- Wold M., Guegan E., Bæverford M.G., Finseth J. SAMCoT field report: instrumentation of coastal erosion at Vestpynten, Svalbard; installation of electrical piezometers and thermistor strings . 2012; Trondheim: SINTEF.
- Wu Q., Dong X., Liu Y., Jin H. Responses of permafrost on the Qinghai–Tibet Plateau, China, to climate change and engineering construction. Arctic, Antarctic, and Alpine Research. 2007; 39: 682–687.