
Abstract
We analyse surface sediment and its distribution in Flandres Bay, West Antarctic Peninsula, in order to understand modern day sediment dispersal patterns in a fjord with retreating, tidewater glaciers. The surface sediment descriptions of 41 cores are included in this study. The sediment facies described include muddy diatomaceous ooze, diatomaceous mud, pebbly mud, sandy mud and mud, with scattered pebbles present in most samples. In contrast to a traditional conceptual model of glacial sediment distribution in fjords, grain size in Flandres Bay generally coarsens from the inner to outer bay. The smallest grain size sediments were found in the bay head and are interpreted as fine-grained deposits resulting from meltwater plumes and sediment gravity flows occurring close to the glacier front. The middle of the bay is characterized by a high silt percentage, which correlates to diatom-rich sediments. Sediments in the outer bay have a high component of coarse material, which is interpreted as being the result of winnowing from currents moving from the Bellingshausen Sea into the Gerlache Strait. Palaeoenvironmental reconstructions of glacial environments often use grain size as an indicator of proximity to the ice margin. After a detailed analysis of a large number of cores collected in the study area, our findings highlight the variability in sedimentation patterns within a fjord and provide a valuable evidence of the complexity that may occur in the sedimentary record.
To access the supplementary material for this article, please see the supplementary files under Article Tools, online.
Studies focusing on the analysis of the sedimentary facies in glacial marine environments, both in the northern and southern hemispheres, have resulted in a variety of conceptual models of sediment distribution (Anderson et al. Citation1980; Powell Citation1981, Citation1984; Anderson et al. Citation1983; Elverhoi et al. Citation1983; Gilbert Citation1983; Molnia Citation1983; Elverhoi Citation1984; Powell & Molnia Citation1989; Syvitski Citation1989; Domack & Ishman Citation1993; Ishman & Domack Citation1994; Powell & Domack Citation1995; Anderson Citation1999). Numerous proxies are taken into account when developing such models: lithology, grain size and texture, micromorphology, sedimentary structures, bedding contacts, stratigraphic relations and biologic influence. The sediment deposits in these glaciated areas include diamictons, gravelly to sandy muds, turbidites, diatomaceous muds and diatomaceous oozes. In nearly all models of sediment distribution, the coarser sediments are usually found closer to the head of the fjord, near the ice front, and decrease in size towards the fjord mouth. Because primary productivity increases away from the glacier front, a higher biogenic component in the sediment is expected at the mouth of the bays. Palaeoreconstructions of depositional environments in fjords and other glacial marine environments are based on observations and descriptions of sediment down core as well as by our understanding of modern sediment distribution (e.g., Smith & Schafer Citation1987; Kennedy & Anderson Citation1989; Jennings & Weiner Citation1996; Warner & Domack Citation2002; Hillenbrand & Ehrmann Citation2005; Heroy et al. Citation2008; Michalchuk et al. Citation2009; Milliken et al. Citation2009; Anderson et al. Citation2011; Fernandez, Anderson, Bertrand et al. Citation2011; Majewski et al. Citation2012; Cowan et al. Citation2014). Understanding sediment distribution is critical for studies reconstructing glacial and ice-sheet behaviour based on palaeo-records (e.g., Naish et al. Citation2009; Anderson et al. Citation2011; Fernandez, Anderson, Wellner et al. Citation2011; Stokes et al. Citation2015).
Numerous factors control sedimentation in Antarctic fjords, including climate, seafloor topography, bay geometry, oceanographic regime, the presence of sea ice, the size of drainage areas and proximity to sediment sources (Griffith & Anderson Citation1989; Domack & McClennen Citation1996; Ashley & Smith Citation2000). In addition, the glacial behaviour contributes and may ultimately provide the terrigenous output. Each of these contributes differently to the distribution of sediment along the bays. Characteristics of single bay systems are difficult to integrate and quantify since they can be widely variable, from the number of glaciers draining into a single bay to processes carrying and depositing sediment in and out of the bay. Nevertheless, they can have an enormous effect on the deposition and distribution of sediment, sometimes obscuring the trends that are expected for given environments (Gilbert et al. Citation2002; Wolfl et al. Citation2014). Therefore, when applying any model of sediment distribution in a fjord environment, one must take into account how local variations of bay systems may be expressed in the sediment record. In this study, we analyse sediment grain size, lithology, and distribution in a bay in the West AP. Using a dense collection of marine sediment cores, the known modern glacial climate of the region, oceanographic and bathymetric controls, we assess the general trends within these deposits and how local variations affect sediment distribution.
Study area
Background
The AP is heavily glaciated (); however, very different climate regimes characterize the eastern and western AP, even at the same latitude. In general, the eastern side is cooler, with extensive ice shelves, while the western side is warmer and wetter, with small tidewater glaciers draining into fjords and bays. According to Cook et al. (Citation2014), the drainage areas of the tidewater glaciers in the AP average 130 km2, but some can be over 6000 km2. Tidewater glaciers are very sensitive to climatic changes and respond rapidly to fluctuations in the environment because they are thin compared to ice sheets, have small drainage areas and have high accumulation rates (Anderson Citation1999). Rapid sediment accumulation in fjords results in a high-resolution sedimentary record that can be used as a tool to reconstruct local glacial behaviour (Griffith & Anderson Citation1989; Syvitski Citation1989, Citation1991; Wellner et al. Citation2001; Anderson et al. Citation2002). The westerly winds increase summer warming in the AP by bringing warm, maritime air that lead to basal melt and loss of ice.
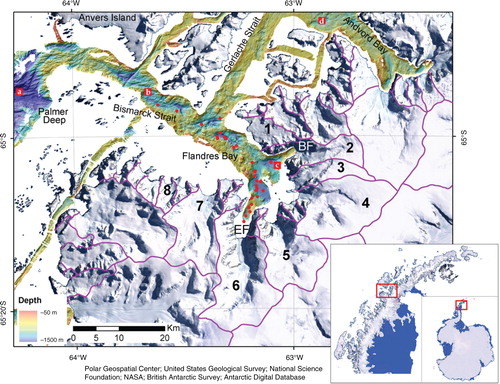
Fig. 1 Map of Flandres Bay, located in the western AP. Insets show the location of the AP with respect to Antarctica and the location of the study area. Seafloor bathymetry mapped using multibeam swath bathymetry data from cruises NBP0201, NBP0502, NBP0602A, NBP0703 and NBP1001 to the AP. Red circles represent core locations. Glacial drainage basins of glaciers are outlined in purple (from Cook et al. Citation2014). Briand Fjord and Etienne Fjord are abbreviated as BF and EF. Numbers show glaciers draining into Flandres Bay: 1, Vogel Glacier; 2, Bolton Glacier; 3, Sayce Glacier; 4, Goodwin Glacier; 5, Archer Glacier; 6, Talbot Glacier; 7, Niepce Glacier; 8, unnamed glacier; letters in red squares show 210Pb sedimentation rates: a, 1.71 mm/yr; b, 1.17 mm/yr; c, 2.8 mm/yr; d, 0.65 mm/yr (Isla et al. Citation2002; Isla et al. Citation2004; Boldt et al. Citation2013).
The prevailing westerlies drive surface waters around the continent towards the east creating the Antarctic Circumpolar Current. Temperatures in the Southern Ocean have risen 0.17°C between the 1950s and the 1980s, mainly along the Antarctic Circumpolar Current (Gille Citation2002), and especially near the western AP, where sea surface summer temperatures have risen more than 1°C in the same time period (Meredith & King Citation2005). Recent data suggest that the Antarctic Circumpolar Current has shifted south due to stronger westerly winds (Bi et al. Citation2002; Hall & Visbeck Citation2002; Lubin et al. Citation2008). This in turn brings warmer water to fjords in the western AP. The presence of warmer water masses closer to the continent increases basal melting in glaciers and ice shelves (Domack et al. Citation2003; Rignot et al. Citation2008; Hellmer et al. Citation2012; Pritchard et al. Citation2012). In this case, the bathymetric morphology becomes critical since dense water masses would not override topographic highs, for example sills, in the ocean floor (Smith et al. Citation1999), which are characteristic of many fjords (Elverhoi et al. Citation1983; Skei Citation1983).
Setting
Flandres Bay (65°3′S, 63°14′W) is located in the Danco Coast, north of the Graham Coast in the western side of the AP, south-east of Anvers Island (). The bay is about 30 km long and 20 km wide and it is surrounded by numerous small tidewater glaciers that drain the AP ice cap (, ). The drainage size area of glaciers terminating into this bay varies in size from less than 10 to 215 km2 (Cook et al. Citation2014). The head of the bay is characterized by a series of embayments where tidewater glaciers drain into the bay. The largest embayments are Briand Fjord in the northern margin and Etienne Fjord in the southern margin (). Cook and co-workers (Citation2005, Citation2014) measured glacier front retreat of various tidewater glaciers terminating in Flandres Bay, including Bolton Glacier, Sayce Glacier, Goodwin Glacier, Archer Glacier, Talbot Glacier, Niepce Glacier and an unnamed glacier (, ). All of them show some degree of retreat, between 55 m (for Archer Glacier) and 607 m (for Talbot Glacier), measured from the 1940s to the early 2000s. However, no direct correlation was found between the size of the drainage area and the retreat distance (Cook et al. Citation2014).
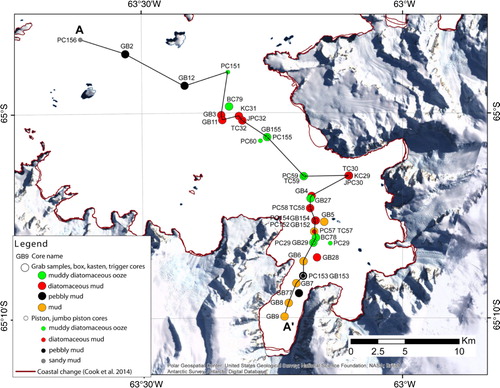
Fig. 2 Grab samples and cores collected in Flandres Bay: grab sample (GB), box core (BC), kasten core (KC), trigger core (TC), piston core (PC) and jumbo piston core (JPC). Some cores were collected in pairs (one grab sample and one piston core for example); therefore, a small circle and a large circle are in the same location. Names of each core correspond to core identification numbers in Supplementary Table S1. The profiles line A–A’ is presented in . Maroon outlines show glacier front change as measured by Cook et al. (Citation2014).
Flandres Bay is protected from open ocean conditions by Anvers Island and has been classified as having a dry, subpolar climate (Griffith & Anderson Citation1989; Boldt et al. Citation2013), separating the warm, wet subpolar bays in the north from the dry, polar bays in the south. Atmospheric temperatures vary from slightly above 0°C in the summers to −8°C to −11°C in the winters (Domack & Ishman Citation1993; King et al. Citation2003). However, atmospheric temperature records from Faraday/Vernadsky station (50 km south of Flandres Bay) show a warming of 5.7±1.6°C/century, the highest for the AP area where the average warming is 3.7±1.6°C/century (Vaughan et al. Citation2003). In situ observations at Faraday/Vernadsky station show that annual precipitation days have increased by 12.4 days/decade since the early 1950s (Turner et al. Citation2005), while in an ice core collected in the south-west AP, Thomas et al. (Citation2008) calculated a doubling of snow accumulation since the 1850s.
In a map from the American Geographical Society published in 1969, compiled by R.J. Adie, no rock outcrops are identified in Flandres Bay. However, the exposed rocks in the surrounding areas, the south-eastern region of Anvers Island and the regions directly across the AP, on the eastern side of the AP, are composed of Upper Jurassic volcanic rocks and Lower Tertiary to Upper Cretaceous Andean intrusive rocks (granite, granodiorite and tonallite). It is likely that these same rock types underlie the glaciers that drain into Flandres Bay.
Flandres Bay is located eastward of the Bismarck Strait (), at the southern end of the Gerlache Strait that connects the Bransfield Strait in the north and the Bellingshausen Sea in the south. The western side of the AP receives incursions of Upper Circumpolar Deep Water, which brings oceanic, relatively warm (>1.5°C), saline (34.3–34.8), nutrient-rich water to this area (Ishman & Domack Citation1994; Domack et al. Citation2003). However, this water mass may experience modifications near the bays resulting from local conditions like sea-ice formation and meltwater from glaciers (Smith et al. Citation1999; Martinson et al. Citation2008; Allen et al. Citation2010).
Sea ice has a major influence in the AP glacial marine sedimentation, largely affecting primary productivity. The intrusion of the warm Upper Circumpolar Deep Water into the shelf in this area, combined with warming atmospheric temperatures in the western AP (Vaughan et al. Citation2003; Turner et al. Citation2013), influence sea-ice formation, thickness and persistence through the seasons (Smith & Klinck Citation2002; Stammerjohn et al. Citation2008; Stammerjohn et al. Citation2012). Stammerjohn and co-workers (Citation2012) have reported that the sea-ice season in the AP and the Bellingshausen Sea has been reduced by more than three months between 1979–1980 and 2010–2011. Considering this, an intriguing sea-ice behaviour occurs in Etienne Fjord, where fast sea ice was directly observed to cover the entire fjord during the austral summers of 1988 (PD1988-III), 2002 (NBP0201), 2007 (NBP0703) and 2012 (NBP1203). Sea-ice thicknesses in Etienne Fjord have not been measured.
Results from 210Pb analyses show that modern sediment accumulation rates in the western AP are highly variable (), for example, accumulation rates in the Gerlache Strait vary from 0.65 to 3.1 mm/yr (Isla et al. Citation2002; Isla et al. Citation2004), but can be as high as 5.1 mm/yr (Harden et al. Citation1992). Whereas in the inner area of Flandres Bay accumulation rates are 2.8–3 mm/yr (Boldt et al. Citation2013), and in the outer bay/Bismarck Strait the accumulation rate is 1.17 mm/yr (Isla et al. Citation2002; Isla et al. Citation2004). Further west, in the area around Palmer Deep, the measured 210Pb accumulation rate is 1.71 mm/yr (Isla et al. Citation2002; Isla et al. Citation2004). Clearly, there is a high variability in sediment accumulation rates that are the result of a wide variety of processes influencing these different areas.
Methods
Multibeam
Swath bathymetry data were collected onboard the RV/IB Nathaniel B. Palmer on multiple expeditions to Flandres Bay, including NBP0201, NBP0502, NBP0602A, NBP0703 and NBP1001. Multibeam soundings were collected in a swath perpendicular to the ship track using a Simrad EM120 12 kHz swath profiler hull-mounted with 191 beams. During collection, the data were corrected using sound-velocity and conductivity–temperature–depth profiles, then edited by the scientific party onboard. Maps were created in ArcGIS®, using a resolution of 20 m ().
Sediment cores
US Antarctic Program expeditions have collected a total of 41 cores from 1982 to 2007 in Flandres Bay (Supplementary Table S1). Core types include grab samples, box cores, kasten cores, trigger cores, piston cores and jumbo piston cores. They were described and logged onboard, including colour (using a Munsell soil colour chart), grain size and texture, laminations, dropstones, ice-rafted debris, fossil content, organic matter and bioturbation. Additional observations were made in the national core repository, the Antarctic Research Facility at Florida State University in Tallahassee, Florida. For the purposes of this study, only the surface sediment, which represents modern sediments, was analysed in each core. The list of all the cores included in this study is presented in Supplementary Table S1. shows the locations and names of the cores in Flandres Bay. Cores are separated in two groups; the first group includes the grab samples and short cores (box, trigger and kasten cores, 27 in total). These are more likely to preserve the sediment water interface because recovery of these cores involves a low impact operation. The second group includes an additional 14 cores, piston and jumbo piston cores. Note that 10 of these cores were collected in the same location or very close to a grab sample or short core ( shows a small circle and a large circle representing the cores in the same location). The medium to high impact operation required to recover piston and jumbo piston cores makes them less likely to preserve the sediment–water interface. However, we include them in this study for completeness and to demonstrate that in almost all the cases (one is the exception) the short core sediment description and the long core sediment description are very similar, resulting in the same sediment facies. This enables us to rely on findings where only a jumbo piston or piston core was collected and not a short core (which is the case in four sites in this study). Supplementary Table S1 also shows which cores were sampled for grain size and smear slide counts of lithology. Grain size was measured using a Malvern Mastersizer 2000 Laser Particle Size Analyzer. Particle sizes between 0.02 and 2000 µm can be accurately measured using this instrument. The sediment was not treated to remove the biogenic component. The grain size percentiles from the Laser Particle Size Analyzer were separated into clay (<4 µm), fine silt (4–24 µm), medium silt (24–44 µm), coarse silt (44–63 µm) and sand (>63 µm). Mean, skewness, kurtosis and sorting were calculated using the formulas of Folk & Ward (Citation1957). Pebbles were not described quantitatively; instead, descriptive terms are included for each sediment sample: abundant, common, scattered, and none observed in the sample. Published cruise reports from the Deep Freeze operation DF85 and NBP0703 include smear slide counts of percentage abundance of lithologic constituents of sediment in cores. Smear slides were made for cores that did not have this information using the same procedure as described in these cruise reports (Cassidy Citation1984; Bryan Citation1992a, Citationb; Hovan & Janecek Citation1994a, Citationb). The abundance of quartz, clay, diatoms, feldspar, mica, heavy minerals and hornblende on the smear slide was quantitatively recorded using a petrographic microscope with a capacity for 900X magnification. The constituents were counted in a transect using a grid over the entire smear slide so that all grains sampled were reported. Facies were created based on grain size, lithology and pebbles found in the sediment.
Results
Bathymetry
The seafloor topography of Flandres Bay is very rugged with the exception of deep basins, which have a flat bottom and very gentle slopes (). Slope maps of the bathymetry show lower relief areas in the inner bay and parts of the Gerlache Strait, and highly rugged topography in the outer bay. The inner bay is separated from the outer bay by a sill, an elongated, transverse ridge, with an average depth of 350 m. The inner bay is composed of two low relief basins, one with an area of about 2000 km2 and the other approximately 7000 km2, both over 700 m deep. Etienne Fjord, located in the southern margin of Flandres Bay, has only been partially surveyed. At its centre, it is characterized by an extensive, flat basin, approximately 500 m deep. Etienne Fjord is separated from the Flandres inner bay by a shallow sill, approximately 290 m deep. Briand Fjord, located on the northern margin of Flandres Bay, exhibits a distinct morphology compared to Etienne Fjord. A shallow sill (ca. 270 m deep) is also present in Briand Fjord, separating it from the main inner bay area. The depths in Briand Fjord do not vary drastically; the deepest point located in the centre of the fjord is only 360 m deep. The flanks of the fjord were found to have low relief and be relatively shallow too.
Outer Flandres Bay is characterized by a more rugged bathymetry with several small basins with flat bottoms. These basins range in area between 750 and 1200 km2 and are elongated, nearly parallel along the axis of the bay. The regions towards the Bismarck Strait, in the west end of Flandres Bay, deepen and increase in ruggedness while the regions towards the Gerlache Strait, north-east of Flandres Bay, shallow and flatten ().
Surface sediment description
Sediment texture and lithology
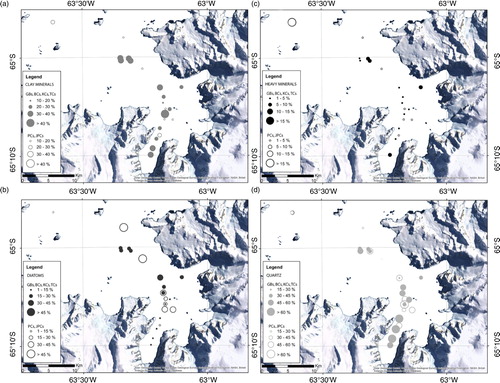
Surface sediment samples were analysed for grain size and lithology content (Supplementary Table S1). Silt size (4–63 µm) is the dominant grain size with 63–79%, clay (<4 µm) follows with 13–35% and sand (>63 µm) is the lowest constituent, with 2–19% (, Supplementary Fig. S1). Within the silt size range (4–63 µm), fine silt (4–24 µm) has 44–63% of the total grains in the sample, while medium silt (24–44 µm) composes 6–18%, and coarse silt (44–63 µm) only 2–8% of the total grains measured per sample. The distributions of grain size along Flandres Bay are shown in the maps in . Quartz, diatoms, clay minerals, and heavy minerals make up the majority of the lithology found in the samples, although minor amounts of feldspar, mica and hornblende were also found. Of the total grains in the sediment sample, quartz grains constitute 26–66%, diatoms varied widely between 1 and 60%, clay minerals were 10–43% and heavy minerals were 0–16%. Feldspar, mica and hornblende compose less than 5% of the total grains in the sediment samples. Maps presenting the amounts of clay minerals, diatoms, heavy minerals and quartz found in the smear slides are shown in . In order to determine sediment sources throughout Flandres Bay, changes in sediment lithology and grain size were studied in relation to water depth (shallow to deep) and in relation to distance along the fjord axis (head to mouth). For the purposes of this study, the head of the bay is in Etienne Fjord, where samples were collected closest to the ice front, while the Bismarck Strait represents the mouth of the bay, which is the farthest from the ice front and in semi-open water conditions. The calculated mean, skewness, kurtosis and sorting were also studied using these relations. A slight increase in the mean and mode of the grain size was found from the inner to the outer bay as well as with increasing depth. Skewness, kurtosis and sorting are relatively stable in the inner and outer bay and at all water depths.
Fig. 3 Distribution maps of percent grain size along the bay: (a) clay, (b) total silt and (c) sand percentages per sample. Solid circles represent grab samples (GB), box cores (BC), kasten cores (KC) or trigger cores (TC). Open circles represent piston cores (PC) or jumbo piston cores (JPC). Sampled cores are listed in Supplementary Table S1.
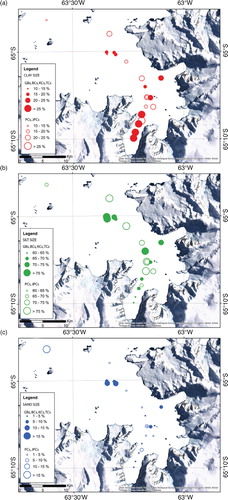
Fig. 4 Distribution maps of percent lithology along the bay: (a) clay minerals, (b) diatoms, (c) heavy minerals and (d) quartz percentages per sample. Solid circles represent grab samples (GB), box cores (BC), kasten cores (KC) or trigger cores (TC). Open circles represent piston cores (PC) or jumbo piston cores (JPC). Sampled cores are listed in Supplementary Table S1.
Core sample locations vary between 171 m water depth (in the distal part of Etienne Fjord) and 723 m water depth (in the distal part of Briand Fjord) (Supplementary Table S1). There is a general trend of increasing grain size as water depth increases (). The relative percentage of sand grains increases from 3% in the shallowest depth to 10–12% in the deepest sample location; clay size decreases from 27 to 17% from shallowest to deepest sampled area; and while total silt (4–63 µm) remains constant, the fine silt (4–24 µm) component also decreases with depth. Lithologic components remain relatively constant with water depth ().
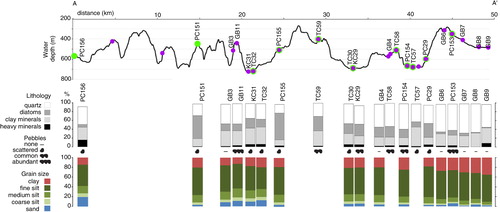
Fig. 5 Profile line A–A’ showing water depth, location in . The circles in the profile line represent sampled cores with their resulting percent lithology, percent grain size and pebbles. Name of each core is also shown. Purple circles represent grab samples (GB), box cores (BC), kasten cores (KC) or trigger cores (TC). Green circles represent piston cores (PC) or jumbo piston cores (JPC). Notice that not all sampled cores are shown in this figure, only cores in the profile line A–A’.
There is a general trend of increasing grain size away from the head of the fjord (, ). In almost all the samples, percent sand increases (from 2 to 19%) and percent clay decreases (from 35 to 14%) away from the head of the bay (). Total silt (4–63 µm) remains relatively constant but coarse (44–63 µm) and medium (24–44 µm) silt increase from the head to the fjord mouth (, ). The percent of diatoms increases towards the middle of the bay (from 1% in the fjord head to 60% in mid-Flandres Bay) and then decreases again in the outer bay (). Etienne Fjord has the least amount of diatoms, percentages decrease to 1.4% of the total sediment (). Clay minerals were found throughout the bay in, approximately, the same amounts with no apparent change from head to mouth. Percent quartz has a general decrease away from the fjord head, the highest values were found in Etienne Fjord (52–66% quartz) (, ).
Sediment facies and distribution
Five sediment facies are defined using results from grain size and lithological analysis: (1) muddy diatomaceous ooze, containing >30% diatoms with a mixture of clay and silt <70%, <15% sand, and none to common pebbles; (2) diatomaceous mud, containing between 15 and 30% diatoms, a mixture of clay and silt > 70%, <15% sand, and none to common pebbles; (3) pebbly mud, <15% diatoms, a mixture of clay and silt >70%, <15% sand, and abundant pebbles of varying sizes; (4) sandy mud, <15% diatoms, a mixture of clay and silt >70%, between 15% and 30% sand, and scattered pebbles of varying sizes; and (5) mud, <15% diatoms, a mixture of clay and silt >70%, <15% sand, and none to common pebbles.
Muddy diatomaceous ooze was found in the northern outer bay (towards the Gerlache Strait) and in the middle of the bay. Diatomaceous mud covers the basins in the inner and outer bay. Sandy/pebbly mud was found in samples in the outer bay (in Bismarck Strait) and in the distal part of Etienne Fjord (inner bay). Mud was only found in samples collected in the central and distal regions of Etienne Fjord (, , ).
Fig. 6 Sediment distribution in Flandres Bay draped over swath bathymetric data indicating bottom roughness.
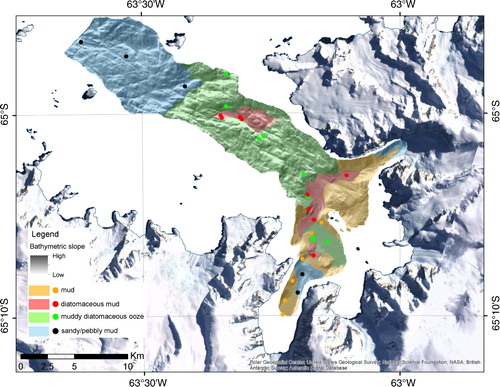
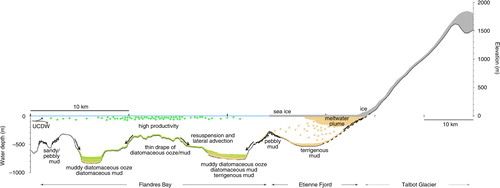
Fig. 7 Illustration representing various sediment distribution processes taking place in Etienne Fjord and Flandres Bay. Upper Circumpolar Deep Water is abbreviated to UCDW. Note different horizontal scale used in Talbot Glacier (elevation for Talbot Glacier from Cook et al. Citation2014).
Discussion
Glacier front retreat and ice cover
The glaciers in Flandres Bay analysed by Cook and co-workers (Citation2005, Citation2014) are Bolton Glacier (which drains into Briand Fjord), Talbot Glacier (which drains into Etienne Fjord), Sayce Glacier, Goodwin Glacier, Archer Glacier, Niepce Glacier and an unnamed glacier (). Although in varying amounts, all of these glaciers show retreat; the largest retreat corresponds to Talbot Glacier which shows a glacier front retreat of 607 m from 1968 to 1997 and the shortest is Archer Glacier with 55 m of glacier front retreat in the same time span (, data from complimentary material of Cook et al. Citation2005; Cook et al. Citation2014). These two glaciers are next to each other, have similar drainage basin areas, and are exposed to the same atmospheric temperatures; therefore, the different rates of retreat suggest that other factors influence glacier front retreat besides atmospheric temperature. Six sediment samples have been collected in Etienne Fjord, where the highest glacier ice front retreat has taken place: one piston core during DF82 (that recovered pebbly mud facies); one grab sample during DF86 (that recovered pebbly mud facies); and four Smith-McIntyre grab samples during PD90-VII (which recovered mud facies) (, , ). Although the recovery of these sediments took place over a multi-year span of time, there is no evidence pointing to a fundamental change in sediment facies; the retreat rate of Talbot Glacier is 20 m/yr in average (607 m, measured from 1968 to 1997) and the core locations are approximately between 4 and 9 km away from the glacier ice front; therefore, there is a high likelihood that the sediments are representative of the same depositional conditions over the eight-year span of time that passed between the first sediment sample collected (1982) and the last (1990). In addition, PC153, collected in 1982, is composed of a single sediment facies; pebbly mud throughout the entire core length, 46 cm (Cassidy Citation1984), which suggests that the sedimentary environment has remained unchanged for a long time. However, there are no age constrains or sediment accumulation rates available for sediments from Etienne Fjord and no sediment samples have been collected in this area since 1990. The mud was sampled in the middle of the fjord, a deep and flat basin. The lithology of the analysed samples in Etienne Fjord is composed of >50% quartz, between 20 and 35% clay and less than 6% diatoms (, ). Particle size is dominated by fine silt (4–24 µm), 53–58%, and clay, 25–35% (, ). This lithology and grain size are characteristic of suspended sediment delivered by meltwater plumes (Syvitski & Murray Citation1981; Elverhoi et al. Citation1983; Ó Cofaigh & Dowdeswell Citation2001). The sediment collected in the middle of the fjord (approximately 500 m deep) had scattered to no pebbles, which may be an indication that no ice rafting or downslope sediment redistribution has occurred in this area (). Fast sea ice has been observed to cover Etienne Fjord entirely, especially during the austral summers, when cruises PD1988-III (1988), NBP0201 (2002), NBP0703 (2007) and NBP1202 (2012) visited the area. The low biogenic content in the sediment could be the result of continuous ice cover in the fjord since permanent sea-ice results in lower biogenic productivity (Leventer et al. Citation1996). However, the lack of data on sediment and organic fluxes makes this assumption difficult to assess. The only cruise that has successfully sampled the middle of Etienne Fjord was PD90-VII (1990). The distal area of Etienne Fjord (with a depth of approximately 290 m) is covered by pebbly mud (, ).
The sediment facies found in Etienne Fjord do not follow the typical sediment distribution for a glaciated fjord environment. These models propose that coarser grains are found close to the ice front and particles decrease in size distally. Additionally the biogenic component should increase away from the ice front. Although the fjord has scattered sediment samples, the sediment in the middle of the fjord is homogeneous mud, with low (<6%) sand size particles, a very low (<6%) biogenic component and no pebbles (, ). The pebbly mud is found only in the outer area of Etienne Fjord. No samples have been collected in the proximal area to the ice front. Unarguably, these sedimentary facies are the result of different depositional processes active in this fjord. Persistent fast sea ice possibly plays an important role in the distribution and lithology of the sediment in the fjord. Additionally, due to the current state of retreat of Talbot Glacier it can be assumed that meltwater plumes are common and the most likely source of fine mud deposited in the middle of Etienne Fjord (). Interestingly, the fine mud deprived from significant biogenic matter and lacking pebbles is similar to a “null zone” interpreted to deposit under an ice shelf away from basal debris (Domack et al. Citation1999). The “null zone” unit ranges between 15 and 40 cm in thickness and it is described as laminated, with very little sand and no pebbles.
Primary production
The middle of Flandres inner bay is characterized by the highest percentage of diatoms (from 39 to 60% of the total grains in the sample) and silt (4–63 µm) particles, in particular fine silt (4–24 µm), which is 50–60% of the total grains in the sample (Figs. (Citation3–Citation5)). In a study in Palmer Deep, an adjacent basin to Flandres Bay (), Warner & Domack (Citation2002) found that the fine to medium silt-sized particles were mostly of biogenic origin (Chaetoceros spores, which are ca. 5–8 µm in size). Using this and other lines of evidence, they concluded that particle size can be used to represent depositional environments. In this case, the silt particles were likely to represent biogenic sedimentation. Although no biogenic flux data has been published for Flandres Bay, Isla and co-workers (Citation2002, Citation2004) reported high primary productivity in the Gerlache Strait area. We therefore suggest that the main sediment source in this part of the bay is, in fact, biogenic productivity. The combination of relatively warm water, low salinity (Leventer et al. Citation1996), meltwater and reduced sea ice (Allen et al. Citation2010) increase biogenic productivity. This may be the case in Flandres Bay if warm Upper Circumpolar Deep Water (>1.5°C) from the Bellingshausen Sea flows into the Bismarck Strait and possibly into Flandres Bay. Increased meltwater from retreating glaciers (Cook et al. Citation2005) and decreased sea-ice cover in the region (Stammerjohn et al. Citation2012) may contribute to enhance high primary production rates. Although we argue for increased meltwater in Etienne Fjord, we estimate the water carries an excess of suspended sediment, which combined with persistent sea-ice cover, results in minor diatom productivity.
Ocean currents
Some areas in the western AP do not have high biogenic accumulation because the material is likely re-suspended or carried by strong currents to adjacent areas. This may be the case in outer Flandres Bay (along the Bismarck Strait), where Isla and co-workers (Citation2002, Citation2004) measured high primary production rates but found low percentages of biogenics in the accumulated sediment. They show percentages of dry weight of sand and found similar results to ours, sand size increases from 1 to 29% from Palmer Deep to Bismarck Strait and into the Gerlache Strait. Sand size then decreases to 5% from the Gerlache Strait out into the Bransfield Strait, suggesting stronger currents in the southern area of the Gerlache Strait, close to Flandres Bay. They conclude that this sediment composition is the result of lateral transport of the biogenic component. The water flowing north towards the Gerlache Strait must be strong enough to carry clay and fine silt-sized particles, leaving behind lag deposits of coarser material. The cores collected in the outer bay are characterized by higher sand percentages, low diatom percentages, and abundant pebbles (Figs. (Citation3–Citation5)). As such, it is likely that these deposits are the result of winnowing of the fine grains and sediment re-suspension events. Additional observations of sediment deposits down core, including grain size, sorting, skewness, and kurtosis would further corroborate our conclusions. In addition, analyses using shallow seismic data would be helpful if we assume sediment is being carried and deposited downstream, most likely in the northern Gerlache Strait. However, this approach requires a more thorough study that would account for the glacial retreat history, the sediment flux, and the interaction of water currents in this area.
Comparison to similar studies
Sediment characteristics, accumulation and distribution varies with climate, seafloor topography, bay geometry, size of drainage basins, oceanographic regime, and distance to glacier front. In a study of Andvord Bay, just north of Flandres Bay (), Griffith & Anderson (Citation1989) describe the inner bay as composed of sandy diatomaceous mud with scattered pebbles and the outer bay as muddy diatomaceous ooze with scattered pebbles, which decrease in abundance towards the mouth of the bay. Another study in the same bay (Domack & Ishman Citation1993) describes a terrigenous facies (sandy muds to muddy sands) close to glaciers and a biosiliceous facies (pebbly muds with high organic carbon and opaline silica) in the centre and towards the mouth of the bay. Sediment distribution is controlled by bay geometry and oceanographic controls while sediment input is controlled by climate and drainage basin. Both studies found sand-rich mud deposits for the inner bay and diatom-rich mud deposits for the outer bay.
In Flandres Bay, grain size increases from head to mouth, while the highest percentage of biogenics is found in the middle of the bay (, ). Oozes occur away from glaciers but inside the bay and into Gerlache Strait, which suggests high productivity in these areas that are likely protected from open water conditions and from strong currents. However, because there are no sediment flux analyses for this bay and no published studies on the activity of ocean currents inside the bay we cannot discard the possibility that these oozes are the result of downstream deposition of material from the outer bay. Sandy/pebbly sediment is present in both the outer and inner bay, although these possibly result from different processes. In the outer bay, this type of sediment is probably the result of strong currents that carry the finer particles northwards, into the Gerlache Strait, or towards the Palmer Deep area. Whereas in Etienne Fjord (inner bay), the sandy/pebbly sediment is likely part of a grounding zone area that formed when glaciers were expanded, in Briand Fjord the same type of sediments results from active deposition of a modern retreating glacier. shows a schematic representation of the various sediment distribution processes that take place in a modern environment like Flandres Bay. We estimate that thicker sediment deposits exist in the middle to outer bay due to longer open marine conditions, which would result in thinner deposits towards the inner bay. An additional analysis of shallow seismic data is necessary to confirm these assumptions.
An unexpected finding in a proximal setting, the middle of Etienne Fjord, is mud with the least percentage of biogenics and scattered to no pebbles because the glacier that feeds into Etienne Fjord (Talbot Glacier) has undergone the highest retreat of all glaciers studied in Flandres Bay (Cook et al. Citation2005; Cook et al. Citation2014). A recent study by Wolfl et al. (Citation2014) in a fjord in King George Island, northern AP, found the same general trend of sediment distribution as our findings in Flandres Bay, an increase in grain size down-fjord, which was explained by an increase in energy conditions away from the bay head. We propose that the dominance of fine-grained sediment in the inner part of Etienne Fjord is a signal of the rapidly retreating ice. Further studies should assess the most proximal deposits of both retreating and advancing, or stable, ice to determine if the fine-grained deposits are truly a signal of rapid retreat, not just distance. However, there is a possibility that the anomalies found in this study may be a result of modern rapid retreat, and not a common event in the sediment record in AP fjords. If we assume that sediment has accumulated in fjord basins continuously since ice started retreating to modern positions, this would result in a very high sediment accumulation, which would eventually change the bathymetry of the fjords. Instead of having a rugged bathymetry, common in bedrock, the seafloor would be smoother, with large sediment deposits filling the basins. If this is the case, then the sediment delivered from retreating glaciers would deposit further down-fjord. In addition, ocean currents would have a higher likelihood of flowing into these areas and removing the finer particles, which would result in winnowed deposits. We propose modern fjord deposits have a greater marine influence, and less glacial influence. Although sediment input is controlled by climate and drainage basin, the marine processes play the main role regarding the distribution of the sediment.
Conclusions
This study presents an analysis of surface sediment in Flandres Bay. The sediment facies found in this study contrasts with other studies that suggest terrigenous deposits occur predominantly in the inner bay while biogenic deposits in the outer bay. In our study, grain size coarsens from inner to outer Flandres Bay. Sediments sampled in the head of the bay have the highest clay component whereas samples collected in the mouth of the bay have the highest sand component. Our findings suggest that discrete areas of the bay are affected differently by varying factors to distribute sediment; these factors include persistent fast sea ice, differential rates of primary productivity and winnowing of fine-grained sediments away from the bay. This variability is reflected in the accumulated deposits and must be considered when analysing sediments down core. Additional factors such as fjord geometry, sediment flux, water currents and glacial retreat history may also play a role in the sediment yield and distribution in Flandres Bay and in other bays in the AP. Further analysis on sedimentation rates, seafloor bathymetry, the role of meltwater and glacier velocities will add to the understanding of the sediment distribution patterns found in this bay. The anomalies found in this study may reflect modern warming trends in the western AP and, if so, then similar patterns should be found in other bays in this region. Our study emphasizes the need to understand how local signatures are reflected in the sediment record, how much variability there is among similar environments/bays, and whether or not this variability obscures regional patterns.
Supplementary Material
Download PDF (284.2 KB)Acknowledgements
Research was funded by the National Science Foundation, Office of Polar Programs grant no. OPP0739596. YM is supported by a National Science Foundation Graduate Research Fellowship. We thank the crew and science parties of all the expeditions that collected data used in this study, the Antarctic Research Facility at Florida State University, and the Rice University Sedimentology Laboratory. We thank Claire Allen, Patricia Manley and an anonymous reviewer for their comments, discussions and suggestions that greatly improved this manuscript.
Notes
To access the supplementary material for this article, please see the supplementary files under Article Tools, online.
Related Research Data
References
- Adie R.J. Geologic map of Antarctica, northern Antarctic Peninsula. Sheet 1, plate 1, folio 12. Geology. Antarctic Map Folio Series. 1969; New York: American Geographical Society.
- Allen C.S., Oakes-Fretwell L., Anderson J.B., Hodgson D.A. A record of Holocene glacial and oceanographic variability in Neny Fjord, Antarctic Peninsula. The Holocene. 2010; 20: 551–564.
- Anderson J.B. Antarctic marine geology. 1999; Cambridge: Cambridge University Press.
- Anderson J.B., Brake C., Domack E.W., Myers N., Wright R. Molnia B.F. Development of a polar glacial–marine sedimentation model from Antarctic Quaternary deposits and glaciological information. Glacial marine sedimentation. 1983; New York: Plenum Press. 233–264.
- Anderson J.B., Kurtz D.D., Domack E.W., Balshaw K.M. Glacial and glacial marine sediments of the Antarctic Continental Shelf. The Journal of Geology. 1980; 88: 399–414.
- Anderson J.B., Shipp S.S., Lowe A.L., Wellner J.S., Mosola A.B. The Antarctic Ice Sheet during the Last Glacial Maximum and its subsequent retreat history: a review. Quaternary Science Reviews. 2002; 21: 49–70.
- Anderson J.B., Warny S., Askin R.A., Wellner J.S., Bohaty S.M., Kirshner A.E., Livsey D.N., Simms A., Smith A.R., Smith T.R., Ehrmann W., Lawver L.A., Barbeau D., Wise S.W., Kulhanek D.K., Weaver F.M., Majewski W. Progressive Cenozoic cooling and the demise of Antarctica's last refugium. Proceedings of the National Academy of Sciences of the United States of America. 2011; 108: 11356–11360.
- Ashley G.M., Smith N.D. Marine sedimentation at a calving glacier margin. Geological Society of America Bulletin. 2000; 112: 657–667.
- Bi D., Budd W.F., Hirst A.C., Wu X. Response of the Antarctic circumpolar current transport to global warming in a coupled model. Geophysical Research Letters. 2002; 29 article no. 2173.
- Boldt K.V., Nittrouer C.A., Hallet B., Koppes M.N., Forrest B.K., Wellner J.S., Anderson J.B. Modern rates of glacial sediment accumulation along a 15° S–N transect in fjords from the Antarctic Peninsula to southern Chile. Journal of Geophysical Research—Earth Surface. 2013; 118: 2072–2088.
- Bryan J.R. Descriptions of sediments recovered by the USCGC Glacier USARP. Operation Deep Freeze 1985. South Orkney Plateau, South Shetland Shelf, Bransfield Strait, Marguerite Bay, Pine Island Bay. Sedimentology Research Laboratory Contribution 54. 1992a; Tallahassee, FL: Antarctic Marine Geology Research Facility.
- Bryan J.R. Descriptions of sediments recovered by the USCGC Glacier. USARP Operation Deep Freeze 1986. Bransfield Strait, Gerlache Strait, Marguerite Bay. Sedimentology Research Laboratory Contribution 55. 1992b; Tallahassee, FL: Antarctic Marine Geology Research Facility.
- Cassidy D.S. USCGC Glacier: operations Deep Freeze 1982 and 1983 Sediment Descriptions. Sedimentology Research Laboratory Contribution 52. 1984; Tallahassee, FL: Antarctic Marine Geology Research Facility.
- Cook A.J., Fox A.J., Vaughan D.G., Ferrigno J.G. Retreating glacier fronts on the Antarctic Peninsula over the past half-century. Science. 2005; 308: 541–544.
- Cook A.J., Vaughan D.G., Luckman A.J., Murray T. A new Antarctic Peninsula glacier basin inventory and observed area changes since the 1940s. Antarctic Science. 2014; 26: 614–624.
- Cowan E.A., Christoffersen P., Powell R.D., Talarico F.M. Dynamics of the late Plio-Pleistocene West Antarctic Ice Sheet documented in subglacial diamictites, AND-1B core. Global and Planetary Change. 2014; 119: 56–70.
- Domack E.W., Burnett A., Leventer A. Domack E. Environmental setting of the Antarctic Peninsula. Antarctic Peninsula climate variability. 2003; Washington, DC: American Geophysical Union. 1–13.
- Domack E.W., Ishman S. Oceanographic and physiographic controls on modern sedimentation within Antarctic fjords. Geological Society of America Bulletin. 1993; 105: 1175–1189.
- Domack E.W., Jacobson E.A., Shipp S., Anderson J.B. Late Pleistocene–Holocene retreat of the West Antarctic Ice-Sheet system in the Ross Sea: part 2—sedimentologic and stratigraphic signature. Geological Society of America Bulletin. 1999; 111: 1517–1536.
- Domack E.W., McClennen C.E. Ross R.M. Accumulation of glacial marine sediments in fjords of the Antarctic Peninsula and their use as late Holocene paleoenvironmental indicators. Foundations for ecological research west of the Antarctic Peninsula. 1996; Washington, DC: American Geophysical Union. 135–154.
- Elverhoi A. Glacigenic and associated marine sediments in the Weddell Sea, fjords of Spitsbergen, and the Barents Sea: a review. Marine Geology. 1984; 57: 53–88.
- Elverhoi A., Lonne O., Seland R. Glaciomarine sedimentation in a modern fjord environment, Spitsbergen. Polar Research. 1983; 1: 127–149.
- Fernandez R., Anderson J., Bertrand S., Wellner J. Gualas Glacier sedimentary record of climate and environmental change, Golfo Elefantes, western Patagonia (46.5°S). The Holocene. 2011; 22: 451–463.
- Fernandez R.A., Anderson J.B., Wellner J.S., Hallet B. Timescale dependence of glacial erosion rates: a case study of Marinelli Glacier, Cordillera Darwin, southern Patagonia. Journal of Geophysical Research—Earth Surface. 2011; 116: 01020.
- Folk R.L., Ward W.C. Brazos River bar: a study in the significance of grain-size parameters. Journal of Sedimentary Petrology. 1957; 27: 3–26.
- Gilbert R. Sedimentary processes of Canadian Arctic fjords. Sedimentary Geology. 1983; 36: 147–175.
- Gilbert R., Nielsen N., Moller H., Desloges J.R., Rasch M. Glaciomarine sedimentation in Kangerdluk (Disko Fjord), west Greenland, in response to a surging glacier. Marine Geology. 2002; 191: 1–18.
- Gille S.T. Warming of the Southern Ocean since the 1950s. Science. 2002; 295: 1275–1277.
- Griffith T.W., Anderson J.B. Climatic control of sedimentation in bays and fjords of the northern Antarctic Peninsula. Marine Geology. 1989; 85: 181–204.
- Hall A., Visbeck M. Synchronous variability in the Southern Hemisphere atmosphere, sea ice, and ocean resulting from the annular mode. Journal of Climate. 2002; 15: 3043–3057.
- Harden S.L., DeMaster D.J., Nittrouer C.A. Developing sediment geochronologies for high-latitude continental shelf deposits: a radiochemical approach. Marine Geology. 1992; 103: 69–97.
- Hellmer H.H., Kauker F., Timmermann R., Determann J., Rae J. Twenty-first-century warming of a large Antarctic ice-shelf cavity by a redirected coastal current. Nature. 2012; 485: 225–228.
- Heroy D.C., Sjunneskog C., Anderson J.B. Holocene climate change in the Bransfield Basin, Antarctic Peninsula: evidence from sediment and diatom analysis. Antarctic Science. 2008; 20: 69–87.
- Hillenbrand C.D., Ehrmann W. Late Neogene to Quaternary environmental changes in the Antarctic Peninsula region: evidence from drift sediments. Global and Planetary Change. 2005; 45: 165–191.
- Hovan S.A., Janecek T.R. Descriptions of sediment recovered by the R/V Polar Duke. Cruise III United States Antarctic Program 1988. Sedimentology Research Laboratory Contribution 59. 1994a; Tallahassee, FL: Antarctic Marine Geology Research Facility.
- Hovan S.A., Janecek T.R. Descriptions of sediment recovered by the R/V Polar Duke. Cruises II and VII United States Antarctic Program 1990. Sedimentology Research Laboratory Contribution 51. 1994b; Tallahassee, FL: Antarctic Marine Geology Research Facility.
- Ishman S.E., Domack E.W. Oceanographic controls on benthic foraminifers from the Bellingshausen margin of the Antarctic Peninsula. Marine Micropaleontology. 1994; 24: 119–155.
- Isla E., Masque P., Palanques A., Guillen J., Puig P., Sanchez-Cabeza J.A. Sedimentation of biogenic constituents during the last century in western Bransfield and Gerlache Straits, Antarctica: a relation to currents, primary production, and sea floor relief. Marine Geology. 2004; 209: 265–277.
- Isla E., Masque P., Palanques A., Sanchez-Cabeza J.A., Bruach J.M., Guillen J., Puig P. Sediment accumulation rates and carbon burial in the bottom sediment in a high-productivity area: Gerlache Strait (Antarctica). Deep-Sea Research Part II. 2002; 49: 3275–3287.
- Jennings A.E., Weiner N.J. Environmental change in eastern Greenland during the last 1300 years: evidence from foraminifera and lithofacies in Nansen Fjord, 68°N. The Holocene. 1996; 6: 179–191.
- Kennedy D.S., Anderson J.B. Glacial-marine sedimentation and Quaternary glacial history of Marguerite Bay, Antarctic Peninsula. Quaternary Research. 1989; 31: 255–276.
- King J.C., Turner J., Marshall G.T., Connelley W.M., Lachlan-Cope T.A. Domack E. Antarctic Peninsula climate variability and its causes as revealed by analysis of instrumental records. Antarctic Peninsula climate variability. 2003; Washington, DC: American Geophysical Union. 17–30.
- Leventer A., Domack E.W., Ishman S.E., Brachfeld S., McClennen C.E., Manley P. Productivity cycles of 200–300 years in the Antarctic Peninsula region: understanding linkages among the sun, atmosphere, oceans, sea ice, and biota. Geological Society of America Bulletin. 1996; 108: 1626–1644.
- Lubin D., Wittenmyer R.A., Bromwich D.H., Marshall G.J. Antarctic Peninsula mesoscale cyclone variability and climatic impacts influences by the SAM. Geophysical Research Letters. 2008; 35: 02808.
- Majewski W., Wellner J.S., Szczucinski W., Anderson J.B. Holocene oceanographic and glacial changes recorded in Maxwell Bay, West Antarctica. Marine Geology. 2012; 326–328: 67–79.
- Martinson D.G., Stammerjohn S.E., Iannuzzi R.A., Smith R.C., Vernet M. Western Antarctic Peninsula physical oceanography and spatio-temporal variability. Deep-Sea Research Part II. 2008; 55: 1964–1987.
- Meredith M.P., King J.C. Rapid climate change in the ocean west of the Antarctic Peninsula during the second half of the 20th century. Geophysical Research Letters. 2005; 32: 19604.
- Michalchuk B.R., Anderson J.B., Wellner J.S., Manley P.L., Majewski W., Bohaty S. Holocene climate and glacial history of the northern Antarctic Peninsula: the marine sedimentary record from a long SHALDRIL core. Quaternary Science Reviews. 2009; 28: 3049–3065.
- Milliken K.T., Anderson J.B., Wellner J.S., Bohaty S.M., Manley P.L. High-resolution Holocene climate record from Maxwell Bay, South Shetland Islands, Antarctica. Geological Society of America Bulletin. 2009; 121: 1711–1725.
- Molnia B.F. Molnia B.F. Subarctic glaciomarine sedimentation: a model. Glacial–marine sedimentation. 1983; New York: Plenum Press. 95–144.
- Naish T., Powell R., Levy R., Wilson G., Scherer R., Talarico F., Krissek L., Niessen F., Pompilio M., Wilson T., Carter L., DeConto R., Huybers P., McKay R., Pollard D., Ross J., Winter D., Barrett P., Browne G., Cody R., Cowan E., Crampton J., Dunbar G., Dunbar N., Florindo F., Gebhardt C., Graham I., Hannah M., Hansaraj D., Harwood D., Helling D., Henrys S., Hinnov L., Kuhn G., Kyle P., Läufer A., Maffioli P., Magens D., Mandernack K., McIntosh W., Millan C., Morin R., Ohneiser C., Paulsen T., Persico D., Raine I., Reed J., Riesselman C., Sagnotti L., Schmitt D., Sjunneskog C., Strong P., Taviani M., Vogel S., Wilch T., Williams T. Obliquity-paced Pliocene West Antarctic ice sheet oscillations. Nature. 2009; 458: 322–328.
- Ó Cofaigh C., Dowdeswell J.A. Laminated sediments in glacimarine environments: diagnostic criteria for their interpretations. Quaternary Science Reviews. 2001; 20: 1411–1436.
- Powell R.D. A model for sedimentation by tidewater glaciers. Annals of Glaciology. 1981; 2: 120–134.
- Powell R.D. Glacimarine processes and inductive lithofacies modeling of ice shelf and tidewater glacier sediments based on Quaternaty examples. Marine Geology. 1984; 57: 1–52.
- Powell R.D., Domack E.W. Menzies J. Modern glaciomarine environments. Modern glacial environments: processes, dynamics, and sediments. 1995; Boston, MA: Butterworth-Heinmann. 445–486.
- Powell R.D., Molnia B.F. Glaciomarine sedimentary processes, facies, and morphology of the southeast Alaska Shelf and fjords. Marine Geology. 1989; 85: 359–390.
- Pritchard H.D., Ligtenberg S.R.M., Fricker H.A., Vaugham D.G., van den Broeke M.R., Padman L. Antarctic ice-sheet loss driven by basal melting of ice shelves. Nature. 2012; 484: 502–505.
- Rignot E., Bamber J.L., Van den Broeke M.R., Davis C., Li Y., Van de Berg W.J., Van Meijgaard E. Recent Antarctic ice mass loss from radar interferometry and regional climate modeling. Nature Geoscience. 2008; 1: 106–110.
- Skei J. Why sedimentologists are interested in fjords. Sedimentary Geology. 1983; 36: 75–80.
- Smith D.A., Hofmann E.E., Klinck J.M., Lascara C.M. Hydrography and circulation of the west Antarctic Peninsula continental shelf. Deep-Sea Research Part I. 1999; 46: 925–949.
- Smith D.A., Klinck J.M. Water properties on the west Antarctic Peninsula continental shelf: a model study of effects of surface fluxes and sea ice. Deep-Sea Research Part II. 2002; 49: 4863–4886.
- Smith J.N., Schafer C.T. A 20th-century record of climatologically modulated sediment accumulation rates in a Canadian fjord. Quaternary Research. 1987; 27: 232–247.
- Stammerjohn S., Massom R., Rind D., Martinson D. Regions of rapid sea ice change: an inter-hemispheric seasonal comparison. Geophysical Research Letters. 2012; 39: 06501.
- Stammerjohn S.E., Martinson D.G., Smith R.C., Iannuzzi R.A. Sea ice in the western Antarctic Peninsula region: spatio-temporal variability from ecological and climate change perspectives. Deep-Sea Research Part II. 2008; 55: 2041–2058.
- Stokes C.R., Tarasov L., Blomdin R., Cronin T.M., Fisher T.G., Gyllencreutz R., Hattestrand C., Heyman J., Hindmarsh R.C.A., Hughes A.L.C., Jakobsson M., Kirchner N., Livingstone S.J., Margold M., Murton J.B., Noormets R., Peltier W.R., Peteet D.M., Piper D.J.W., Preusser F., Renssen H., Roberts D.H., Roche D.M., Saint-Ange F., Stroeven A.P., Teller J.T. On the reconstruction of palaeo-ice sheets: recent advances and future challenges. Quaternary Science Reviews. 2015; 125: 15–49.
- Syvitski J.P.M. On the deposition of sediment within glacier-influenced fjords: oceanographic controls. Marine Geology. 1989; 85: 301–329.
- Syvitski J.P.M. Towards an understanding of sediment deposition on glaciated continental shelves. Continental Shelf Research. 1991; 11: 897–937.
- Syvitski J.P.M., Murray J.W. Particle interaction in fjord suspended sediment. Marine Geology. 1981; 39: 215–242.
- Thomas E.R., Marshall G.J., McConnell J.R. A doubling in snow accumulation in the western Antarctic Peninsula since 1850. Geophysical Research Letters. 2008; 35: 01706.
- Turner J., Barrand N.E., Bracegirdle T.J., Convey P., Hodgson D.A., Jarvis M., Jenkins A., Marshall G., Meredith M.P., Roscoe H., Shanklin J., French J., Goosse H., Guglielmin M., Gutt J., Jacobs S., Kennicutt M.C. II, Masson-Delmotte V., Mayewski P., Navarro F., Robinson S., Scambos T., Sparrow M., Summerhayes C., Speer K., Klepikov A. Antarctic climate change and the environment: an update. Polar Record. 2013; 50: 237–259.
- Turner J., Lachlan-Cope T., Colwell S., Marshall G.J. A positive trend in western Antarctic Peninsula precipitation over the last 50 years reflecting regional and Antarctic-wide atmospheric circulation changes. Annals of Glaciology. 2005; 41: 85–91.
- Vaughan D.G., Marshall G.J., Connolley W.M., Parkinson C., Mulvaney R., Hodgson D.A., King J.C., Pudsey C.J., Turner J. Recent rapid regional climate warming on the Antarctic Peninsula. Climatic Change. 2003; 60: 243–274.
- Warner N.R., Domack E.W. Millennial- to decadal-scale paleoenvironmental change during the Holocene in the Palmer Deep, Antarctica, as recorded by particle size analysis. Paleoceanography 17. 2002. article no. 8004, doi: 10.1029/2000PA000602.
- Wellner J.S., Lowe A.L., Shipp S.S., Anderson J.B. Distribution of glacial geomorphic features on the Antarctic continental shelf and correlation with substrate; implications for ice behavior. Journal of Glaciology. 2001; 47: 397–411.
- Wolfl A.C., Lim C.H., Hass C., Lindhorst S., Tosonotto G., Lettman K.A., Kuhn G., Wolff J.O., Abele D. Distribution and characteristics of marine habitats in a subpolar bay based on hydroacoustics and bed shear stress estimates—Potter Cove, King George Island, Antarctica. Geo-Marine Letters. 2014; 34: 435–446.