
Abstract
At Dome Argus, East Antarctica, the surface mass balance (SMB) from 2008 to 2013 was evaluated using 49 stakes installed across a 30×30 km area. Spatial analysis showed that at least 12 and 20 stakes are needed to obtain reliable estimates of SMB at local scales (a few hundred square metres) and regional scales (tens of square kilometres), respectively. The estimated annual mean SMB was 22.9±5.9 kg m−2 yr−1, including a net loss by sublimation of −2.22±0.02 kg m−2 yr−1 and a mass gain by deposition of 1.37±0.01 kg m−2 yr−1. Therefore, ca. 14.3% of precipitation was modified after deposition, which should be considered when interpreting snow or ice core records produced by future drilling projects. The surface snow density and SMB in the western portion of Dome Argus are higher than in other areas, and these differences are likely related to the katabatic wind, which is strengthened by topography in this sector. A new digital elevation model (DEM) of Dome Argus was generated, confirming that both peaks of the dome can be considered as the summit of the East Antarctic Ice Sheet. Findings from this study should be valuable for validating SMB estimates obtained from regional climate models and DEMs established using remote-sensing data.
To access the supplementary material for this article, please see the supplementary file under Article Tools, online.
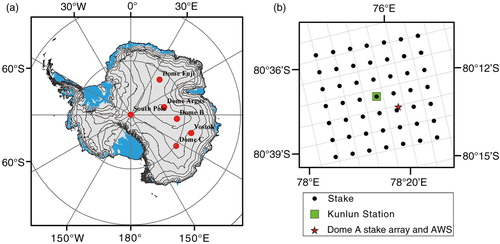
As the highest region of the EAIS, Dome Argus is one of the most important candidate sites from which to acquire the oldest East Antarctic ice core (). Previous studies have shown that on-going deep ice core drilling may provide a unique paleoclimate record extending to 1.2 Mya (e.g., Xiao et al. Citation2008). In preparation for the project, the surface topography was investigated, and an AWS was deployed by the 21st CHINARE in the austral summer of 2004/05 (Zhang et al. Citation2007; Cheng et al. Citation2009; Ma et al. Citation2010). Ice sheet thickness and bed topography were surveyed with ground-based ice-penetrating radar by the 24th CHINARE in 2007/08 (Bo et al. Citation2009). These efforts contributed important information to the selection of the best site for ice core drilling and for the construction of Kunlun Station, which is located between the two highest points of Dome Argus (a).
Fig. 1 (a) Location of Dome Argus, East Antarctica. The locations of Dome Fuji, Dome B, Vostok, Dome C and South Pole are also shown. (b) Sketch map of sites for GPS and stake measurements. The base map was generated using QGIS 2.6 (http://www.qgis.com/). Contour line intervals are 500 m.
SMB, snow accumulation rate and surface ice velocity are key parameters for glaciological and meteorological studies. To estimate the SMB, snow pit and stake array measurements were collected on the northern peak of the Dome Argus area. The β activity horizon in the snow pit revealed an SMB value of 23 kg m−2 yr−1 during the period 1966–2005 (Hou et al. Citation2007). During the period 2005–08, stake array measurements indicated an SMB of 19 kg m−2 yr−1 (Ding et al. Citation2011). During the austral summer of 2004/05, a 109.91 m ice core was drilled to study the preliminary climatic information of Dome A; however, the dating results differed greatly between two research groups. One team suggested a 2840-year history for the top 104.42 m, whereas the other group suggested a 4115±150-year history for the entire core (Jiang et al. Citation2012; Li et al. Citation2012). Additionally, many studies have shown that single site measurements may have low local representativeness (e.g., Frezzotti et al. Citation2007; Kameda et al. Citation2008).
Better knowledge of the SMB distribution over Dome Argus is needed to support future glaciological studies in this region. In this study, we present a new DEM of Dome Argus, as well as new estimates of SMB and surface sublimation rates for the period of January 2008 to January 2013.
Field observations
In January 2008, during the 24th CHINARE, 49 bamboo poles were installed to measure the SMB across a 30×30 km square area (b). The distance between the stakes was ca. 5 km. In January 2011, the 27th CHINARE re-measured the heights of these stakes and examined the snow layers at sites with damaged stakes. In January 2013, a second re-measurement campaign was conducted. Hence, snow height change observations have been collected for two periods: 2008–2011 and 2011–13.
The surface density to a depth of 0.20 m was calculated using a tube sampler. To reduce local spatial noise, at least two measurements at each site were collected with an interval of about 4 m. If the difference between the two measurements exceeded 5%, another sample, located so as to form an equilateral triangle with the first two measurement sites, was collected. Because of the low snowfall rate and weak winds around Dome Argus, the densification process is negligible on a time scale of five years (Ding et al. Citation2015). Therefore, the use of the surface density to translate snow height changes into SMB does not reduce the reliability of the results. The calculated SMB uncertainty should be within 2% if visual error of stake height measurement is also considered.
GPS coordinates of the SMB measurement sites were also recorded and used to construct a DEM and a surface velocity map for Dome Argus. The GPS data were gathered using RTK and differential GPS analysis. In January 2013, two Leica AS10 GPS receivers were used to produce the DEM of Dome Argus. One GPS receiver was used as a reference station at Kunlun Station and made continuous measurements from 8 to 14 January 2013 at 5 s intervals. The other receiver was used as a roving station to collect data near the stakes. For the roving station, the GPS receiver operated in RTK mode and collected data for two minutes under good communication conditions. Otherwise, at least 25 min were required to collect data in differential GPS mode. The collected data were post-processed, and the horizontal and vertical errors were estimated to be 1.2 and 3.9 cm, respectively. The DEM uncertainty is estimated to be <0.03 m and <0.10 m in the horizontal and vertical respectively.
The Dome Argus stake array, which included a 5×5 matrix over a 100×100 m area, was also measured to record snow accumulation during the fieldwork (). These observations were used to determine the SMB and assess the reliability of local-scale single-stake measurements. Here, DA designates the smaller scale of the two arrays (100×100 m), that is the Dome Argus stake array, whereas DZ represents the larger scale array (30×30 km), comprising 49 stakes installed across a wider area around Dome Argus.
The AWS was installed in January 2005 to monitor the meteorology of Dome Argus, as part of a cooperative effort between China and Australia. The type of AWS installed at Dome Argus has been used in many areas of Antarctica, and many studies have analysed data collected by these stations (e.g., Allison Citation1998; Ma et al. Citation2010). Sensor specifications have been described by Ma et al. (Citation2010).
Results and discussion
Representativeness of stake measurements
SMB derived from stake measurements is highly variable in Antarctica (e.g., Ren et al. Citation1999; Ekaykin et al. Citation2002; Wen et al. Citation2006). Measurements from multiple stakes must be averaged to obtain an estimate of the mean local or regional SMB. Several studies have reported different averaging intervals to obtain the mean value. For example Furukawa et al. (Citation1996), used a 10-stake running average along the Syova–Dome Fuji traverse, Higham & Craven (Citation1997) calculated SMB values using 15-stake averaging, Ren et al. (Citation1999) used 21-stake averaging, Qin et al. (Citation2000) computed SMB values using seven-stake averaging and Wen et al. (Citation2006) suggested that a 15-stake average is suitable for local-scale studies. Considering the different spatial scales explored in these studies, different stake numbers were examined to determine the optimal number that minimizes spatial noise at local and regional scales.
To determine this optimal number, the Monte Carlo method (Metropolis & Ulam Citation1949) was used to generate different combinations of stake numbers. Then, the CV, also known as relative standard deviation, of each combination was calculated using the following equation:1
n=25 for DA or n=49 for DZ; 2≤r≤n−1; j=1, …, r; and i=1, …, .
Here, σ represents the CV, and {A
j
}, in which j=1,..., r, is a combination when r is the number of degrees of freedom and . The mean CV is then calculated using this equation:
2
To illustrate the relative error on the estimated degree of spatial coherence, we also calculated the CV of σi,r for every stake combination; this equation is as follows:3
shows variations in σ and δ as a function of the number of stakes for estimates of the SHC, SMB and density at the DA and DZ arrays. Multiyear observations clearly increased the reliability of the results. For example, a shows that the value of σ for the DA array decreased from ca. 81% to ca. 19% when the observation period increased from two years (2011–13) to five years (2008–2013). This result agrees with previous ice core studies, many of which noted that at least three years of mean accumulation data are needed to detect local-scale spatial variations (e.g., Goodwin Citation1990; Magand et al. Citation2007).
Fig. 2 The coefficient of variation (σ) of SMB, SHC and density when the stake quantity is increased at (a) the DA and (b) DZ array; and the coefficient of variation (δ) of σ of (c) DA and (d) DZ. The shaded area indicates recommended minimal number of stakes needed to obtain reliable estimates of SMB at for (a, c) local and (b, d) regional spatial scales.
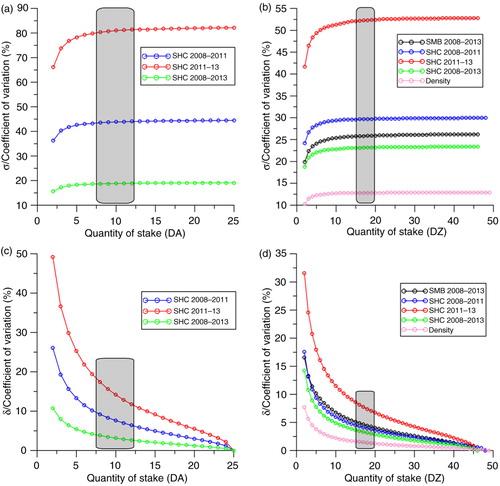
The results also show that when the number of stakes increases, σ increases and δ decreases (). However, as shown by the shaded region in , σ did not exhibit a significant change when the number of stakes increased from 8 to 12 (DA) or from 15 to 20 (DZ). The slopes of σ and δ also exhibited very little change for stake numbers exceeding 12 (DA, c) and 20 (DZ, d). These results confirm that all errors induced by random measurements have been considered in previous studies. In summary, at the scale of a few hundred square metres, 12 stakes is the minimum number required to obtain reliable estimates of SMB, and adding more stakes has relatively little impact on the reliability of results. At a scale of a few tens of square kilometres, 20 stakes is the minimum number. The data used in this paper fulfil these requirements, making the observed snow accumulation rate and calculated SMB highly reliable.
Surface topography of Dome Argus
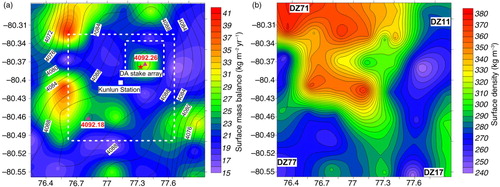
Surfer version 11.0 software was used to generate surface elevation, SMB and snow density maps for Dome Argus (). The “kriging” technique was used for interpolation. Smoothed elevation contours were plotted at 2 m intervals. The saddle-shaped region of Dome Argus is very flat, especially in the large white dashed square in . The maximum topographic height difference within the 900 km2 area is <16.50 m, and most of the region has an elevation exceeding 4080 m. In two previous topographic studies of Dome Argus using DEMs, different results were attained for the summit of the EAIS. One study determined that the northern peak is the highest (Zhang et al. Citation2007), whereas the other study suggested that the southern peak is ca. 0.3 m higher (Cheng et al. Citation2009). However, we found that the two peaks have similar elevations. As shown in a, the northern peak is ca. 0.08 m higher, although we do not suggest which peak is the actual summit of EAIS because short-term snow accumulation changes can modify the difference between the peaks, and the vertical uncertainty of the DEM is approximately 0.10 m.
Fig. 3 (a) Map of the mean (2008–2013) SMB across Dome Argus interpolated from stake observations. Black contours are surface elevations (WGS84 ellipsoid) with intervals of 2 m based on GPS data from 27th CHINARE. The small and large white dashed squares cover the 64 km2 and 400 km2 areas surveyed by Zhang et al. (Citation2007) and Cheng et al. (Citation2009), respectively. The solid white square represents Kunlun Station, the red star represents DA stake array and the red triangles represent the two summits of Dome Argus. (b) Map of surface density interpolated from observations.
According to ground-based ice-penetrating radar measurements (Bo et al. Citation2009), there are two mountain peaks below the surface at Dome Argus, which may explain the ice sheet surface peaks. Kunlun Station is located above a subglacial lake between the mountain peaks. This station was chosen for deep ice core drilling because the ice velocity there is very low (3–6 cm yr−1) and the ice is thick (>2800 m).
SMB of Dome Argus
The SMB at each stake in the DZ array varied spatially from 14.83 to 40.68 kg m2 yr−1, with a CV of 26.0% for the period 2008–2013 (Supplementary Table S1). Conceivably, an annual layer may disappear in locations with extremely low accumulation rates (e.g., Kameda et al. Citation2008). However, no negative values were observed for the DZ and DA arrays using our multiyear measurements, although one-year measurements show occasional negative values in the DA array (Ding et al. Citation2011).
Spatial variability in SMB values is primarily associated with precipitation, surface topography and wind-driven processes (e.g., Frezzotti et al. Citation2007). Compared with local effects, such as sastrugi and redistribution by wind drift, precipitation is assumed to be homogeneous at a scale of <100 km. From the meteorological records measured by the AWS (), the wind speed was usually <3 m s−1 with no prevailing wind direction during the study period, least near the AWS (note that winter data were discontinuous, and we therefore determined wind directions in that season using five-year composites).
Although the topography is very flat in the study region and the SMB variations were found to be relatively small, the snow density map shows pronounced spatial differences. The surface density in the western portion of the study area (DZ71 in b) is much higher than in other regions. We also investigated the surface morphology over Dome Argus and found that sastrugi with heights of 5–20 cm occur frequently around DZ71 (Supplementary Fig. S1). Based on an analysis of the near-surface wind field using NCEP data, we found that the prevailing wind here is from the east–south-east to the south, which is corroborated by the direction/shape of the sastrugi. Combined with the acceleration induced by topography, the wind speed around DZ71 could exceed 3 m s−1, which would induce a stronger firnification process and lead to hardening of the snow surface. At DZ11, DZ77 and DZ17, the snow is very soft and has a flat surface with active crystallization (Supplementary Fig. S1), indicating that the air temperature around Dome Argus can be below the surface snow temperature. Under the influence of an inversion layer above Dome Argus (Ma et al. Citation2010), the vapour pressure close to the surface can reach or even exceed saturation, resulting in frost build-up at the snow surface.
The estimated mean SMB value over Dome Argus was 22.9±5.9 kg m2 yr−1 during the period 2008–2013. Compared with the surface snow density, the SMB in the western area was only slightly greater than in other parts across the study region (see a). Altogether, no large regional variations in the net SMB were observed. Our new estimated mean SMB is comparable to the estimated mean net snow accumulation rates for the northern peak of Dome Argus based on the β radioactivity peak for the period 1965–2005 (Hou et al. Citation2007) and at Kunlun Station for the period 1966–2009 (Wang et al. Citation2013). However, our result is 3.9 kg m2 yr−1 higher than the previous results for the DA stake array (Ding et al. Citation2011). Generally, AWS records are considered very accurate because the ultrasonic sounder is sensitive to SHCs. However, the results presented by Ma et al. (Citation2010) are overestimated: the 24th CHINARE found that a snow dune had formed just below the sensor in January 2008 (Supplementary Fig. S2).
In Antarctica, the SMB is determined by precipitation, surface sublimation erosion/deposition due to divergence/convergence of snow drift transport, wind-driven sublimation and meltwater runoff. Indeed, most of the inconsistency of P - E in re-analysis data sets such as the ECMWF's ERA-40, the NCEP re-analysis data and observed SMB can be attributed to wind-driven processes in the coastal and katabatic wind regions (Scambos et al. Citation2012; Das et al. Citation2013). However, because of the weak wind (<3 m s−1) over Dome Argus, wind-driven processes represent a small contribution to the SMB, as was previously inferred by a regional atmospheric climate model (RACMO2.3) that included drifting snow processes (Van Wessem et al. Citation2014).
We compared our SMB with P - E estimates in climate re-analysis data sets, including the ECMWF's ERA-40 and ERA-interim re-analysis, JRA-55 and MERRA (). The ERA-40, ERA-interim and MERRA data sets underestimate the observed SMB by ca. 50%, whereas the JRA-55 P - E closely resembles the observed values. The dry bias in most re-analysis products may largely result from the fact that contributions of clear-sky precipitation to the SMB are not included in these re-analyses. The consistency between the JRA-55 data set and the field observations may be attributed to a better representation of observed precipitation in the JRA-55 data set (Ebita et al. Citation2011).
Table 1 Compilation of SMB (kg m2 yr−1) estimates for Dome Argus.
Sublimation of Dome Argus
The LE over Dome Argus was calculated using the following analytical expression from the bulk-aerodynamic method (Oke Citation1987):4
where ρ=(ρ
0
P)/P
0 is the air density at the Dome Argus AWS, ρ
0 and P
0 are the air density (1.29 kg m−3) and pressure (1013 hPa) at standard sea level, respectively, and P is the measured surface air pressure at the AWS (hPa). L
s is the latent heat of sublimation for snow (2.834 mJ kg-1). C
E
is the bulk transfer coefficient for humidity, which has been suggested to be 0.00129 when the atmosphere is stable and 0.002 when the atmosphere is unstable (Ma Citation2009). u and q are the mean wind speed and specific humidity at the height of 4 m, respectively; and q
S
is the surface specific humidity, which is calculated using the glacial surface saturation vapour pressure (e
s) (Bolton Citation1980). The parameters q
s and e
s are calculated as follows:5
6
At half-hourly steps, sublimation M s (mm w.e.) is calculated from the LE, that is, M s=LE/L s. Because the AWS wind measurements were not consistent during wintertime, all records during the period 2005–2010 were averaged to obtain mean meteorological parameters from 1 January to 31 December. Finally, a data set was constructed having 97% of the daily wind speed records.
Despite the surface air being constantly saturated at Dome Argus (Ma et al. Citation2010), the conditions are unfavourable for snow sublimation. The extremely low temperature limits the specific humidity of the air. Moreover, the snow surface is usually colder (63.5% of the time) than the air, reducing the vertical humidity gradient. Nonetheless, because all of the surface energy balance fluxes are very small over the Antarctic plateau (Van den Broeke et al. Citation2006), the LE remains important for heat loss on a daily basis. This hypothesis can be validated using the bulk-aerodynamic method. At Dome Argus, even during summertime, the LE remains below 3 W m−2 due to the low temperatures and weak winds.
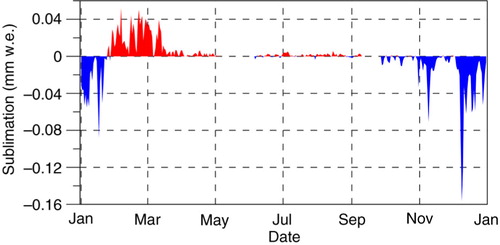
Based on the Monin–Obukhov similarity theory, we simulated the five-year averages of daily mean sublimation at Dome Argus. The results are shown in . The total sublimation was determined to be −2.22±0.02 mm w.e. yr−1, which primarily occurred between November and January. Deposition occurred primarily between February and October, accounting for +1.37±0.01 mm w.e. yr−1, which is much less than the values of other plateau stations, such as Dome Fuji (+5.5 mm w.e. yr−1; Kameda et al. Citation1997). This difference can be partially attributed to the fact that Dome Argus is farther from the coast and has a higher elevation than Dome Fuji, which leads to less moisture transport from the Ocean. During the polar night, sublimation and deposition can be negligible because of the low air temperature (approximately −59.7°C during April and September) and low specific humidity (approximately 0.013 g kg−1 during April and September). In summary, the net loss by sublimation at the surface reaches −0.85±0.02 mm w.e. yr−1 (kg m−2 yr−1). This result indicates that the total mass input at Dome Argus is 25.1±5.9 kg m−2 yr−1 and that the net surface mass exchange (by sublimation/deposition) is equal to, on average, 14.3% of the total mass input (or 15.7% of the estimated mean net SMB), which is very important for snow compositional changes through post-depositional processes, and for the interpretation of ice core climatic archives.
Fig. 4 Five-year (2005–2010) averages of estimated daily mean sublimation (blue) and deposition (negative sublimation, red) at Dome Argus.
Conclusions
Using data from a 49-stake network over a 30×30 km area from 2008 to 2013 and high precision GPS measurements, we calculated the annual mean SMB of Dome Argus, Antarctica, to be 22.9±5.9 kg m2 yr−1, which agrees well with the previous estimation based on β radioactivity (Hou et al. Citation2007; Wang et al. Citation2013) and JRA-55 re-analysis data, but not with ERA-40, AWS, ERA-interim and MERRA. This indicates that studies evaluating Antarctic SMB should be carried out with caution.
Our simulation showed that sublimation and deposition processes have huge influence on the SMB of the Dome area. This has been confirmed at Dome C (3 mm w.e. yr−1;Frezzotti et al. Citation2004), Dome Fuji (1.6 mm w.e. yr−1, Kameda et al. Citation1997) and Vostok (2–4.4 mm w.e. yr−1, Ekaykin et al. Citation2004), although the net mass loss presented here may be the lowest (−0.85±0.02 mm w.e. yr−1) on the EAIS because of the extremely low air temperature and the highest elevation.
Compared with the other deep ice core sites, Dome Argus has the lowest SMB and ice velocity. The new surface map generated by our study, along with the bed topography and thermal conditions studied previously, suggests that Dome Argus could be an optimal location for drilling the oldest ice core. However, some sites between Dome Fuji and Dome A, have even lower SMB values, for example site NUS07-6, with a value of 16.0±0.4 kg m2 yr−1 (Anschütz et al. Citation2011), which could make them other good candidates for deep ice core drilling if their surface ice velocities and ice thicknesses meet the necessary criteria.
Supplementary Material
Download PDF (301.5 KB)Acknowledgements
This study is funded by National Key Basic Research Program of China (2013CBA01804), the National Science Foundation of China (41425003; 41576182; 41206179) and the State Oceanic Administration (CHINARE2016).
Notes
To access the supplementary material for this article, please see the supplementary file under Article Tools, online.
Related Research Data
References
- Allison I. Surface climate of the interior of the Lambert Glacier basin, Antarctica, from automatic weather station data. Annals of Glaciology. 1998; 27: 515–520.
- Anschütz H., Sinisalo A., Isaksson E., McConnell J.R., Hamran S.-E., Bisiaux M.M., Pasteris D., Neumann T.A., Winther J.-G. Variation of accumulation rates over the last eight centuries on the East Antarctic Plateau derived from volcanic signals in ice cores. Journal of Geophysical Research—Atmospheres. 2011; 116: D20103, doi: http://dx.doi.org/10.1029/2011JD015753.
- Bo S., Siegert M.J., Mudd S.M., Sugden D., Fujita S., Cui X.B., Jiang Y.Y., Tang X.Y., Li Y.S. The Gamburtsev mountains and the origin and early evolution of the Antarctic Ice Sheet. Nature. 2009; 459: 690–693.
- Bolton D. The computation of equivalent potential temperature. Monthly Weather Review. 1980; 108: 1046–1953.
- Cheng X., Gong P., Zhang Y., Sun Z., Wei F. Surface topography of Dome A, Antarctica, from differential GPS measurements. Journal of Glaciology. 2009; 55: 185–187.
- Das I., Bell R.E., Scambos T.A., Wolovick M., Creyts T.T., Studinger M., Frearson N., Nicolas J.P., Lenaerts J.T.M., van den Broeke M.R. Influence of persistent wind scour on the surface mass balance of Antarctica. Nature Geoscience. 2013; 6: 367–371.
- Ding M., Xiao C.D., Li C.J., Qin D.H., Jin B., Shi G.T., Xie A.H., Cui X.B. Surface mass balance and its climate significance from the coast to Dome A, East Antarctica. Science in China—Earth Sciences. 2015; 58: 1787–1797.
- Ding M.H., Xiao C.D., Li Y.S., Ren J.W., Hou S.G., Jin B., Sun B. Spatial variability of surface mass balance along a traverse route from Zhongshan station to Dome A, Antarctica. Journal of Glaciology. 2011; 57: 658–666.
- Ebita A., Kobayashi S., Ota Y., Moriya M., Kumabe R., Onogi K., Harada Y., Yasui S., Miyaoka K., Takahashi K., Kamahori H., Kobayashi C., Endo H., Soma M., Oikawa Y., Ishimizu T. The Japanese 55-year reanalysis “JRA-55”: an interim report. SOLA. 2011; 7: 149–152.
- Ekaykin A., Lipenkov V., Barkov N., Petit J., Masson-Delmotte V. Spatial and temporal variability in isotope composition of recent snow in the vicinity of Vostok station, Antarctica: implications for ice core record interpretation. Annals of Glaciology. 2002; 35: 181–186.
- Ekaykin A., Lipenkov V.Y., Kuzmina I.N., Petit J.R., Masson-Delmotte V., Johnsen S.J. The changes in isotope composition and accumulation of snow at Vostok station, East Antarctica, over the past 200 years. Annals of Glaciology. 2004; 39: 569–575.
- Frezzotti M., Pourchet M., Flora O., Gandolfi S., Gay M., Urbini S., Vincent C., Becagli S., Gragnani R., Proposito M., Severi M., Traversi R., Udisti R., Fily M. New estimations of precipitation and surface sublimation in East Antarctica from snow accumulation measurements. Climate Dynamics. 2004; 23: 803–813.
- Frezzotti M., Urbini S., Proposito M., Scarchilli C., Gandolfi S. Spatial and temporal variability of surface mass balance near Talos Dome, East Antarctica. Journal of Geophysical Research—Earth Surface. 2007; 112: F02032, doi: http://dx.doi.org/10.1029/2006JF000638.
- Furukawa T., Kamiyama K., Maeno H. Snow surface features along the traverse route from the coast to Dome Fuji station, Queen Maud Land, Antarctica. Proceedings of the NIPR Symposium on Polar Meteorology and Glaciology. 1996; 10: 13–24.
- Goodwin I. Snow accumulation and surface topography in the katabatic zone of Eastern Wilkes Land, Antarctica. Antarctic Science. 1990; 2: 235–242.
- Higham M., Craven M. Surface mass balance and snow surface properties from the Lambert Glacier basin traverses 1990–94. Antarctic CRC Research Report 9. 1997; Hobart: Antarctic Climate and Ecosystems Cooperative Research Centre.
- Hou S., Li Y., Xiao C., Ren J. Recent accumulation rate at Dome A, Antarctica. Chinese Science Bulletin. 2007; 52: 428–431.
- Jiang S., Cole-Dai J., Li Y.S., Ferris D.G., Ma H.M., An C.L., Shi G.T., Sun B. A detailed 2840 year record of explosive volcanism in a shallow ice core from Dome A, East Antarctica. Journal of Glaciology. 2012; 58: 65–75.
- Kameda T., Azuma N., Furukawa T., Ageta Y., Takahashi S. Surface mass balance, sublimation and snow temperatures at Dome Fuji Station, Antarctica, in 1995. Proceedings of the NIPR Symposium on Polar Meteorology and Glaciology. 1997; 11: 24–34.
- Kameda T., Motoyama H., Fujita S., Takahashi S. Temporal and spatial variability of surface mass balance at Dome Fuji, East Antarctica, by the stake method from 1995 to 2006. Journal of Glaciology. 2008; 54: 107–116.
- Li C., Xiao C.D., Hou S.G., Ren J.W., Ding M.H., Guo R. Dating a 109.9 m ice core from Dome A (East Antarctica) with volcanic records and a firn densification model. Science in China—Earth Sciences. 2012; 55: 1280–1288.
- Ma Y. Characteristic parameters of near surface layer of the traverse route from Zhongshan station to Dome-A, East Antarctica. PhD thesis, Chinese Academy of Meteorological Sciences, Beijing. 2009
- Ma Y., Bian L., Xiao C., Allison I., Zhou X. Near surface climate of the traverse route from Zhongshan Station to Dome A, East Antarctica. Antarctic Science. 2010; 22: 443–459.
- Magand O., Genthon C., Fily M., Krinner G., Picard C., Frezzotti M., Ekaykin A. An up-to-data quality-controlled surface mass balance data set for the 90-180 E Antarctica sector and 1950–2005 period. Journal of Geophysical Research—Atmospheres. 2007; 112: D12106, doi: http://dx.doi.org/10.1029/2006JD007691.
- Metropolis N., Ulam S. The Monte Carlo method. Journal of the American Statistical Association. 1949; 44: 335–341.
- Oke T.R. Boundary layer climates. 1987; New York: Routledge. 2nd edn.
- Qin D., Ren J.W., Kang J.C., Xiao C.D., Li Z.Q., Li Y.S., Sun B., Sun W.Z., Wang X.X. Primary results of glaciological studies along an 1100 km transect from Zhongshan station to Dome A, East Antarctic ice sheet. Annals of Glaciology. 2000; 31: 198–204.
- Ren J., Qin D., Allison I. Variations of snow accumulation and temperature over past decades in the Lambert Glacier basin, Antarctica. Annals of Glaciology. 1999; 29: 29–32.
- Scambos T., Frezzotti M., Haran T., Bohlander J., Lenaerts J.T.M., van den Broeke M.R., Jezek K., Long D., Urbini S., Farness K., Neumann T., Albert M., Winther J.-G. Extent of low-accumulation ‘wind glaze’ areas on the East Antarctic plateau: implications for continental ice mass balance. Journals of Glaciology. 2012; 58: 633–647.
- van den Broeke M., Reijmer C., van As D., Boot W. Daily cycle of the surface energy balance in Antarctica and the influence of clouds. International Journal of Climatology. 2006; 26: 1587–1605.
- van Wessem J., Reijmer C.H., Morlighem M., Mouginot J., Rignot E., Medley B., Joughin I., Wouters B., Depoorter M.A., Bamber J.L., Lenaerts J.T.M., van den Berg W.J., van den Broeke M.R., van Meijgaard E. Improved representation of East Antarctic surface mass balance in a regional atmospheric climate model. Journal of Glaciology. 2014; 60: 761–770.
- Wang Y., Sodemann H., Hour S.G., Masson-Delmotte V., Jouzel J., Pang H.X. Snow accumulation and its moisture origin over Dome Argus, Antarctica. Climate Dynamics. 2013; 40: 731–742.
- Wen J., Jezek K.C., Monaghan A.J., Sun B., Ren J., Huybrechts P. Accumulation variability and mass budgets of the Lambert Glacier–Amery Ice Shelf system, East Antarctica, at high elevations. Annals of Glaciology. 2006; 43: 351–360.
- Xiao C., Li Y., Allison I., Shugui H., Dreyfus G., Barnola J.-M., Jiawen R., Lingen B., Shenkai Z., Kameda T. Surface characteristics at Dome A, Antarctica: first measurements and a guide to future ice coring sites. Annals of Glaciology. 2008; 48: 82–87.
- Zhang S., Dongchen E., Wang Z., Zhou C., Shen Q. Surface topography around the summit of Dome A, Antarctica, from real-time kinematic GPS. Journal of Glaciology. 2007; 53: 159–160.