
Abstract
The Antarctic fur seal (Arctocephalus gazella) is a key marine predator in the Southern Ocean, a region that has recently started to show changes as a result of global climate change. Here, carbon (δ13C) and nitrogen (δ15N) stable isotope analyses on whole blood and plasma samples were used to examine the isotopic niche of lactating female Antarctic fur seals. Using recently developed Bayesian approaches to determine changes in isotopic niche, a significant increase in δ13C and δ15N was found between 1997 and 2015; this change occurred at an average rate of 0.067‰ (δ13C) and 0.072‰ (δ15N) per year over this period. This suggests that a marked isotopic niche shift has occurred over this period, which very likely corresponds to a shift in diet towards prey at a higher trophic level, such as fish (replacing krill). Although our sampling design prevented us from exploring a seasonal trend in a conclusive manner, our data suggest that concurrent increases in δ13C and δ15N might occur as the breeding season progresses. At a seasonal scale, an average decrease of −0.7‰ per month (95% confidence interval=[−0.9; −0.6]) in δ13C might have occurred, concurrently with an average increase of 1.1‰ per month in δ15N. The results of this study constitute the first isotopic assessment for female Antarctic fur seals from Bouvetøya and provide a baseline for the use of this predator species as a sentinel of the marine trophic system in one of the least studied areas within this species’ distributional range.
To access the supplementary material for this article, please see the supplementary file under Article Tools, online.
Physical and biological processes in the Southern Ocean are heavily influenced by climate (Barbraud et al. Citation2012; McBride et al. Citation2014). Recent changes in global climate have induced change that has resulted in shifts in trophic interactions in some regions (Trathan et al. Citation2012; Gutt et al. Citation2015). But the temporal and spatial heterogeneity of food webs in the Southern Ocean is such that results from specific study sites cannot be extrapolated to other regions (Barbraud et al. Citation2012). It is therefore essential to conduct comparative regional studies on quite a fine spatial scale to explore changing dynamics of food webs within the Southern Ocean (Allan et al. Citation2013). Changes in trophic interactions are thought to happen mostly through bottom-up processes (see also Barbraud et al. Citation2012), whereby climate-induced changes in oceanographic conditions directly affect species at low trophic levels, which ultimately also impact apex predators (Bond & Lavers Citation2014; Bost et al. Citation2015). Predators such as seabirds and marine mammals integrate changes in food webs at levels below them and are thus good indicators of the state of marine trophic webs (Weimerskirch et al. Citation2003; Parsons et al. Citation2008). Moreover, many of the land-breeding species in the Southern Ocean are central place foragers that can be easily sampled when they return to their young at predictable colony sites, facilitating dietary studies that can extend over long periods.
The Antarctic fur seal (Arctocephalus gazella; AFS) is a key predator that numbers in the millions in the Southern Ocean (Trathan et al. Citation2012). Populations of AFS plummeted as a result of intensive sealing in the late 19th century, but they have recovered markedly since the cessation of harvesting (Kirkman et al. Citation2000; Hofmeyr et al. Citation2005), expanding to reoccupy their former range as their numbers have increased. The breeding distribution of AFS extends from the South Shetland Islands eastward to Heard Island (), with an additional breeding site at Macquarie Island (Gentry & Kooyman Citation1986; Robinson et al. Citation2002). During the breeding season, female AFS need to attend their pups onshore regularly to nurse them (Staniland & Robinson Citation2008). During this time of the year, they therefore behave as central place foragers that sample a limited zone within a relatively short distance from their breeding site (Hofmeyr et al. Citation2010; Staniland et al. Citation2012; Lowther et al. Citation2014). Populations of breeding AFS can therefore provide valuable information regarding the state of local trophic webs. Their flexible dietary habits make them a good indicator of potential changes in the prey community, which are often reflected in the diet of AFS (Reid et al. Citation2006). They are known to eat Antarctic krill (Euphausia superba), hereafter simply referred to as krill, extensively (Boyd Citation2002), but they also prey on mackerel icefish (Champsocephalus gunnari) and various myctophid fishes such as Protomyctophum choriodon, Electrona antarctica, Electrona carlsbergi and Gymnoscopelus nicholsi (Kirkman et al. Citation2000; Trathan et al. Citation2007). The diet of AFS is known to vary at large spatial scales; in the Scotia Sea and the Antarctic Peninsula areas, AFS feed mainly on krill (Klages et al. Citation1999; Reid et al. Citation2006), while in the southern Indian Ocean they rely strongly on myctophid fish (Green et al. Citation1989; Cherel et al. Citation2007; Kernaléguen et al. Citation2012). Most studies conducted on this species are performed at the extremes of their distribution range, for example, South Georgia and the Kerguelen Islands (Staniland & Robinson Citation2008; Huang et al. Citation2011; Kernaléguen et al. Citation2015). In comparison, relatively little information is available regarding the foraging ecology of this species, or the marine trophic web in general, in central regions of the AFS's distributional range (Jacob et al. Citation2006). Climate change is expected to affect different areas of the Southern Ocean differently (Trathan et al. Citation2007), and one cannot assume that knowledge of the trophic dynamics from specific areas can be extrapolated to other regions. There is therefore a need for more information from areas of the AFS's distribution range that remain understudied.
Abbreviations in this article
AFS: Antarctic fur seal(s)
CI: confidence interval
LIE: Stable Isotopes Laboratory, Doñana Biological Station, Seville, Spain
Fig. 1 Circumpolar distribution map of all known breeding sites (triangles) of the AFS (Arctocephalus gazella). Filled triangles indicate the study sites mentioned in . Baseline mapping data are from Scambos et al. (Citation2007) and bathymetric data are from Amante & Eakins (Citation2009).
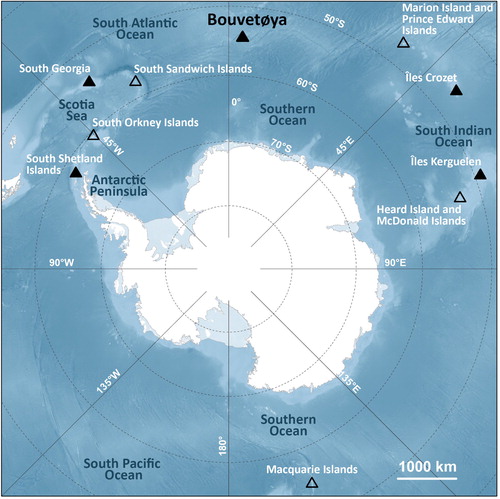
The primary objective of this study was to examine trophic dynamics of breeding female AFS using stable isotope analysis of whole blood and plasma from a population located in one of the least studied areas of this species’ distributional range: Bouvetøya (). Because different tissues have distinct cellular and molecular turnover rates, their isotopic ratios integrate the average diet of an individual over periods varying from ca. 10 days (e.g., blood plasma) to ca. two months (e.g., whole blood), and even years using other tissues (Lesage et al. Citation2002; Zhao et al. Citation2006). In this study, isotopic ratios of whole blood were used to assess the diet averaged over the breeding season, while isotopic ratios of plasma provided snapshots of the diet of lactating female AFS at a finer temporal scale. Firstly, isotopic ratios of whole blood samples collected 17 years apart were analysed to explore whether dietary shifts have taken place over this extended time interval. Given the expectations of declines in krill abundance as a result of climate change (Flores et al. Citation2012; Hill et al. Citation2013), it is expected that AFS at Bouvetøya will have shifted their diet to prey at a higher trophic level, as has been observed in other regions of the Southern Ocean (Huang et al. Citation2011). Secondly, potential seasonal shifts in diet were explored using isotopic ratios in plasma collected cross-sectionally during the breeding seasons of several years.
Material and methods
Sample collection
Blood samples were collected from female AFS breeding at Bouvetøya, Southern Ocean (54°25′S 3°20′E; ) during the breeding period, between early January and mid-February during the years 1997, 2001, 2002 and 2015 (Supplementary Table S1). The breeding season for this species at this study site lasts from mid-November to late March (Blanchet et al. Citation2013). Blood samples were collected from the extradural vein using 50-ml syringes and stored in heparinized collection tubes. In 1997, both plasma (after centrifugation of an aliquot) and whole blood were collected. Only plasma was sampled in the years 2001 and 2002, while only whole blood was collected in 2015 (). All samples were kept frozen at −18°C until laboratory analyses were performed.
Table 1 Sample sizes for tissues, by collection year, from female AFS (Arctocephalus gazella) during the breeding season at Bouvetøya (54°23′S 3°47′E).
Isotopic analyses
In the laboratory, all samples were frozen at −80°C for 24h before being freeze-dried for 48 h. Samples were then powdered using a ball mill grinder, and a small aliquot (0.7 mg) of each sample was encapsulated into a tin capsule before being combusted using a Flash HT Plus elemental analyser coupled to a Delta-V Advantage isotope ratio mass spectrometer via a ConFlo IV interface (Thermo Fisher Scientific) at LIE. Isotopic ratios of carbon (δ 13C) and nitrogen (δ 15N) are expressed using the following notation: ‰ of the deviation from isotopic ratios of international standards, that is, Pee Dee Belemnite carbonate for carbon and atmospheric air for nitrogen (DeNiro & Epstein Citation1978). The following internal standards were used after calibration with the above-mentioned international standards supplied by the International Atomic Energy Agency: EBD-23 (cow horn), LIE-BB (whale baleen) and LIE-PA (bird feathers). Overall measurement precision was evaluated by duplicating a random subset of samples (Jardine & Cunjak Citation2005). The mean absolute difference between duplicates was 0.08‰ (95% CI=[0.06; 0.10], n=40) and 0.07‰ (95% CI=[0.06; 0.09], n=40), respectively, for δ 13C and δ 15N. In order to allow for direct comparison of isotopic values among tissues with different enrichment factors (Bearhop et al. Citation2002), all isotopic data were corrected using enrichment factors experimentally determined for lactating northern fur seals (Callorhinus ursinus) (Kurle Citation2002), that is, +3.5‰ and +3.7‰ for δ 15N in red blood cells and plasma, respectively, and +1.2‰ and +0.5‰ for δ 13C in red blood cells and plasma, respectively. Because whole blood is particularly enriched in red blood cells, especially in diving mammals (Hobson et al. Citation1996), we assumed that discrimination factors determined for red blood cells could be safely applied to whole blood samples.
Lipid correction
Lipids in tissues can bias δ 13C values (Logan et al. Citation2008; Tarroux et al. Citation2010), and high lipid contents in animal tissues alter their mass ratio of carbon over nitrogen (C:N ratio), with ratios >4.0 typically indicating significant amounts of lipids (Post et al. Citation2007). In order to derive normalization equations suited to this study system (Wilson et al. Citation2014), lipids were chemically extracted from 20 samples through four successive rinses with a 2:1 chloroform/methanol solution as a solvent, following the modified method of Bligh & Dyer (Citation1959). Lipid extraction was also conducted at the LIE. Subsequently, δ 13C values and C:N ratios before versus after lipid extraction were compared and normalization equations were fitted following Ehrich et al. (Citation2010). All plasma δ 13C values were then corrected (Supplementary Table S1) using the normalization equation that best fitted our data, while δ 15N values were left uncorrected, as lipid content should not affect δ 15N (Yurkowski et al. Citation2015). The C:N ratios of bulk whole blood samples were all <4.0, confirming that lipid normalization was unnecessary for those samples.
Statistical analyses
Data were processed and analysed in the R statistical software, version 3.2.2 (R Development Core Team Citation2016). Linear models were used to explore temporal patterns in δ 13C and δ 15N, using the function lm from package stats. Analyses were conducted at two temporal scales: (1) interannual, using isotopic ratios from a slow-turnover rate tissue (whole blood) and year (1997 versus 2015) as a factor variable, and (2) seasonal, using isotopic ratios from a fast-turnover rate tissue (plasma) with Julian date as a continuous explanatory variable. CIs based on frequentist statistics were calculated at the 95% probability level and are noted as “95% CI”. To compare the isotopic niche among years, data were plotted using isotopic biplots and niche regions (Nr) were computed for each year using the package nicheROVER (Swanson et al. Citation2015). For a given group of individuals, Nr corresponds to the portion of a multidimensional isotopic space (two-dimensional in this study) where the probability of finding any individual from that group is equal to a given, user-defined threshold (Swanson et al. Citation2015). For each year, 40 and 95% were used as the thresholds defining the core and global Nr, respectively. This approach uses a Bayesian framework, which allows the estimation of the uncertainty around the posterior parameters (credible intervals). Ten thousand random elliptical projections of Nr were drawn from the posterior distributions in order to obtain credible intervals around the parameter estimates. The niche overlap between two groups is defined as the probability of an individual drawn randomly from a given group to be found in the Nr corresponding to the other group. The niche overlap is therefore asymmetrical; overlap between group A and group B is not equivalent to overlap between groups B and A, and each actually depends on how evenly the two individual groups use their own niche areas (Swanson et al. Citation2015). Finally, ellipse areas were calculated in order to compare the global and core Nr areas between 1997 and 2015.
Results
Interannual trend
At an interannual scale, there was a statistically significant increase in both δ 13C and δ 15N in whole blood (, ) in the 2015 samples compared to the samples collected in 1997. When taking the effect of sampling date into account (Julian day), δ 13C in whole blood was on average 1.2‰ (95% CI=[0.7; 1.7]) higher and δ 15N on average 1.3‰ (95% CI=[0.8; 1.7]) higher in 2015 compared to 1997. This corresponds to an average increase of 0.067 and 0.072‰ yr−1, for δ 13C and δ 15N, respectively. This translated into only partially overlapping 95% Nr in the isotopic space, with an overlap between 1997 and 2015 estimated at 11.4% (95% credible interval=[3.3; 25.4]) on average (). Conversely, the overlap between the 95% Nr from 2015 and that of 1997 was 25.2% (95% credible interval=[6.1; 58.0]). The core 40% Nr ellipses were not overlapping (). A contraction of the Nr areas between 1997 and 2015, which corresponded to a narrowing by ca. 38 and 28%, respectively, for the global and core Nr areas, was also observed (, ).
Fig. 2 Interannual variation in isotopic ratios in whole blood (N1997=41 and N2015=36) of female AFS (Arctocephalus gazella) from Bouvetøya. Isotopic biplots show the interannual variation in mean (± SD, empty symbols and error bars) carbon (δ 13C) and nitrogen (δ 15N) isotopic ratios for 1997 (orange) and 2015 (black). The estimated 40% (inner, representing the core niche region) and 95% (outer, representing the global niche region) random ellipses are also shown for each year. Ten thousand random ellipses were generated for each year and each Nr threshold, but for clarity only the first 1000 are shown in this figure. Density curves for each isotope and each year are also drawn marginally along the corresponding axis. Discrimination factors were applied to δ 13C and δ 15N values.
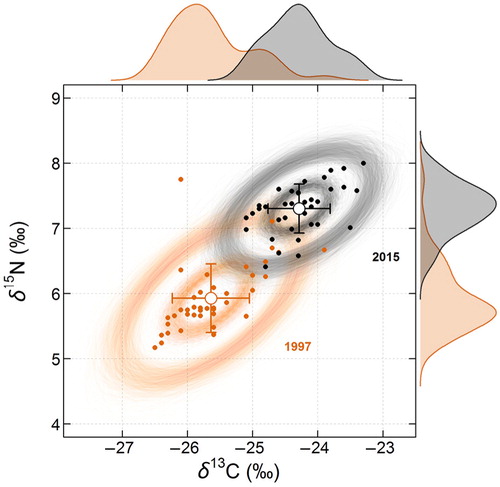
Fig. 3 Shift in isotopic niche region areas between 1997 and 2015 for (a) the 95% (global niche region) and (b) 40% (core niche region) thresholds, based on carbon and nitrogen isotopic ratios of female AFS (Arctocephalus gazella) from Bouvetøya. Sample size is 1000 for each group, based on the random elliptical projections of Nr that were generated from this study (see methods for details; Swanson et al. Citation2015).
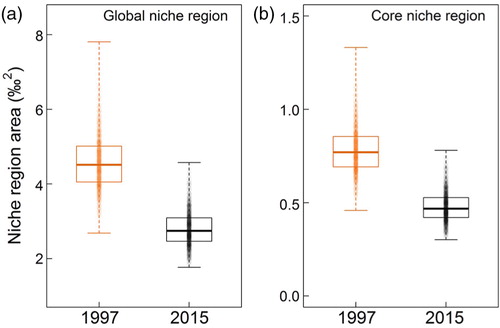
Table 2 Interannual variation in isotopic ratios. Comparison of linear models explaining the shift in isotopic ratios (δ 13C and δ 15N) in whole blood of female AFS (Arctocephalus gazella) from Bouvetøya, between 1997 (intercept level) and 2015 (see ). Boldface indicates P values significant at the 0.05 statistical level.
Potential seasonal trends
δ 13C and δ 15N of plasma samples also appeared to show trends within years (, ). δ 13C decreased on average by 0.7‰ per month (95% CI=[−0.9; −0.6]), while δ 15N increased on average by 1.1‰ per month (95% CI=[0.7; 1.4]) in samples collected cross-sectionally, when a composite was made of several years. However, the suggested trend disappeared (δ 15N) or became statistically non-significant (δ 13C) if year of sampling was included as a covariate in the models (, ).
Fig. 4 (a) Nitrogen (δ 15N) and (b) carbon (δ 13C) isotopic ratios in plasma (N=96) of female AFS (Arctocephalus gazella) from Bouvetøya displayed across the timing of the breeding season using cross-sectional sampling in three years. The black lines and grey-shaded areas show the mean and standard error predicted from a simple linear model on the data pooled over three years (Y ~ Julian day). The orange lines and shaded areas show the same information but from a linear model where year is included as a covariate (Y ~ Julian day + Year). Discrimination factors were applied to δ 13C and δ 15N values (see methods for details).
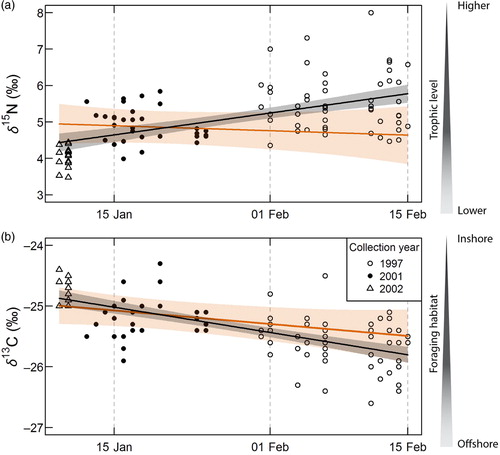
Table 3 Intra-seasonal variation in isotopic ratios. Comparison of linear models predicting δ 13C and δ 15N in plasma of female AFS (Arctocephalus gazella) from Bouvetøya. For each response variable, two models are compared, one with and one without an effect of sampling year (see ). Boldface indicates P values significant at the 0.05 statistical level.
Discussion
Only a few studies have investigated temporal changes in diet of AFS using stable isotope analyses (). This study presents the first interannual foraging assessment for female AFS from one of the least studied areas within the species range, Bouvetøya. The diet of AFS varies at large spatial scales with stronger reliance on krill in the Scotia Sea compared a stronger reliance on fish in southern Indian Ocean (Reid et al. Citation2006; Kernaléguen et al. Citation2012). Superimposed on this large-scale pattern, the relative contribution of fish within the diet of AFS can also vary both at smaller spatial scales (i.e., at the scale of the individual foraging range; Reid et al. Citation2006) and at shorter temporal scales (i.e., throughout the breeding season; Polito & Goebel Citation2010). The AFS samples from Bouvetøya show a significant increase in the averages of both δ 13C and δ 15N at interannual scale, between 1997 and 2015. The limited sampling across the breeding season did not allow conclusive statistical testing of intra-seasonal patterns. However, cross-sampled material from several years, put together across the breeding season, suggests a potential decrease in δ 13C and an increase in δ 15N as the breeding season progresses, which warrants future research attention.
Table 4 Comparative summary of the results from isotopic studies on AFS (Arctocephalus gazella), including the present study. Temporal trends in isotopic values for carbon and nitrogen are indicated, along with a plausible interpretation when a positive (↑) or negative (↓) trend was detected. See for a map of the study sites.
Interannual trend
Given that isotopic ratios of whole blood integrate dietary data over several months, the results of this study from two different decades, covering the same period (beginning) of the pup-rearing season, are quite robust. During the breeding seasons of 1996/97, 1997/98 and 2001/02, krill was the main prey found in scats and stomach contents of AFS on Bouvetøya (Klages et al. Citation1999; Kirkman et al. Citation2000; Hofmeyr et al. Citation2010), which is consistent with the low δ 13C and δ 15N measures for 1997. Krill was also the dominating prey item in the diet of chinstrap penguins (Pygoscelis antarctica) for all years (1997, 1999 and 2001) in which diet has been studied at Bouvetøya (Niemandt et al. Citation2016). In contrast, the macaroni penguin (Eudyptes chrysolophus) breeding at Bouvetøya relied heavily on myctophid fish during the breeding seasons of 1997, 1999 and 2001, but crustaceans, mostly krill, dominated their diet in 2008 (Niemandt et al. Citation2016). The concurrent positive trends in δ 13C and δ 15N from 1997 to 2015 in the present study indicate the integration of more prey of higher trophic level in the diet in the latter period (Hanson et al. Citation2009), which are likely myctophid fish and cephalopods—previously identified as secondary prey for AFS (Klages et al. Citation1999; Kirkman et al. Citation2000; Hofmeyr et al. Citation2010; Stowasser et al. Citation2012). Alternative explanations are, however, possible. Firstly, given that post-larval krill, as they grow from the youngest (<30 mm) to the oldest (>50 mm) life stages, undergo average increases of ca. 1.2‰ and 2.1‰ in δ 13C and δ 15N, respectively (Polito et al. Citation2013). The shift in isotopic ratios observed in this study could therefore reflect a change in the size/age of krill consumed rather than a switch in prey species. From year to year, the age structure, and thus size-classes, within krill populations can vary markedly due to irregular recruitment of younger individuals (Reid et al. Citation2002; Murphy et al. Citation2007). While the increases in δ 13C and δ 15N presented by Polito et al. (Citation2013) are similar to the shifts measured in this study, they would imply a drastic change from feeding almost exclusively on the smallest krill to feeding almost exclusively on the largest, which is highly unlikely. Krill measured from scats or regurgitations at Bouvetøya during the austral summer of 1998/99 (Kirkman et al. Citation2000) were smaller at the beginning (50.2 mm) than at the end (51.5 mm) of the season, though the magnitude of the size increment (+1.3 mm) was minimal. In the austral summer of 2001/02, the average length of krill (obtained from AFS regurgitations at Bouvetøya) was 51.2 mm (Hofmeyr et al. Citation2010). In the Scotia Sea, krill populations almost solely composed of large (>50 mm) individuals rarely occur (Reid et al. Citation2002). Therefore, it seems very unlikely that the results reported in this study reflect a shift towards larger krill. Secondly, a shift in the baseline isotopic values in the Southern Ocean could theoretically produce a trend such as the one documented herein. There is, however, no evidence that a concurrent change in baseline δ 13C and δ 15N values has occurred. On the contrary, some studies have shown a remarkable stability in long-term, multiyear isotopic trends of AFS from distant areas such as the islands of South Georgia, Kerguelen and Crozet (Kernaléguen et al. Citation2012; Kernaléguen et al. Citation2015). A shift in baseline isotopic values therefore seems highly unlikely, which supports the hypothesis that a long-term shift towards prey at a higher trophic level has occurred between 1997 and 2015 in the diet of female AFS from Bouvetøya.
A substantial contraction was measured from 1997 to 2015, concurrently, in both the global and core niche areas of AFS at Bouvetøya. This narrowing could indicate a more specialized diet or a stronger reliance on prey that are less isotopically diverse. Interestingly, female AFS in 2015 still seemed to use a substantial portion of the global Nr from 1997, as shown by the 25.2% overlap. In contrast, female AFS in 1997 were using much less of the area corresponding to the global Nr of 2015. This suggests that female AFS in 2015 not only shifted their trophic niche, but also intensified their use of some of the resources that were already utilized, although to a lesser extent, in 1997.
Potential seasonal trends
Seasonal variation in the diet of lactating female AFS at other study sites has been well documented (Staniland & Pond Citation2005; Reid et al. Citation2006, and references therein; Polito & Goebel Citation2010; Kernaléguen et al. Citation2015). These studies report that AFS are gradually taking more fish/squid as they progress through the pup-rearing season (Ichii et al. Citation2007; Polito & Goebel Citation2010; Kernaléguen et al. Citation2015). The cross-sectional sampling in this study, using a composite of seasonal periods across years, suggests that the animals at Bouvetøya might show similar seasonal trends. This pattern could reflect either a dietary shift leading to a greater reliance on prey of higher trophic level, coupled to a spatial shift towards increased offshore feeding, or alternatively an influx of more pelagic prey within the AFS foraging range, as the breeding season progresses. As mentioned previously, these results require cautious interpretation because the sampling regime prevented statistical discrimination of the effect of year from that of the Julian date. However, several cues point towards seasonal variation as being quite likely. Satellite-tracked adult female AFS from Bouvetøya have been shown to forage farther offshore as the season progresses (Biuw et al. Citation2009; Blanchet et al. Citation2013; Lowther et al. Citation2014). This is perhaps not surprising given the density of krill predators doing central place foraging from the island (Blanchet et al. Citation2013); near-shore krill likely become depleted before the end of the fur seal breeding season. A shift in foraging patterns of females could also be explained by the higher energy requirements of pup feeding and rearing as they grow; older pups can cope for longer periods of time between successive feeding events, but need a larger food load at each provisioning.
At Bouvetøya δ 15N, though increasing from 1997 to 2002, always remained rather low, on average <6.0‰, as compared to δ 15N of ca. 11‰ in areas such as the Kerguelen Islands, where the diet is mostly fish based (Cherel et al. Citation2007). This suggests the prevalence and/or preference for prey at lower trophic levels, such as krill, even late in the breeding season at Bouvetøya compared to other areas. However, as also noted in other studies, this study confirms a relatively wide realized trophic niche in the AFS (Stowasser et al. Citation2012).
Conclusion
The relatively strong reliance of AFS from Bouvetøya on krill in the years 1997–2002 suggests that this site is more similar to breeding sites in the Scotia Sea compared to those further east, in the southern Indian Ocean. Interestingly, in spite of a possible strong shift in isotopic niche from 1997 to 2015, female AFS at Bouvetøya did not switch to a completely distinct fish/cephalopod diet; rather, they expanded their trophic niche to include more prey at high trophic levels, while still eating significant quantities of krill. Relatively few studies have addressed the diet of AFS using stable isotopes, and those that do exist have been focused mainly on two areas: the Antarctic Peninsula (Polito & Goebel Citation2010; Huang et al. Citation2011; Brault et al. Citation2013) and the southern Indian Ocean (Cherel et al. Citation2007; Kernaléguen et al. Citation2012; Kernaléguen et al. Citation2015). The trophic system of Bouvetøya—a remote, little-studied location that hosts the planet's second largest breeding population of AFS—is particularly important to study. The results of this study constitute the first isotopic assessment of the diet of female AFS from Bouvetøya at multiple timescales and provide a baseline for the use of this predator species as a sentinel of the marine trophic system in one of the least studied areas of its distribution range.
Supplementary Material
Download PDF (334.9 KB)Acknowledgements
This work was supported by the Norwegian Antarctic Research Expedition programme and the Norwegian Polar Institute. We thank all of the people who have helped with sample collection over the years. All capture and handling procedures were done in accordance with the requirements of the Norwegian Animal Research Authority. We thank Heidi Ahonen (Norwegian Polar Institute) for preparing the samples and Ricardo Álvarez and Susana Carrasco (LIE) for conducting the lipid extractions and the isotopic analyses.
Notes
To access the supplementary material for this article, please see the supplementary file under Article Tools, online.
Related Research Data
References
- Allan L.E., Froneman W.P., Durgadoo J.V., McQuaid C.D., Ansorge I.J., Richoux N.B. Critical indirect effects of climate change on sub-Antarctic ecosystem functioning. Ecology and Evolution. 2013; 3: 2994–3004.
- Amante C., Eakins B. ETOPO1 1 Arc-Minute global relief model: procedures, data sources and analysis. 2009. NOAA Technical Memorandum NESDIS NGDC-24. Boulder: National Geophysical Data Center, Marine Geology and Geophysics Division, National Oceanic and Atmospheric Administration..
- Barbraud C., Rolland V., Jenouvrier S., Nevoux M., Delord K., Weimerskirch H. Effects of climate change and fisheries bycatch on Southern Ocean seabirds: a review. Marine Ecology Progress Series. 2012; 454: 285–307.
- Bearhop S., Waldron S., Votier S.C., Furness R.W. Factors that influence assimilation rates and fractionation of nitrogen and carbon stable isotopes in avian blood and feathers. Physiological and Biochemical Zoology. 2002; 75: 451–458.
- Biuw M., Krafft B.A., Hofmeyr G.J.G., Lydersen C., Kovacs K.M. Time budgets and at-sea behaviour of lactating female Antarctic fur seals Arctocephalus gazella at Bouvetøya. Marine Ecology Progress Series. 2009; 385: 271–284.
- Blanchet M.-A., Biuw M., Hofmeyr J., de Bruyn P., Lydersen C., Kovacs K. At-sea behaviour of three krill predators breeding at Bouvetøya—Antarctic fur seals, macaroni penguins and chinstrap penguins. Marine Ecology Progress Series. 2013; 477: 285–302.
- Bligh E.G., Dyer W.J. A rapid method of total lipid extraction and purification. Canadian Journal of Biochemistry and Physiology. 1959; 37: 911–917.
- Bond A.L., Lavers J.L. Climate change alters the trophic niche of a declining apex marine predator. Global Change Biology. 2014; 20: 2100–2107.
- Bost C.A., Cotte C., Terray P., Barbraud C., Bon C., Delord K., Gimenez O., Handrich Y., Naito Y., Guinet C., Weimerskirch H. Large-scale climatic anomalies affect marine predator foraging behaviour and demography. Nature Communications. 2015; 6: article no. 8220, doi: http://dx.doi.org/10.1038/ncomms9220.
- Boyd I.L. Estimating food consumption of marine predators: Antarctic fur seals and macaroni penguins. Journal of Applied Ecology. 2002; 39: 103–119.
- Brault E.K., Goebel M.E., Geisz H.N., Canuel E.A., Dickhut R.M. Inter-annual variation of persistent organic pollutants (POPs) in an Antarctic top predator Arctocephalus gazella . Environmental Science & Technology. 2013; 47: 12744–12752.
- Cherel Y., Hobson K.A., Guinet C., Vanpe C. Stable isotopes document seasonal changes in trophic niches and winter foraging individual specialization in diving predators from the Southern Ocean. Journal of Animal Ecology. 2007; 76: 826–836.
- DeNiro M.J., Epstein S. Influence of diet on the distribution of carbon isotopes in animals. Geochimica et Cosmochimica Acta. 1978; 42: 495–506.
- Ehrich D., Tarroux A., Stien J., Lecomte N., Killengreen S., Berteaux D., Yoccoz N.G. Stable isotope analysis: modelling lipid normalization for muscle and eggs from Arctic mammals and birds. Methods in Ecology and Evolution. 2010; 2: 66–76.
- Flores H., Atkinson A., Kawaguchi S., Krafft B., Milinevsky G., Nicol S., Reiss C., Tarling G., Werner R., Bravo Rebolledo E., Cirelli V., Cuzin-Roudy J., Fielding S., van Franeker J., Groeneveld J., Haraldsson M., Lombana A., Marschoff E., Meyer B., Pakhomov E., Van de Putte A., Rombolá E., Schmidt K., Siegel V., Teschke M., Tonkes H., Toullec J., Trathan P., Tremblay N., Werner T. Impact of climate change on Antarctic krill. Marine Ecology Progress Series. 2012; 458: 1–19.
- Gentry R.L., Kooyman G.L. Fur seals: maternal strategies on land and at sea. 1986; Princeton, NJ: Princeton University Press.
- Green K., Burton H.R., Williams R. The diet of Antarctic fur seals Arctocephalus gazella (Peters) during the breeding season at Heard Island. Antarctic Science. 1989; 1: 317–324.
- Gutt J., Bertler N., Bracegirdle T.J., Buschmann A., Comiso J., Hosie G., Isla E., Schloss I.R., Smith C.R., Tournadre J., Xavier J.C. The Southern Ocean ecosystem under multiple climate change stresses—an integrated circumpolar assessment. Global Change Biology. 2015; 21: 1434–1453.
- Hanson N., Wurster C., Bird M., Reid K., Boyd I. Intrinsic and extrinsic forcing in life histories: patterns of growth and stable isotopes in male Antarctic fur seal teeth. Marine Ecology Progress Series. 2009; 388: 263–272.
- Hill S.L., Phillips T., Atkinson A. Potential climate change effects on the habitat of Antarctic krill in the Weddell quadrant of the Southern Ocean. PLoS One. 2013; 8: e72246.
- Hobson K.A., Schell D.M., Renouf D., Noseworthy E. Stable carbon and nitrogen isotopic fractionation between diet and tissues of captive seals: implications for dietary reconstructions involving marine mammals. Canadian Journal of Fisheries and Aquatic Sciences. 1996; 53: 528–533.
- Hofmeyr G.J.G., Bester M., Kirkman S., Lydersen C., Kovacs K. Intraspecific differences in the diet of Antarctic fur seals at Nyrøysa, Bouvetøya. Polar Biology. 2010; 33: 1171–1178.
- Hofmeyr G.J.G., Krafft B.A., Kirkman S.P., Bester M.N., Lydersen C., Kovacs K.M. Population changes of Antarctic fur seals at Nyrøysa, Bouvetøya. Polar Biology. 2005; 28: 725–731.
- Huang T., Sun L., Stark J., Wang Y., Cheng Z., Yang Q., Sun S. Relative changes in krill abundance inferred from Antarctic fur seal. PLoS One. 2011; 6: e27331.
- Ichii T., Bengtson J., Boveng P., Takao Y., Jansen J., Hiruki-Raring L., Cameron M., Okamura H., Hayashi T., Naganobu M. Provisioning strategies of Antarctic fur seals and chinstrap penguins produce different responses to distribution of common prey and habitat. Marine Ecology Progress Series. 2007; 344: 277–297.
- Jacob U., Brey T., Fetzer I., Kaehler S., Mintenbeck K., Dunton K., Beyer K., Struck U., Pakhomov E.A., Arntz W.E. Towards the trophic structure of the Bouvet Island marine ecosystem. Polar Biology. 2006; 29: 106–113.
- Jardine T.D., Cunjak R.A. Analytical error in stable isotope ecology. Oecologia. 2005; 144: 528–533.
- Kernaléguen L., Arnould J.P.Y., Guinet C., Cherel Y. Determinants of individual foraging specialization in large marine vertebrates, the Antarctic and Subantarctic fur seals. Journal of Animal Ecology. 2015; 84: 1081–1091.
- Kernaléguen L., Cazelles B., Arnould J.P.Y., Richard P., Guinet C., Cherel Y. Long-term species, sexual and individual variations in foraging strategies of fur seals revealed by stable isotopes in whiskers. PLoS One. 2012; 7: e32916.
- Kirkman S.P., Wilson W., Klages N.T.W., Bester M.N., Isaksen K. Diet and estimated food consumption of Antarctic fur seals at Bouvetøya during summer. Polar Biology. 2000; 23: 745–752.
- Klages N.T.W., Hofmeyr G.J.G., Gjertz I.L.B. Prey of Antarctic fur seals at Bouvetøya, Southern Ocean. Polar Record. 1999; 35: 255–257.
- Kurle C.M. Stable-isotope ratios of blood components from captive northern fur seals (Callorhinus ursinus) and their diet: applications for studying the foraging ecology of wild otariids. Canadian Journal of Zoology. 2002; 80: 902–909.
- Lesage V., Hammill M.O., Kovacs K.M. Diet-tissue fractionation of stable carbon and nitrogen isotopes in phocid seals. Marine Mammal Science. 2002; 18: 182–193.
- Logan J.M., Jardine T.D., Miller T.J., Bunn S.E., Cunjak R.A., Lutcavage M.E. Lipid corrections in carbon and nitrogen stable isotope analyses: comparison of chemical extraction and modelling methods. Journal of Animal Ecology. 2008; 77: 838–846.
- Lowther A.D., Lydersen C., Biuw M., de Bruyn P.J.N., Hofmeyr G.J.G., Kovacs K.M. Post-breeding at-sea movements of three central-place foragers in relation to submesoscale fronts in the Southern Ocean around Bouvetøya. Antarctic Science. 2014; 26: 533–544.
- McBride M.M., Dalpadado P., Drinkwater K.F., Godø O.R., Hobday A.J., Hollowed A.B., Kristiansen T., Murphy E.J., Ressler P.H., Subbey S., Hofmann E.E., Loeng H. Krill, climate, and contrasting future scenarios for Arctic and Antarctic fisheries. ICES Journal of Marine Science. 2014; 71: 1934–1955.
- Murphy E.J., Trathan P.N., Watkins J.L., Reid K., Meredith M.P., Forcada J., Thorpe S.E., Johnston N.M., Rothery P. Climatically driven fluctuations in Southern Ocean ecosystems. Proceedings of the Royal Society of London B. 2007; 274: 3057–3067.
- Niemandt C., Kovacs K.M., Lydersen C., Dyer B.M., Isaksen K., Hofmeyr G.J.G., Mehlum F., de Bruyn P.J.N. Chinstrap and macaroni penguin diet and demography at Nyrøysa, Bouvetøya. Antarctic Science. 2016; 28: 91–100.
- Parsons M., Mitchell I., Butler A., Ratcliffe N., Frederiksen M., Foster S., Reid J.B. Seabirds as indicators of the marine environment. ICES Journal of Marine Science. 2008; 65: 1520–1526.
- Polito M.J., Goebel M.E. Investigating the use of stable isotope analysis of milk to infer seasonal trends in the diets and foraging habitats of female Antarctic fur seals. Journal of Experimental Marine Biology and Ecology. 2010; 395: 1–9.
- Polito M.J., Reiss C.S., Trivelpiece W.Z., Patterson W.P., Emslie S.D. Stable isotopes identify an ontogenetic niche expansion in Antarctic krill (Euphausia superba) from the South Shetland Islands, Antarctica. Marine Biology. 2013; 160: 1311–1323.
- Post D.M., Layman C.A., Arrington D.A., Takimoto G., Quattrochi J., Montana C.G. Getting to the fat of the matter: models, methods and assumptions for dealing with lipids in stable isotope analyses. Oecologia. 2007; 152: 179–189.
- R Development Core Team. R: a language and environment for statistical computing. 2016. Version 3.2.5. Accessed on the internet at http://www.r-project.org on 14 April 2016..
- Reid K., Davis D., Staniland I.J. Spatial and temporal variability in the fish diet of Antarctic fur seal (Arctocephalus gazella) in the Atlantic sector of the Southern Ocean. Canadian Journal of Zoology. 2006; 84: 1025–1037.
- Reid K., Murphy E.J., Loeb V., Hewitt R.P. Krill population dynamics in the Scotia Sea: variability in growth and mortality within a single population. Journal of Marine Systems. 2002; 36: 1–10.
- Robinson S.A., Goldsworthy S.G., van den Hoff J., Hindell M.A. The foraging ecology of two sympatric fur seal species, Arctocephalus gazella and Arctocephalus tropicalis, at Macquarie Island during the austral summer. Marine and Freshwater Research. 2002; 53: 1071–1082.
- Scambos T.A., Haran T.M., Fahnestock M.A., Painter T.H., Bohlander J. MODIS-based Mosaic of Antarctica (MOA) data sets: continent-wide surface morphology and snow grain size. Remote Sensing of Environment. 2007; 111: 242–257.
- Staniland I., Pond D. Investigating the use of milk fatty acids to detect dietary changes: a comparison with faecal analysis in Antarctic fur seals. Marine Ecology Progress Series. 2005; 294: 283–294.
- Staniland I., Robinson S.L., Silk J.R.D., Warren N., Trathan P.N. Winter distribution and haul-out behaviour of female Antarctic fur seals from South Georgia. Marine Biology. 2012; 159: 291–301.
- Staniland I.J., Robinson S.L. Segregation between the sexes: Antarctic fur seals, Arctocephalus gazella, foraging at South Georgia. Animal Behaviour. 2008; 75: 1581–1590.
- Stowasser G., Atkinson A., McGill R.A.R., Phillips R.A., Collins M.A., Pond D.W. Food web dynamics in the Scotia Sea in summer: a stable isotope study. Deep-Sea Research Part II. 2012; 59–60: 208–221.
- Swanson H.K., Lysy M., Power M., Stasko A.D., Johnson J.D., Reist J.D. A new probabilistic method for quantifying n-dimensional ecological niches and niche overlap. Ecology. 2015; 96: 318–324.
- Tarroux A., Ehrich D., Lecomte N., Jardine T.D., Bêty J., Berteaux D. Sensitivity of stable isotope mixing models to variation in isotopic ratios: evaluating consequences of lipid extraction. Methods in Ecology and Evolution. 2010; 1: 231–241.
- Trathan P.N., Forcada J., Murphy E.J. Environmental forcing and Southern Ocean marine predator populations: effects of climate change and variability. Philosophical Transactions of the Royal Society of London B. 2007; 362: 2351–2365.
- Trathan P.N., Ratcliffe N., Masden E.A. Ecological drivers of change at South Georgia: the krill surplus, or climate variability. Ecography. 2012; 35: 983–993.
- Weimerskirch H., Inchausti P., Guinet C., Barbraud C. Trends in bird and seal populations as indicators of a system shift in the Southern Ocean. Antarctic Science. 2003; 15: 249–256.
- Wilson R.M., Chanton J.P., Balmer B.C., Nowacek D.P. An evaluation of lipid extraction techniques for interpretation of carbon and nitrogen isotope values in bottlenose dolphin (Tursiops truncatus) skin tissue. Marine Mammal Science. 2014; 30: 85–103.
- Yurkowski D.J., Hussey N.E., Semeniuk C., Ferguson S.H., Fisk A.T. Effects of lipid extraction and the utility of lipid normalization models on δ13C and δ15N values in Arctic marine mammal tissues. Polar Biology. 2015; 38: 131–143.
- Zhao L.Y., Schell D.M., Castellini M.A. Dietary macronutrients influence 13C and 15N signatures of pinnipeds: captive feeding studies with harbor seals (Phoca vitulina). Comparative Biochemistry and Physiology A Molecular and Integrative Physiology. 2006; 143: 469–478.