
Abstract
We demonstrate the use of the anisotropy of magnetic susceptibility (AMS) method to determine the orientation of the principal tectonic strain directions developed during the formation of the West Spitsbergen Fold-and-Thrust Belt (WSFTB). The AMS measurements and extensive rock-magnetic studies of the Lower Triassic rocks reported here were focused on the recognition of the magnetic fabric, the identification of ferromagnetic minerals and an estimation of the influence of ferro- and paramagnetic minerals on magnetic susceptibility. At most sites, the paramagnetic minerals controlled the magnetic susceptibility, and at only one site the impact of ferromagnetic minerals was higher. The AMS technique documented the presence of different types of magnetic fabrics within the sampled sites. At two sites, a normal (Kmin perpendicular to the bedding) magnetic fabric of sedimentary origin was detected. This was associated with a good clustering of the maximum AMS axes imposed by tectonic strain. The Kmax magnetic lineation directions obtained here parallel the general NNW–SSE trend of the WSFTB fold axial traces and thrust fronts. The two other investigated sites possessed mixed and inverted fabrics, the latter of which appear to reflect the presence of iron-bearing carbonates.
The utility of AMS as a complementary method to establish features such as palaeocurrent directions or as proxies for determining tectonic strain orientations in rocks is now well established (e.g., Borradaile & Henry Citation1997; Parés et al. Citation1999). The AMS method, as has been demonstrated by Hrouda & Janak (Citation1976) and Lee & Angelier (Citation2000), is capable of detecting tectonic strains ranging from those only weakly through to those ductily imposed in deformed rocks. Magnetic fabric studies have also been applied to better understand a number of fold-and-thrust belts (Saint-Bezar et al. Citation2002; Louis et al. Citation2006; Robion et al. Citation2007; Vasiliev et al. Citation2009; Weil & Yonkee Citation2009; Maffione et al. Citation2015). In this study, the Hornsund–Sørkapp area in the southern part of the WSFTB was selected for the first time as a target for AMS investigation. Although it is generally agreed that the WSFTB has much in common with other foreland propagating fold-and-thrust belts, the timing and mechanics, including the strain trajectories, are generally controversial as can be gathered, for example, from a comparison of the works by Bergh et al. (Citation1997) and Manby & Lyberis (Citation2001).
In the following sections, the geological setting of the sample sites will be outlined, followed by a description of the methods employed and the results obtained. These studies are based on the analysis of oriented samples. The AMS investigations will focus firstly on the identification of magnetic minerals that govern the AMS of the rock. The obtained AMS ellipsoids will then be compared with the published tectonic strain directions in the target area.
Geological setting and sampling
The NNW–SSE-trending WSFTB () extends over 300 km in length from Kongsfjorden in the north to Sørkapp (South Cape) in the south and is between 100 and 200 km wide in an east–west direction (e.g., Lepvrier Citation2000; Manby & Lyberis Citation2001). It is generally agreed that the WSFTB is of thick- to thin-skinned character when traced from west to east, with uplifted basement blocks along its western margin that give way eastwards to a Late Palaeozoic–Mesozoic cover recording east- and north-east-directed folding and thrust faulting (Birkenmajer Citation1981; Dallmann et al. Citation1993; Braathen & Bergh Citation1995; Manby & Lyberis Citation1996; Bergh et al. Citation1997; Harland Citation1997; Tessensohn Citation2001; Poblet & Lisle Citation2011).
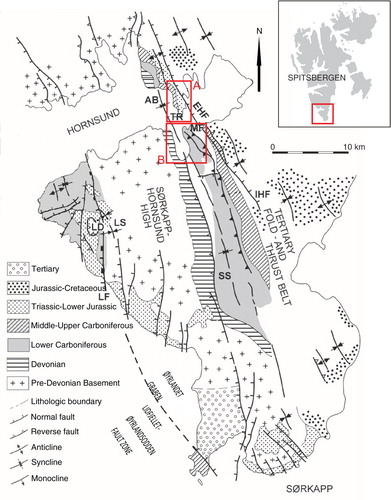
Fig. 1 Simplified tectonic sketch of the southern Spitsbergen, modified from Dallmann (Citation1992) and Bergh & Grogan (Citation2003). Annotated and framed areas denote localities described in the text. Abbreviations: AB, Adriabukta; EHF, Eastern Hornsund Fault; IHF, Inner Hornsund Fault; LS, Liddalen syncline; LD, Liddalen; LF, Liddalen Fault; MF, Meranfjellet; SS, Samarinbreen Syncline; TR, Treskelodden.
While it is beyond the scope of this paper to evaluate the competing models that have been proposed to account for the origin of the WSFTB, they are considered in some detail by the Case 1 Team (Tessensohn Citation2001). Suffice it to say here that there are two main models. The first model appeals to a dextral transpression mechanism in the CHRON 24 (56 Mya)–CHRON 13 (35 Mya) interval along Hornsund and DeGeer Fault zones during the opening of North Atlantic and Eurasian ocean basins (Dallmann Citation1988, Citation1992; Andresen et al. Citation1992; Braathen & Bergh Citation1995; Harland Citation1997) to account for the origin of the WSFTB. A subset of this model (Maher & Craddock Citation1988) invokes a decoupling of the post-CHRON 24 deformation so that the dextral strike–slip component was taken up by the major offshore faults (e.g., the Hornsund Fault), while onshore the deformation was imposed by compressional component orthogonal to the Svalbard Margin. With the exception of the SEDL (Maher et al. Citation1997), no other onshore margin-parallel strike–slip faults that might be expected in support of a transpression model have been identified. Indeed, the evidence for the proposal that the SEDL (Maher et al. Citation1997) lineament represents such an onshore fault zone is questionable in light of extensive field data presented by Manby & Lyberis (Citation1996) and Tessensohn (Citation2001). Leever et al. (Citation2011), on the other hand, disregard the latter field-based studies and favour instead the SEDL as representing a major onshore strike–slip fault in their analogue modelling of the WSFTB.
An alternative two-stage model, based on a stress tensor analysis of the entire WSFTB was first proposed by Lyberis & Manby (Citation1993a, Citationb) and later by Manby & Lyberis (Citation2001). These authors, on the basis of relative plate motion considerations (e.g., Srivastava & Tapscott Citation1986), suggest that as much as 200 km of Greenland–Svalbard orthogonal convergence was triggered by the opening of the Labrador Sea-Baffin Bay. This break-up, which has been modelled at 88 Mya, was followed by seafloor spreading at 70 or 63 Mya (Larsen et al. Citation2009; Hosseinpour et al. Citation2013). Much of the intra-continental deformation within the North Greenland–Canadian Arctic Eurekan and WSFTB regions can be attributed to the anti-clockwise rotation of the Greenland craton with respect to North America (e.g., Roest & Srivastava Citation1989; Jackson & Gunnarsson Citation1990; Srivastava & Roest Citation1999; Müller et al. Citation2008) in the above-mentioned time interval.
Sampling location
The target area is situated in southern Hornsund–Sørkapp sector of the WSFTB which exhibits a typical west Spitsbergen pattern of deformation in the form of east–north-east vergent folds and thrusts incorporating the Late Paleozoic–Mesozoic successions. The extent to which the western Proterozoic–Early Paleozoic basement blocks exhibit the same degree and character of Eurekan deformation is still a matter of debate (e.g., Dallmann Citation1992; Tessensohn Citation2001; Thiedig et al. Citation2001; Michalski et al. Citation2012).
Samples for AMS studies were collected from the Lower Triassic Vardebukta Formation (lower part of Sassendalen Group). Lithologically, this formation is represented in the study area by non-siliceous, grey coloured, variably organic-rich shales, laminated siltstone, mudstones and fine-grained sandstones (Birkenmajer & Trammer Citation1975). The samples were retrieved from the more competent siltstones and mudstones with small amount of carbonates of the Hornsund Vardebukta Formation.
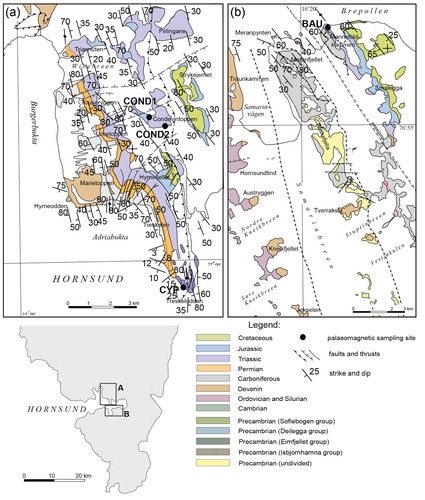
The AMS was measured for four sites located in different parts of the Hornsund–Sørkapp sector of the WSFTB (). Two of the sampled sites—sites 1 and 2 (also referred to as COND1 and COND2; a)—were located on the southern and south-western slopes of Condevintoppen nunatak. The other two sites—site 3 (CYP) and site 4 (BAU)—were located, respectively, on the southernmost tip of Treskelen Peninsula and on the north-west slopes of Bautaen (b). Bedding orientations in those sites are as follows: COND1: 249/42 (dir/dip), COND2: 71/160 and 77/165, BAU: 53/153 and CYP: 79/30. The sampled tectonic structures were first identified by Birkenmajer (Citation1990) and are located on the Norwegian Polar Institute 1:100 000 maps (Ohta & Dallmann Citation1994).
Fig. 2 Locations of sampling sites (map modified from Birkenmajer Citation1990; Ohta & Dallmann Citation1994).
Methods and results
At each of the sampling sites, six to seven hand samples of the common bedding orientation were collected. Samples were subsequently drilled in the laboratory to give specimens of 24 mm diameter. From all four sites, approximately 160 specimens were analysed. All the experiments presented here were conducted in the Palaeomagnetic Laboratory of the Institute of Geophysics, Polish Academy of Sciences.
IRM and Lowrie test
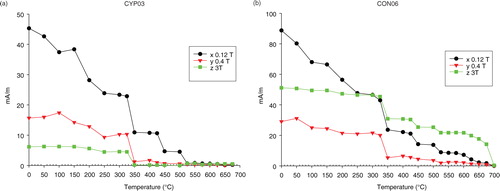
The initial identification of the ferromagnetic minerals was carried out by applying the procedures described by Lowrie (Citation1990) and using a Squid cryogenic magnetometer (2G Enterprises, Mountain View, CA, USA), MMTD80 thermal demagnetizer (Magnetic Measurements, Aughton, UK) and MMPM10 pulse magnetizer (Magnetic Measurements, Aughton, UK). This experiment determines the magnetic carriers, based on coercivities of different minerals and their unblocking temperatures. IRM was applied at 0.12, 0.4 and 3T along three orthogonal axes, x, y and z, respectively. The results from all four sites indicated the presence of magnetic iron sulphides, which was readily identified on all three coercivity curves and displayed maximum unblocking temperatures (max Tub) of 350°C (a). The lack of characteristic (for greigite) decrease in the curves between 200°C and 300°C would suggest that the magnetic minerals present were of pyrrhotite affinity rather than greigite (e.g., Sagnotti & Winkler Citation1999; Roberts et al. Citation2011). All sites were also found to contain low-Ti magnetite, which is distinguished by the appearance of Tub values above 525°C recorded on low and intermediate coercivity curves. At one site (COND1, b), haematite was also found to be present, being marked on the high coercivity curves at Tub values in the 670°C–680°C range. The unblocking temperatures of 450°C and 620°C recorded on low coercivity curves and occasionally on the intermediate curves are attributed to the presence of accessory maghemite.
Fig. 3 Results of thermal demagnetization of a composite three-axis IRM (Lowrie Citation1990). Applied fields: 0.12T (black curve); 0.4 T (red curve) and 3T (green curve) for (a) CYP03 and (b) CON06.
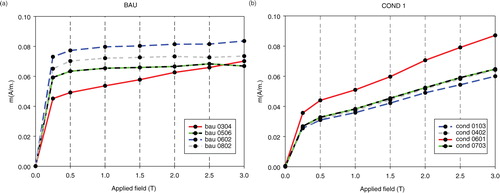
These results are consistent with studies of the IRM acquisition curves carried out using a Squid and MMPM10 pulse magnetizer. The IRM results () were similar at three sites (BAU, CYP, COND2) where specimens reached saturation in the low fields, indicating the presence of low and intermediate coercivity minerals such as pyrrhotite, magnetite and maghemite (a). Only one specimen from site BAU and all specimens from COND1 site displayed the additional presence of a mineral with the highest coercivity interpreted to be haematite (b). The high unblocking temperatures of haematite were also marked to some degree on the low-coercivity curves which could explain the magnetic anisotropy of the studied rocks. This anisotropy can cause the acquired magnetization to not exactly parallel the applied 3T field and consequently influence the results of the experiment.
Fig. 4 Results of stepwise acquisition of IRM for (a) BAU and (b) COND 1.
Magnetic susceptibility versus temperature
Subsequent measurements of the low-field bulk magnetic susceptibility were performed during continuous heating to 700°C and cooling to room temperature using a KLY3S/CS3/CS-L bridge made by Agico (Czech Republic). This experiment indicates the characteristic values of the Curie temperatures for the ferromagnetic minerals present in the sample. Moreover, the specific shape of the initial part of the curves allows an estimation of the percentage contribution of ferro- and paramagnetic minerals ratio to the magnetic susceptibility of the sample to be made (Hrouda et al. Citation1997; García-Lasanta et al. Citation2015). The interpretation of the results () from most of the samples was hampered by thermochemical changes above 400°C, which led to the formation of new magnetite. However, at temperatures below 350–400°C the initial segments of the curves were undisturbed and characterized by both linear and hyperbolic shapes. The use of separation methods for distinguishing the ferromagnetic from the paramagnetic susceptibility components described by Hrouda et al. (Citation1997) indicates that the ferro/para ratio in the investigated material usually falls in the 30–60% range.
Fig. 5 Magnetic susceptibility versus temperature curves. Typical diagram characteristic for sites BAU, CYP and COND2 with (a) heating (red) and cooling (blue) curves and (b) with only heating thermomagnetic curves. Example of diagram from site COND1 with (c) both curves and (d) with only the warming curve.
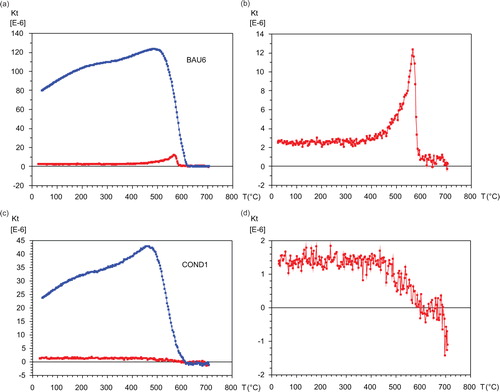
In a few samples from the COND1 site (b), a relatively small amount of thermochemical alteration of the phases prompted the investigation of the undisturbed heating curves at higher temperatures. At this site, the observed Curie/Néel temperatures revealed the presence of magnetite and some of haematite.
Hysteresis parameters
The outcomes of the magnetic susceptibility versus temperature experiments were complementary to the studies of the hysteresis loops derived from the Micro-Mag AGM Vibrating Sample Magnetometer (Lake Shore Cryotronics, Westerville, OH, USA), which was formerly manufactured by Princeton Measurements Corp. The hysteresis loops from all of the samples tested showed a generally paramagnetic behaviour (a), with a minor influence of the ferromagnetic minerals. At only one site (COND1), the ferromagnetic minerals prevailed (b). Magnetization induced in a 0.5 T field achieved the highest values in sites COND2 and CYP, reflecting a higher influence of paramagnetic minerals (Ms1, ). Considering the site mean values of the Ms (saturation magnetization after a paramagnetic slope correction, related to ferromagnetic minerals), it can be concluded that the ferromagnetic contribution did not show any significant variation amongst the sites, with the exception of site BAU, where it was the lowest. The analytical results of the ferro-/paramagnetic contribution to the magnetic susceptibility were similar for most of the sites, typically falling in the 20–50% range but reaching a somewhat higher value at site COND1 ().
Fig. 6 Example of hysteresis loops where (a) the paramagnetic fraction is dominant and (b) the ferromagnetic fraction is dominant. Numbers 1 (large graphs) and 2 (small graphs) indicate loops before and after paramagnetic correction, respectively.
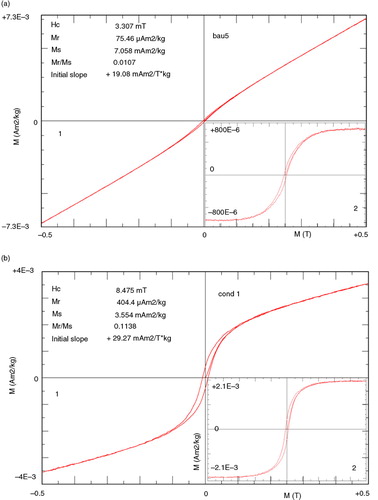
Table 1 Selected hysteresis parameters of investigated samples. The ferro-/paramagnetic minerals ratio was evaluated on the basis of the initial slope values before and after correction for paramagnetic minerals.
The results of the rock-magnetic studies can be summarized as follows. Rock magnetic studies allowed identification of magnetite, magnetic iron sulphides (most probably pyrrhotite) as well as some maghemite at all sites and additionally haematite at site COND1. The ferro- and paramagnetic ratio at three sites was defined at the level 30–60%. Magnetic hysteresis parameters analysis suggested a slightly higher content of ferromagnetic minerals at COND1. These analyses were consistent with those of temperature-dependent magnetic susceptibility.
Anisotropy of magnetic susceptibility
The AMS was measured with an MFK1-FA susceptibility bridge (Agico). The AMS results () display significant diversification between sites. Firstly, the magnetic susceptibility values are differentiated—from ca. 25 to 300*10−6 SI (). The shapes of the AMS ellipsoids and orientation of their axes were also found to vary.
Fig. 7 The AMS results at the investigated sampling sites. Stereographic diagrams show results before the tectonic correction. Abbreviations: K1, maximum axis; K2, intermediate axis; K3 minimum axis; orange line, bedding plane; Km mean magnetic susceptibility; L, magnetic lineation; F, magnetic foliation; Pj, Jelinek's degree of anisotropy; T, shape parameter; P, anisotropy degree. The dashed line in the map of Svalbard indicates the orientation of the WSFTB.
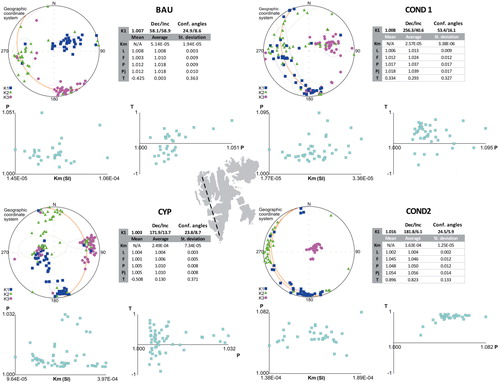
At site COND2, the AMS ellipsoid had a predominantly oblate shape with a magnetic foliation parallel to the bedding plane. The shape of AMS ellipsoid at this site had a generally planar outline, and the maximum axes are relatively well clustered with a general NNW–SSE orientation approximately matching the north-west–south-east regional fold axial traces of the WSFTB. This can be interpreted to represent a composite fabric of mainly sedimentary origin but with a discernible tectonic overprint (e.g., Parés & Van der Pluijm Citation2002). Similar results were observed at site COND1; however, in this case the AMS ellipsoid was more of a combined oblate and triaxial shape and maximum axes were distributed rather around a great-circle girdle with a tendency to grouping in an NNW–SSE orientation. Both the mentioned sites revealed the highest degree of mean anisotropy: 1.054 and 1.018, respectively (Pj, ).
Samples from site BAU revealed completely different AMS properties, corresponding to the so-called inverted magnetic fabrics (e.g., Rochette Citation1988; Rochette et al. Citation1992; Rochette et al. Citation1999; Chadima et al. Citation2006). At this site, the degree of anisotropy was relatively low () and the AMS ellipsoid varied from prolate to triaxial and oblate shapes. The maximum axes were reasonably well clustered and oriented perpendicular to the bedding plane, whereas the minimum axes lay in the bedding plane. The site CYP samples, like those from site BAU, exhibited a variety of AMS ellipsoid shapes. The maximum axes displayed, however, a bimodal distribution, suggesting composite magnetic fabrics. One cluster was oriented perpendicular to the bedding plane, matching the inverted magnetic fabrics, while the other was parallel to the fold axis and regional tectonic trend, suggesting a tectonic origin.
Discussion
The in-depth petro-magnetic investigations described here elucidate the magnetic properties of the rocks under investigation, which is a precondition to any tectonic interpretation based on AMS methods. The ferromagnetic minerals present in the siltstones, mudstones and small number of carbonates from the Vardebukta Formation were iron oxides (mainly magnetite with subordinate contribution of maghemite and haematite) and iron sulphides (pyrrhotite). The results received from the hysteresis parameters and temperature-dependent magnetic susceptibility investigations demonstrate that at all sites the para-/ferromagnetic ratio was approximately uniform (, , ). With the exception of site COND1, where the ferromagnetic minerals prevail slightly, in the remaining sites the paramagnetic contribution into the susceptibility was dominant—in the ca. 50 to ca. 80% range. Considering the lithology of studied rocks, we conclude that the paramagnetic minerals were mostly phyllosilicates.
At two of the studied sites (COND1 and COND2), the maximum AMS axes showed a predominantly NNW–SSE orientation parallel to the regional tectonic trend. Similarly, at site CYP, where the maximum AMS axes display bimodal distribution, one of the distinct populations lay in the bedding plane and also displayed an NNW–SSE trend. At all three sites, such axial alignments are interpreted to be imposed by tectonic processes. It appears therefore that the NNW–SSE oriented maximum AMS axes coincide with the maximum axis of finite strain ellipsoid in the Hornsund–Sørkapp sector of the WSFTB.
The well-grouped maximum AMS axes from site BAU were oriented perpendicular to the bedding plane and are very difficult to interpret (e.g., Rochette et al. Citation1992; Rochette et al. Citation1999; Chadima et al. Citation2006). Considering the local tectonic framework, it is difficult to explain this orientation as a result of local tectonic strain. Inverted magnetic fabrics can also be interpreted as an effect of a specific magnetic mineralogy. There are numerous minerals which could be inverted fabric carriers (e.g., Rochette et al. Citation1992); however, for sedimentary rocks, the most likely are considered to be either single-domain magnetite grains or iron-bearing carbonates, for example, siderite, ankerite and Fe-bearing dolomite (Rochette Citation1988; Ellwood et al. Citation1989). The petro-magnetic studies we carried out did not detect any sign of a high, single-domain, magnetite content in site BAU samples. On the contrary, the results from the BAU site were similar to most of the other sites and indicate that the magnetic susceptibility is mostly controlled by the paramagnetic minerals. We conclude, therefore, that the inverted fabrics observed at site BAU are most probably related to iron-bearing carbonates, the presence of which was detected using the method proposed by Ellwood et al. (Citation1989). We identified siderite to be the carrier of the reverse fabric, but ankerite was also present.
It is evident, however, that the four sites investigated in this study represent an encouraging preliminary approach to establishing the AMS structure in the Hornsund–Sørkapp sector of WSFTB and its possible relations with the finite strain ellipsoids indicated by the structural data reported in the literature. The results described here complement the reported field data and how the onshore WSFTB structures parallel the Svalbard margin, suggesting the imposition of an orthogonal compression. Our data do not, however, lend support to either of the two models mentioned above nor can any comment be made at this preliminary stage of the study regarding the possible partitioning of the tectonic strain.
Conclusions
The results presented in this article allow the following conclusions concerning the magnetic mineralogy and the magnetic properties of the sampled rocks to be drawn.
Although magnetite and magnetic iron sulphides (probably pyrrhotite) are present at all investigated sites, AMS fabric is governed mainly by phyllosilicate minerals, resulting in the presence of normal magnetic fabric. Only at the BAU site with reverse fabric, AMS was related to iron-bearing carbonates, mainly to siderite.
The values of magnetic susceptibility are low and mostly controlled by paramagnetic fractions at most sites, whereas at COND1 the ferromagnetic minerals dominate.
The AMS results were correlated with published strain directions, and at three of the investigated sites we have found AMS axes fitting well to maximum strain directions for the studied sector of the WSFTB. Although the results are preliminary, they show that AMS methods can contribute to tectonic investigations and would support the need for further more in-depth studies of other sectors of the WSFTB.
Acknowledgements
Rock material for this study was collected during palaeomagnetic expeditions of the Institute of Geophysics, Polish Academy of Sciences, to Hornsund in 1999 (KM), 2002 (KM and RS) 2004 (KM and J. Bednarek). This work is partially financed by funds from the Leading National Research Centre (Krajowy Naukowy Ośrodek Wiodący) to the Centre for Polar Studies, Poland, for the period 2014–18, and also partially supported within statutory activities no. 3841/E-41/S/2016 of the Ministry of Science and Higher Education of Poland. We are grateful to reviewers K. Piepjohn and M. Maffione for constructive comments that helped improve the paper.
References
- Andresen A., Bergh S.G., Haremo P. Thunston D.K., Fujita K. Basin inversion and thin-skinned deformation associated with the Tertiary transpressional West Spitsbergen orogen. International Conference on Arctic Margins. Proceedings. OCS Study MMS 94-0040. 1992; Anchorage, AK: US Department of the Interior, Mineral Management Service, Alaska Outer Continental Shelf Region. 161–166.
- Bergh S.G., Braathen A., Andresen A. Interaction of basement-involved and thin- skinned tectonism in the tertiary fold–thrust belt of central Spitsbergen, Svalbard. AAPG Bulletin. 1997; 81: 637–661.
- Bergh S.G., Grogan P. Tertiary structure of the Sørkapp–Hornsund region, south Spitsbergen, and implications for the offshore southern extension of the fold–thrust belt. Norwegian Journal of Geology. 2003; 83: 43–60.
- Birkenmajer K. Nairn A.E.M. The geology of Svalbard, the western part of the Barents Sea, and the continental margin of Scandinavia. The ocean basins and margins. The Arctic Ocean. Vol. 5. 1981; New York: Plenum Press. 265–329.
- Birkenmajer K. Geology of the Hornsund area, Spitsbergen. Geological map 1:75,000, with explanations. 1990; Katowice: Committee on Polar Research, Polish Academy of Sciences, and Silesian University.
- Birkenmajer K., Trammer J. Lower Triassic conodonts from Hornsund, South Spitsbergen. Acta Geologica Polonica. 1975; 25: 299–310.
- Borradaile G.J., Henry B. Tectonic applications of magnetic susceptibility and its anisotropy. Earth-Science Reviews. 1997; 42: 49–93.
- Braathen A., Bergh S.G. Kinematics of Tertiary deformation in the basement-involved fold-thrust complex, western Nordenskiöld Land, Svalbard: tectonic implications based on fault–slip data analysis. Tectonophysics. 1995; 249: 1–29.
- Chadima M., Pruner P., Šlechta S., Grygar T., Hirt A.M. Magnetic fabric variations in Mesozoic black shales, northern Siberia, Russia: possible palaeomagnetic implications. Tectonophysics. 2006; 418: 145–162.
- Dallmann W.K. The structure of the Berzeliustinden area: evidence for thrust wedge tectonics in the Tertiary Spitsbergen fold belt. Polar Research. 1988; 6: 141–154.
- Dallmann W.K. Multiphase tectonic evolution of the Sørkapp–Hornsund mobile zone (Devonian, Carboniferous, Tertiary), Svalbard. Norsk Geologisk Tidsskrift. 1992; 72: 49–66.
- Dallmann W.K., Andresen A., Bergh S.G., Maher H.D. Jr. , Ohta Y. Tertiary fold-and-thrust belt of Spitsbergen, Svalbard. Meddelelser 128. 1993; Oslo: Norwegian Polar Institute.
- Ellwood B.B., Burkart B., Rajeshwar K., Darwin R.L., Neeley R.A., McCall A.B., Long G.J., Buhl M.L., Hickcox C.W. Are the iron carbonate minerals, ankerite, and ferroan dolomite, like siderite, important in palaeomagnetism?. Journal of Geophysical Research—Solid Earth and Planets. 1989; 94: 7321–7331.
- García-Lasanta C., Oliva-Urcia B., Román-Berdiel T., Casas A.M., Gil-Peña I., Sánchez-Moya Y., Sopeña A., Hirt A.M., Mattei M. Evidence for the Permo-Triassic transtensional rifting in the Iberian Range (NE Spain) according to magnetic fabrics results. Tectonophysics. 2015; 651–652: 216–231.
- Harland W.B. The geology of Svalbard. Geological Society Memoir 17. 1997; Oxford: Geological Society of London. 1–521.
- Hosseinpour M., Müller R.D., Williams S.E., Whittaker J.M. Full-fit reconstruction of the Labrador Sea and Baffin Bay. Solid Earth. 2013; 4: 461–479.
- Hrouda F., Janak F. The changes in shape of the magnetic susceptibility ellipsoid during progressive metamorphism and deformation. Tectonophysics. 1976; 34: 135–148.
- Hrouda F., Jelinek V., Zapletal K. Refined technique for susceptibility resolution into ferromagnetic and paramagnetic components bases on susceptibility temperature-variations measurement. Geophysical Journal International. 1997; 129: 715–719.
- Jackson H.R., Gunnarsson K. Reconstructions of the Arctic: mesozoic to present. Tectonophysics. 1990; 173: 303–322.
- Larsen L.M., Heaman L.M., Creaser R.A., Duncan R.A., Frei R., Hutchison M. Tectonomagmatic events during stretching and basin formation in the Labrador Sea and the Davis Strait: evidence from age and composition of Mesozoic to Palaeogene dyke swarms in west Greenland. Journal of the Geological Society. 2009; 166: 999–1012.
- Lee T., Angelier J. Tectonic significance of magnetic susceptibility fabrics in Plio-Quaternary mudstones of southwestern foothills, Taiwan. Earth Planets Space. 2000; 52: 527–538.
- Leever K.A., Gabrielsen R.H., Faleide J.I., Braathen A. A transpressional origin for the West Spitsbergen fold-and-thrust belt: insight from analog modeling. Tectonics. 2011; 30: 1–24.
- Lepvrier C. Drift of Greenland and correlation of Tertiary tectonic events in the West Spitsbergen and Eurekan fold–thrust belts. Polarforschung. 2000; 68: 93–100.
- Louis L., Robion P., David C., Frizon de Lamotte D. Multiscale anisotropy controlled by folding: the example of Chaudrons fold (Corbières, France). Journal of Structural Geology. 2006; 28: 549–560.
- Lowrie W. Identification of ferromagnetic minerals in a rock by coercivity and unblocking temperature properties. Geophysical Research Letters. 1990; 17: 159–162.
- Lyberis N., Manby G.M. The origin of the West Spitsbergen fold belt from geological constraints and plate kinematics—implications for the Arctic. Tectonophysics. 1993a; 224: 371–391.
- Lyberis N., Manby G.M. The West Spitsbergen fold belt: the result of late cretaceous–palaeocene Greenland–Svalbard convergence?. Geological Journal. 1993b; 28: 125–136.
- Maffione M., Fernandez-Moreno C., Ghiglione M., Speranza F., van Hinsbergen D.J.J., Lodolo E. Constraints on deformation of the southern Andes since the Cretaceous from anisotropy of magnetic susceptibility. Tectonophysics. 2015; 665: 236–250.
- Maher H.D. Jr. , Bergh S., Braathen A., Ohta Y. Svartfjella, Eidembukta, and Daudmannsodden lineament: Tertiary orogen-parallel motion in the crystalline hinterland of Spitsbergen's fold–thrust belt. Tectonics. 1997; 16: 88–106.
- Maher H.D. Jr. , Craddock C. Decoupling as an alternate model for transpression during the initial opening of the Norwegian–Greenland Sea. Polar Research. 1988; 6: 137–140.
- Manby G.M., Lyberis N. State of stress and tectonic evolution of the west Spitsbergen fold belt. Tectonophysics. 1996; 267: 1–29.
- Manby G.M., Lyberis N. Tessensohn F. Stress patterns in the West Spitsbergen fold-and-thrust belt. Intra-continental fold belts. Case 1: west Spitsbergen. Geologisches Jahrbuch Reihe B 91. 2001; Stuttgart: Schweizerbart Science Publishers. 381–407.
- Michalski K., Lewandowski M., Manby G. New palaeomagnetic, petrographic and 40Ar/39Ar data to test palaeogeographic reconstructions of Caledonide Svalbard. Geological Magazine. 2012; 149: 696–721.
- Müller R.D., Sdrolias M., Gaina C., Roest W.R. Age, spreading rates, and spreading asymmetry of the world's ocean crust. Geochemistry Geophysics Geosystems. 2008; 9: Q04006. doi: http://dx.doi.org/10.1029/2007GC001743.
- Ohta Y., Dallmann W.K. Geological map of Svalbard 1:100000. Sheet B12G Torellbreen. 1994; Oslo: Norwegian Polar Institute.
- Parés J.M., Van der Pluijm B.A. Evaluating magnetic lineations (AMS) in deformed rocks. Tectonophysics. 2002; 350: 283–298.
- Parés J.M., Van der Pluijm B.A., Dinares-Turell J. Evolution of magnetic fabrics during incipient deformation of mudrocks (Pyrenees, northern Spain). Tectonophysics. 1999; 307: 1–14.
- Poblet J., Lisle R.J. Kinematic evolution and structural styles of fold-and-thrust belts. 2011; London: Geological Society.
- Roberts A.P., Chang L., Rowan C.J., Horng C.-S., Florindo F. Magnetic properties of sedimentary greigite (Fe3S4): an update. Reviews of Geophysics , R. 2011; 49: G1002. doi: http://dx.doi.org/10.1029/2010RG000336.
- Robion P., Grelaud S., Frizon de Lamotte D. Pre-folding magnetic fabrics in fold-and-thrust belts: why the apparent internal deformation of the sedimentary rocks from the Minervois basin (NE–Pyrenees, France) is so high compared to the Potwar basin (SW–Himalaya, Pakistan)?. Sedimentary Geology. 2007; 196: 181–200.
- Rochette P. Inverse magnetic fabric in carbonate-bearing rocks. Earth and Planetary Science Letters. 1988; 90: 229–237.
- Rochette P., Aubourg C., Perrin M. Is this magnetic fabric normal? A review and case studies in volcanic formations. Tectonophysics. 1999; 307: 219–234.
- Rochette P., Jackson M., Aubourg C. Rock magnetism and the interpretation of anisotropy of magnetic susceptibility. Reviews of Geophysics. 1992; 30: 209–226.
- Roest W.R., Srivastava S.P. Sea-floor spreading in the Labrador Sea: a new reconstruction. Geology. 1989; 17: 1000–1003.
- Sagnotti L., Winkler A. Rock magnetism and palaeomagnetism of greigite-bearing mudstones in the Italian peninsula. Earth and Planetary Science Letters. 1999; 165: 67–80.
- Saint-Bezar B., Hebert R.L., Aubourg C., Robion P., Swennen R., Frizon de Lamotte D. Magnetic fabric and petrographic investigation of hematite-bearing sandstones within ramp-related folds: examples from the South Atlas Front (Morocco). Journal of Structural Geology. 2002; 24: 1507–1520.
- Srivastava S.P., Roest W.R. The extent of oceanic crust in the Labrador Sea. Marine and Petroleum Geology. 1999; 16: 65–84.
- Srivastava S.P., Tapscott C.R. Vogt P.R., Tucholke B.E. Plate kinematics of the North Atlantic. Vol. M. The western North Atlantic region. The geology of North America. 1986; Boulder: Geological Society of America. 379–402.
- Tessensohn F. Intra-continental fold belts. Case 1: West Spitsbergen. Geologisches Jahrbuch Reihe B 91. 2001; Stuttgart: Schweizerbart Science Publishers.
- Thiedig F., Manby G.M., Piepjohn K. Tessensohn F. Involvement of the Hornsund high in the fold-belt deformation. Intra-continental fold belts. Case 1: west Spitsbergen. Geologisches Jahrbuch Reihe B 91. 2001; Stuttgart: Schweizerbart Science Publishers. 343–362.
- Vasiliev I., Matenco L., Krijgsman W. The syn- and post-collisional evolution of the Romanian Carpathian foredeep: new constraints from anisotropy of magnetic susceptibility and palaeostress analyses. Tectonophysics. 2009; 473: 457–465.
- Weil A.B., Yonkee A. Anisotropy of magnetic susceptibility in weakly deformed red beds from the Wyoming salient, Sevier thrust belt: relations to layer-parallel shortening and orogenic curvature. Lithosphere. 2009; 1: 235–256.