Abstract
Potential future changes in tropical cyclone (TC) characteristics are among the more serious regional threats of global climate change. Therefore, a better understanding of how anthropogenic climate change may affect TCs and how these changes translate in socio-economic impacts is required. Here, we apply a TC detection and tracking method that was developed for ERA-40 data to time-slice experiments of two atmospheric general circulation models, namely the fifth version of the European Centre model of Hamburg model (MPI, Hamburg, Germany, T213) and the Japan Meteorological Agency/ Meteorological research Institute model (MRI, Tsukuba city, Japan, TL959). For each model, two climate simulations are available: a control simulation for present-day conditions to evaluate the model against observations, and a scenario simulation to assess future changes. The evaluation of the control simulations shows that the number of intense storms is underestimated due to the model resolution. To overcome this deficiency, simulated cyclone intensities are scaled to the best track data leading to a better representation of the TC intensities. Both models project an increased number of major hurricanes and modified trajectories in their scenario simulations. These changes have an effect on the projected loss potentials. However, these state-of-the-art models still yield contradicting results, and therefore they are not yet suitable to provide robust estimates of losses due to uncertainties in simulated hurricane intensity, location and frequency.
1. Introduction
Tropical storms and hurricanes are among the most destructive natural hazards leading to enormous socio-economic impacts, as the example of hurricane Katrina demonstrated in 2005. Over the period 1995–2008, an average of 15 tropical storms, of which eight became hurricanes and four reached major hurricane category (source: National Hurricane Center; http://www.nhc.noaa.gov/2008atlan.shtml) were observed. For comparison, the long-term average season has 11 named storms, six hurricanes and two major hurricanes. At the same time, globally 1996–2006 was the warmest decade within the last 1000 yr (IPCC, Citation2007). This raises the question whether tropical cyclones (TCs) and their characteristics may change in a future, warmer climate and how these changes translate into economic effects.
Less attention was given to the economic impact of the projected changes. To fill this gap, we connect output of general circulation models with a loss model. We base our study on two sets of time-slice experiments – a present-day and a future simulation; one set utilises the fifth version of the European Centre model of Hamburg (ECHAM5 [Bengtsson et al., Citation2007a, 2007b]) and the other one the Japan Meteorological Agency/ Meteorological research Institute (MRI/JMA) atmospheric general circulation model (Mizuta et al., Citation2006; Murakami and Wang, Citation2010; Murakami et al., Citation2011). TCs and hurricanes are determined at the end of the twentieth and twenty-first century using a cyclone tracking and detection method (Kleppek et al., Citation2008). The simulated TCs and their characteristics are then used to estimate the economic impact, i.e. the changes in insured loss potential in the United States. Therefore, the loss model of the Swiss Re is applied to the data, i.e. the simulated TCs drive the hazard module of the loss model. The analysis of two state-of-the-art climate models will enable us to assess, to some extent, the model uncertainties, although the experimental designs of the two models are not identical.
Former empirical studies (e.g. Holland, Citation1997; Emanuel, Citation2005) focus on relevant TC intensification processes as well as on the impact of climate change on TC characteristics. Emanuel (Citation2005) showed a direct relation between the higher sea surface temperatures (SST) and the intensity of TCs. This is further confirmed by several more recent studies showing an increase in the intensity of hurricanes in the last two decades, which is directly related to the increasing SSTs in the tropical Atlantic (Webster et al., Citation2005; Sriver and Huber, Citation2006; Vecchi and Soden, Citation2007). The duration and development of hurricanes depend not only on SSTs, other processes in the atmospheric circulation are important. For instance, Gray (Citation1979) and Frank and Ritchie (Citation2001) suggested that the heat content in the upper layer of the ocean, the static stability, the relative humidity and the vertical wind shear are relevant. The latter argued that increased wind shear weakens storms with time and, as expected, the magnitude of the weakening increases with increasing shear. The reduced number of hurricanes during an El Niño is, amongst other reasons, due to increased vertical wind shear (Pielke and Landsea, Citation1999) and is, e.g. responsible for a relatively weak hurricane season 2006. Nevertheless, the TC activity in the Atlantic Ocean shows an increase since 1995.
Furthermore, numerous model studies show that the number of TCs decrease, whereas their intensity tends to increase in a warmer climate (e.g. Bengtsson et al., Citation1996; Sugi et al., Citation2002; Yoshimura et al., Citation2006; Oouchi et al., Citation2006). Using simulations similar to the ones in this study, Bengtsson et al. (Citation2007a) and Murakami and Wang (Citation2010) confirm these tendencies in TC characteristics. Emanuel et al. (Citation2008) systematically analysed the IPCC AR4 simulations using a downscaling approach (Emanuel, Citation2006; Emanuel et al., Citation2006), showing a general agreement with the former findings. However, they also report a large model-to-model variability suggesting an inherently large uncertainty in such projections. Gutowski et al. (Citation2008) showed that in particular the higher resolved models consistently simulate fewer TCs in the future, whereas lower resolved models indicate essentially no change. Comparing new model simulations, Knutson et al. (Citation2010) reported that models consistently project stronger storms and less TCs at the end of the twenty-first century. Recently, Bender et al. (Citation2010) have confirmed these changes for the Atlantic utilising a dynamical downscaling approach. Thus, model simulations for future climate evolution tend to converge on a future decrease in number of TCs and an accompanying increase in intensity (Kerr, Citation2010).
The article is organised as follows. The model data and methods are explained in Section 2. In Section 3, the model's ability to simulate TCs is presented. The used scaling technique to obtain realistic TC intensities is explained in Section 4. The TC characteristics in the control (CTRL) and scenario simulations are compared in Section 5 and the impact on the associated losses is presented in Section 6. Finally, a brief summary and some conclusions are provided in Section 7.
2. Data and methods
The study is based on model simulations and the HURDAT best track data. Two AGCMs are used here: The ECHAM5 is a global spectral AGCM based on the primitive equations (Roeckner et al., Citation2003). The horizontal resolution is T213, corresponding to a longitude–latitude grid of approximately 0.5625°×0.5625° and 31 hybrid sigma-pressure levels in the vertical with the uppermost level at 10 hPa. As for the best track data, the time resolution of the simulated data for ECHAM5 is 6 hours.
The second model, the 20 km-MESH JMA and MRI AGCM, is a climate model version of an operational global model for short-term numerical weather prediction of the JMA and will be part of the next generation climate models for long-term climate simulation at the MRI. The simulations were performed at a triangular truncation 959 with linear horizontal Gaussian grid (TL959), corresponding to a grid size of approximately 20 km, and 60 vertical levels with the model top at 0.1 hPa. Six-hourly data were available only from 45 °S to 45 °N. Details of the model and the experiments are described in Mizuta et al. (Citation2006) and future changes of North Pacific typhoons are assessed by Murakami et al. (Citation2011).
Two time-slice simulations of both models, namely, a CTRL simulation for present day climate conditions and future scenario simulation (SCEN), are available. For ECHAM5, the CTRL simulation spans the period 1959–1990 forced with observed SSTs and sea ice concentrations from the HadISST dataset (Rayner et al., Citation2006), the observed CO2 concentrations, other well-mixed greenhouse gases and ozone. The second time-slice simulation of ECHAM5 covers the period 2069–2100 and is forced with the IPCC SRES A2 scenario (IPCC, Citation2001). Therefore, SSTs and sea ice from a simulation generated with the lower resolved (T63) coupled ECHAM5/MPIOM (IPCC, Citation2007) are interpolated to the higher resolution of T213 and then applied as lower boundary conditions. Details of the experimental setup are described in Bengtsson et al. (2007a, 2007b).
The MRI/JMA model uses a perpetual 1990 AD simulation as reference. This simulation is performed for 22 yr using observed climatological SSTs and sea ice concentrations from the HadISST dataset (Rayner et al., Citation2006). As scenario, SRES A1B is selected and the period ‘end of twenty-first century’ is simulated using observed climatological SSTs plus MRI-CGCM2 SST anomalies. These anomalies are the differences between the future (average over 2080–2099) and the present (average over 1979–1998). The CO2 concentration is nearly doubled around the 1999–2080 period. The concentrations of greenhouse gases and aerosols are taken from the year 2090 of the A1B scenario (Oouchi et al., Citation2006; Murakami et al., Citation2011).
For the analysis, we ignore the first year of all model simulations to avoid impacts arising from adjustments to discrepancies of the initial conditions and the model's own state. Note that the experimental setups are different with respect to the SST forcing (time varying vs. climatological) and scenario (A2 vs. A1B), i.e. a comparison will not only include uncertainties related to the model but also, to some extent, to the experimental design. Nevertheless, the future scenarios are comparable in the sense that the multimodel global mean temperature response under the A1B scenario is roughly 2.7 K for the period 2080–2100 and 3 K for the period 2070–2100 using the A2 (IPCC, Citation2007). Note that the temperature response of the ECHAM5 simulations is roughly 3 K and the response of MRI/JMA 2.5 K.
To evaluate the model simulations and to correct for an important model deficiency, i.e. the underestimation of hurricane intensity (see Section 4), we use the HURDAT Best Track data set (‘best tracks’ hereafter) for the Atlantic basin from the US National Hurricane Center. The dataset contains the zonal and meridional position of the cyclone centre, the date and time (UTC), the maximum sustained wind speed (kt) and the central pressure (hPa) every 6 hours. The accuracy of the data has changed since the mid 1970s due to better monitoring facilities (Landsea, Citation1993; Dunion and Velden, Citation2004; Landsea et al., Citation2010). In particular, the central pressure reportings are scarce before to the mid-1970s. As wind speed estimates are always available, these missing values are estimated by linear regression of maximum sustained wind speed and central pressure. The best track hurricanes are classified using the Saffir–Simpson category (‘SScat’ hereafter) based on central pressure (). To evaluate the model simulations, two reference periods are selected: 1960–1990 for ECHAM5 and 1970–1990 for the MRI/JMA model. To correct the intensity of the hurricanes, we use the period 1960–2005 as reference.
Table 1. Classification of hurricanes using the categories of the Saffir–Simpson (SScat) based on central pressure
To investigate the model simulation, a TCs tracking and detection method is applied to 6-hourly model output (Kleppek et al., Citation2008). The method is based on detection and tracking of mid-latitude cyclones developed by Blender et al. (Citation1997), Raible and Blender (Citation2004) and Raible (Citation2007). It combines sea level pressure (SLP), 850-hPa relative vorticity and wind speed to identify TCs. First, the method identifies a local minimum of SLP (within a neighbourhood of eight grid points) and a maximum in the 850-hPa relative vorticity. Then, only centres where the magnitude of the 850-hPa relative vorticity exceeds 5.0×10⁻⁵ s−1 are used in the detection part of the method. Over land, the horizontal wind speed at 850 hPa is additionally employed, i.e. either the 850-hPa relative vorticity condition is fulfilled or the 850-hPa wind speed has a maximum in the ambient area of roughly 250 km around the identified TC-centre. As in the standard method (Raible, Citation2007), the TC centres are connected by a next-neighbourhood search and the minimum life time is set to 36 hours. A detailed description of the method, its application to reanalysis data and justification of the selected thresholds are given in Kleppek et al. (Citation2008). As for the best track, the identified hurricanes are classified using the SScat based on central pressure ().
To analyse the insured losses in the United States, the Swiss Re loss model is applied to the best track data and the model output. The Swiss Re loss model is a state-of-the-art loss model used to do the costing of all property reinsurance contracts written in the United States. It has been extensively tested in operation over the last years. The fact that this study replaces the hazard module of the loss model and that an aggregated US market portfolio is used does not weaken the representation of the loss potentials in relative terms. The loss model follows a four-box concept linking the hazardous winds with an estimated industry market portfolio (state June 2007) and insurance structure. The vulnerability module is not fully exhausted because the market portfolio is aggregated to ZIP level, but the model is built to consider portfolios given at different granularity. To prepare a hazard set compatible with the Swiss Re loss model and also comparable to the existing operational hazard set, the main ingredient is hurricane tracks. The tracks are chains of nodes whereon central pressure, geographical coordinates, forward speed and further attributes are provided. Because of the sparse occurrence of strong and land-falling TCs, the historical event set needs to be enriched with probabilistic events. The same enrichment is needed for the tracks identified from the climate model runs as they simulate a limited time period. For the sake of consistency, the same functions creating probabilistic events are applied on the historical TCs as for the TCs identified in the climate model runs. The methodology of these functions is to randomly perturb the observed or simulated tracks in their attributes, with the goal to cover all uncertainties on the storm track geometries, pressure evolution and storm width. The perturbations are of a magnitude, which cannot change the climatology of a hazard set at the regional scale, but can fill historical ‘gaps’ at landfall (from a loss perspective TCs have a strong hit-or-miss character).
In a consecutive step of the loss model, the wind field of the storm is simulated at each node of all tracks. Each probabilistic storm track performs a free run under constraints of a regional climatology and being partially steered by its original track (from which it was derived/perturbed). Because of this free run, the storm decay at landfall needs to be parameterised individually (Holland, Citation1980; Vickery et al., Citation2009). Then, the loss model employs a representative vulnerability curve depending on the risk types associated in the portfolio at allocations in the United States. The vulnerability curves were derived for the Swiss Re model using historical loss data and published damage curves. Expert engineering know-how was used where loss data are too scarce to judge relative vulnerabilities.
The Swiss Re cat loss model is built to consider all known insurance conditions and structures in the best possible way, using the in-house market expertise. The fact that the market portfolio is in an aggregated format is not considered critical for the estimate of changes in loss frequencies. Note that an earlier version of the loss model was already applied in a study of European storms by Schwierz et al. (2009), where a detailed description of the loss model basics at that time was also presented.
3. Representation of TCs in ECHAM5 and MRI/JMA CTRL simulations
To assess the model's ability in simulating TC characteristics, the CTRL simulations of both models are compared with the best track data for the hurricane season June to November. With the aid of the tracking method (Kleppek et al., Citation2008), the investigations encompass TC tracks, density of the TCs and TC intensity (central pressure) in the North Atlantic, in particular those which make landfall at the US coast.
Overall, the tracks of the ECHAM5 CTRL simulation agree with the best tracks of the period 1960–1990 (a,b). However, some deviations are evident in the difference pattern of cyclone centre density (a). In contrast to the best tracks, the simulated TCs tend to develop already over North Africa and lead to an overestimation of TCs West of the North African Coast. This is a model deficiency, as already shown and discussed by Bengtsson et al. (Citation2007b) who analysed similar simulations with respect to TCs. A second major difference is that TC tracks over land are not as well represented in the ECHAM5 model as in the best tracks (a,b and 2a). The reason for this arises from the fact that the TCs are less intense and therefore the low-pressure systems could be filled faster over land due to an increase in roughness and less latent energy supply. Although the cyclone centre density is underestimated, the total number of the TCs (a) is overestimated compared with the best tracks because tracks of mainly weak TCs are split into two. This could happen when no local pressure minimum or 850-hPa vorticity maximum exceeding the threshold (see Section 2) could be identified in one time step of a TC. Thus, the total number of tracks of SScat 1 is strongly overestimated. Note that such a splitting of tracks was already found when analysing ERA-40 reanalysis data with the same cyclone detection and tracking method (Kleppek et al., Citation2008).
Fig. 1. Tracks and intensities of (a) best tracks (1960–1990), (b) CTRL simulation of ECHAM5, (c) SCEN simulation of ECHAM5, (d) best tracks (1970–1990), (e) CTRL simulation of MRI/JMA and (f) SCEN simulation of MRI/JMA. The colours indicate the Saffir–Simpson categories (SScat).
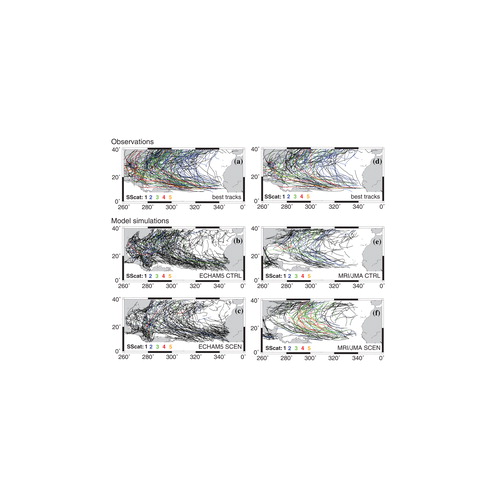
Fig. 2. Mean difference of cyclone centre density (Number/(1000 km)2) between (a) ECHAM5 CTRL simulation and best track data for the period 1960–1990, (b) MRI/LMA CTRL simulation using 21 yr and best track data for the period 1970–1990, (c) ECHAM5 A2 SCEN and its CTRL simulation and (d) MRI/JMA A1B SCEN and its CTRL simulation.
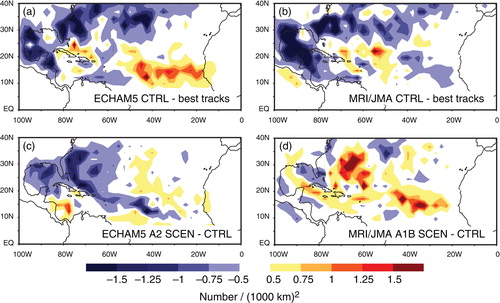
Fig. 3. Absolute numbers of tracks of SScat 1–5 in comparison with best tracks: (a) best tracks (1960–1990) and tracks of ECHAM5 CTRL (1960–1990) and SCEN A2 simulation (2070–2100) and (b) best tracks (1970–1990) and tracks of MRI/JMA CTRL (21 yr present-day) and SCEN A1B simulation (21 yr end of the twenty-first century).
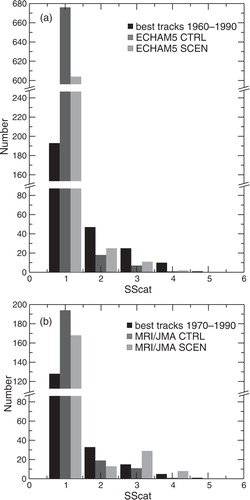
Another relevant deficiency is that the simulated TC intensities are too low (a). The simulated hurricanes of SScat 2-5 are strongly underestimated compared to best track. The weak TC intensities, i.e. unrealistic high values of the central pressures, are due to the relatively coarse resolution of the ECHAM5 model. Still, the seasonality of the intensity, with weaker TCs in June, October and November and more intense TCs in July to September is captured fairly well by ECHAM5 in the CTRL simulation (not shown).
The distribution of tracks in the CTRL simulation of the MRI/JMA model (e) exhibits stronger deviations to the best tracks (1970–1990, d) than the ECHAM5 simulation. There are less TCs particularly over the Gulf of Mexico, and track occurrence over the genesis area West of the North African Coast is underestimated. These deviations are also evident in the difference pattern of the cyclone centre density (b). Moreover, the TCs show a tendency to steer to the North too early (e), which is partly due to the fact that the strength of the subtropical ridge is slightly underestimated by the MRI/JMA model (not shown). Another reason for the ‘too early’ recurvature may be the SST forcing used for the CTRL simulation of the MRI/JMA model. Vecchi and Soden (Citation2007) showed that SST anomalies are important for the TC formation. In the CTRL and SCEN simulation of the MRI/JMA model, the same climatological SST anomaly is used for every year and month, without inter-annual variations. Thus, the use of the climatological SSTs probably deteriorates the real TC density. As for the ECHAM5, the CTRL simulation of the MRI/JMA model overestimates the total number of cyclones due to multiple counts of split tracks leading to a strong increase in SScat 1 TCs (b).
The intensity of the TCs is slightly better represented in the MRI/JMA model compared with ECHAM5, due to the higher horizontal resolution. As a result, more hurricanes of SScat 2–5 are found (b). The number of TCs of SScat 2 and 3 are more realistically simulated than for the ECHAM5 CTRL simulation, whereas hurricanes with intensity of SScat 4–5 are highly underestimated or not even simulated compared with the best tracks. The reason is the more insufficient cumulus parameterisation scheme than the resolution, as mentioned in Oouchi et al. (Citation2006). The MRI/JMA model also reproduces the seasonal cycle of the TC intensity fairly well (not shown).
4. Scaling of TC intensities
The previous section showed that the TC intensities are strongly underestimated in the CTRL simulations of both AGCMs (a,b). However, a realistic representation of the intensity and its distribution is essential to estimate losses.
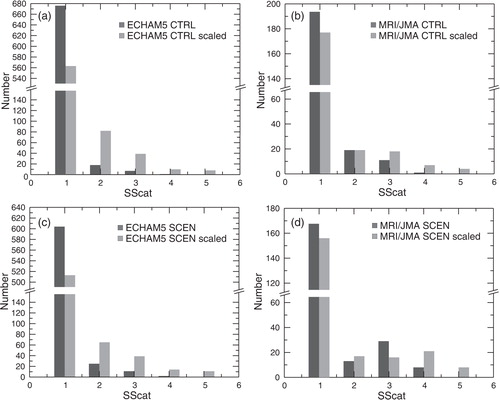
To overcome this problem, we apply a scaling approach to the data, which is based on the cumulative density functions (CDFs). For the best track data and the CTRL simulations, the CDFs of the central pressure are estimated. The CDF of the best track is based on the period 1960–2005, whereas the CTRL simulations are based on their 31- and 21-year periods, respectively. The robustness of the CDF of the best track data is tested by estimating CDFs for different periods (pre- and satellite era, different 31-year and 21-year periods). The deviations between the different best track CDFs are small (not shown). Only if the period is dominated by the years 1960–1970, the CDF underestimates the extreme intensity. As mentioned above, the data quality is reduced in this period, and the missing central pressure values have to be filled by regressed maximum sustained wind speed. To avoid potential problems arising from the lower data quality, the best track CDF is based on the extended period 1960–2005. After the estimation of the CDFs, a linear correction function between the observed and simulated CDFs is fitted and used to determine the new scaled central pressures of the CTRL simulations (Kleppek et al., Citation2008). As this scaling approach is crucial for further analysis, in particular for the loss estimation, the scaling is repeated with best track CDFs based on different periods of 31- and 21-year length. Again, the impact of the selected period is small (not shown). The seasonality of the intensity, represented by the central pressure, is not taken into account because both models are able to realistically show the seasonal cycle of central pressure values of TCs. Finally, the same correction functions estimated from the CTRL simulations are used to downscale the scenario simulations in the second part of this study.
As a result of the scaling approach, c,d illustrates that both scaled CDFs of the central pressures of the CTRL simulations generally agree reasonably well with the one of the best track data. The remaining discrepancies are that the ECHAM5 CTRL simulation slightly overestimates the scaled central pressures lower than 940 hPa, whereas the MRI/JMA CTRL simulation shows small underestimation of the scaled extreme low central pressures.
Fig. 4. The cumulative density functions of the central pressures of best tracks and (a) ECHAM5 tracks, (b) MRI/JMA tracks, (c) scaled ECHAM5 tracks and (d) scaled MRI/JMA tracks.
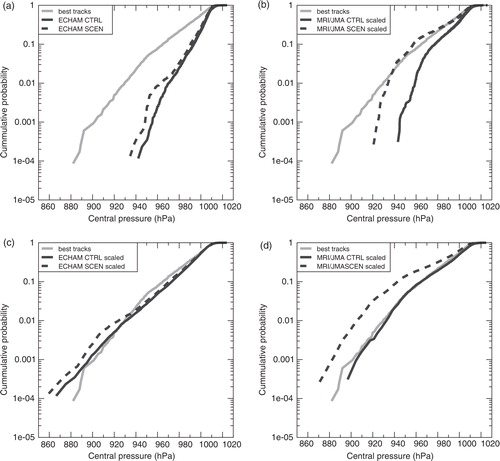
Applying the scaling of the central pressures to the simulated data leads to more intense TCs in the CTRL simulations (). The areas where the most intense TCs are simulated are similar to the observed areas (a,b). Hurricanes of SScat 5 are found in both CTRL simulations after applying the scaling approach (a,b). As the scaling leads to an overestimation of central pressures lower than 940 hPa, the absolute number of ECHAM5 TCs increases more than that for the MRI/JMA model. However, one should keep in mind that the ECHAM5 have showed a stronger underestimation in their raw version than the MRI/JMA model.
Fig. 5. As Fig. 1, but for the scaled data, i.e. the same trajectories but different intensities due to scaling.
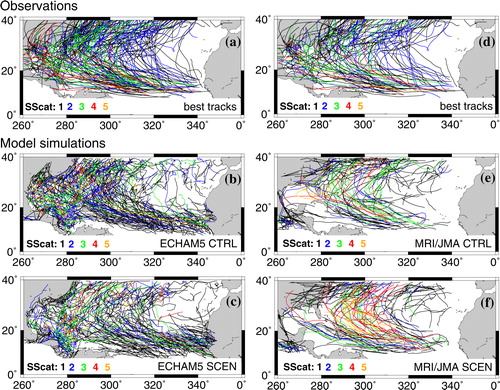
Fig. 6. Absolute numbers of tracks with SScat 1–5 before and after scaling: (a) ECHAM5 CTRL, (b) MRI/JMA CTRL, (c) ECHAM5 SCEN and (d) MRI/JMA SCEN. The histogram is based on 31 yr for ECHAM5 and on 21 yr for MRI/JMA. Note that the y-axis is different in the upper part of the panels.
In addition to the absolute number of the TCs, the time behaviour is of interest (not shown). After applying the scaling approach, the inter-annual variability is similar between the CTRL simulations and the best track data, in particular for hurricanes of SScat 2–5.
5. TC changes in future scenarios
To assess the changes in future climate scenarios, we will focus on the total number, intensity, density and position of the TCs. Overall, a decrease in the total number of cyclones is projected for the future (), which is consistent for both models, although more pronounced for the ECHAM5 than for the MRI/JMA simulations. This result resembles previous findings (IPCC, Citation2007; Bengtsson et al., Citation2007a; Bender et al., Citation2010; Knutson et al., Citation2010; Murakami and Wang, Citation2010). This decrease is not uniform over the area.
The difference pattern of cyclone centre density (c) shows that cyclones decrease over the Gulf of Mexico and Texas in the scenario simulation of ECHAM5. Moreover, less TCs are found over the Sargasso Sea under warmer climate conditions in ECHAM5. Interestingly, extending the season from May to December, we find for the ECHAM5 simulation an increase in TCs in the May and December months (not shown).
A small reduction of the total number of cyclones is also simulated by the MRI/JMA SCEN simulation (b). Additionally, the MRI/JMA model SCEN simulation shows that the TCs steer to northward directions in the scenario simulation even earlier compared with the CTRL simulation (e,f). In contrast to the ECHAM5, a significant change in the number of cyclones in the edge months May and December, however, is not found in the MRI/JMA model for the future scenario simulation.
Although the total number of TCs decreases in the future, the intensity of the hurricanes increases. In , the absolute numbers of the hurricanes of SScat 1–5 are determined after the scaling of the central pressures. More major hurricanes are found in the ECHAM5 SCEN simulation than in the CTRL simulation. This is in agreement with the MRI/JMA SCEN simulation; the difference between projection and CTRL is even larger than in the ECHAM5 model. To give an example, the number of hurricanes of SScat 5 simulated by the MRI/JMA is nearly doubled in the SCEN simulation (b,d). The ECHAM5 SCEN simulation exhibits a substantial increase in the central pressure values below 940 hPa (c), which are exactly the intensities responsible for major hurricanes of SScat 4–5 (c).
6. Estimated insurance losses
Assessing climate change impacts requires knowledge about changes in more than one characteristic of hurricanes, i.e. location, intensity and frequency ( and ). To estimate insured losses, knowledge about potential future changes of the landfall of TCs is crucial because most of the losses occur over land. In the following, we investigate the US loss potential in the future by applying the Swiss Re's proprietary operational loss model to the scaled TCs identified in the ECHAM5 and MRI/JMA model simulations, respectively.
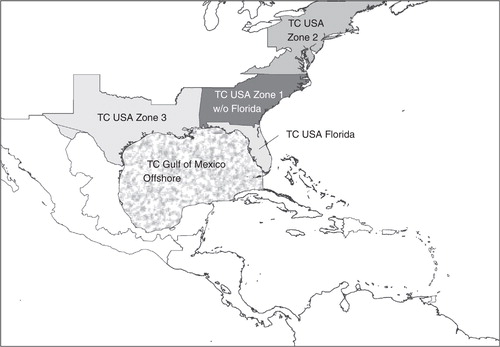
To obtain regional insight, the loss model is applied to the entire United States and to selected rating zones, such as the single US State of Florida, a region comprising the states along the northeastern coast (rating zone 1), and a region that covers Virginia to Maine (rating zone 2). These rating zones are defined from an actuarial insurance perspective (). To compare the insured losses, the loss frequency curves (LFCs) for the present-day and future climate are calculated.
Fig. 7. Map of rating zones in the United States (source: Swiss Re modified for this study). TC denotes tropical cyclone.
For the entire United States, we find individual biases for each of the CTRL simulations (a). The ECHAM5 CTRL simulation generally overestimates the insured losses, e.g. the observed 20-year event becomes an 11-year event in the CTRL simulation. The reason for this overestimation is that intense hurricanes (of SScat 4–5) become more frequent due to the applied scaling (c), although the TCs making landfall are reduced. The CTRL simulation of the MRI/JMA model behaves differently in that it underestimates insured losses for events with return periods up to approximately 70 yr. To give an example, the observed 20-year event is simulated as a 30-year event in the CTRL simulation of the MRI/JMA model. As the scaling approach delivers a good representation of the intensities, the underestimation of the losses arises from the reduction of hurricanes making landfall.
Fig. 8. Loss frequency curves of (a) the United States (b) Florida, (c) zone 1 and (d) zone 2 for best track data, the CTRL and SCEN (A2 for ECHAM5 and A1B for MIR/JMA) simulations of both model simulations, respectively.
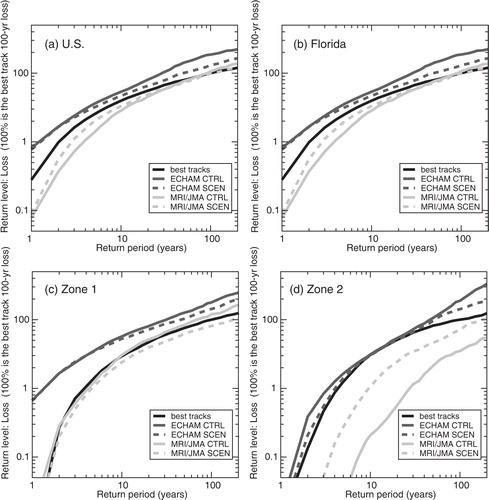
For the entire United States and the individual rating zones, the results of the ECHAM5 CTRL simulation are similar, i.e. a consistent overestimation of the insured losses (b–d). In contrast, the MRI/JMA CTRL simulation shows biases of the LFCs that vary from region to region. The biases for the rating zone Florida and zone 2 are similar to the entire United States, but for insured losses in zone 1 no bias is found. Thus, the behaviour of the LFC for the entire United States seems to be dominated by the rating zone Florida and zone 2, which in turn sensitively react to the bias of the cyclone tracks, i.e. a too early recurvature (see Section 3).
Keeping in mind these biases, the projected future changes of the LFCs are discussed starting with the implications for the entire United States (a). The LFC of the ECHAM5 A2 scenario simulation is below the LFC of its CTRL simulation for events with return periods of more than 4 yr. This means that, e.g. a 20-year event in the CTRL simulation becomes a 32-year event in the A2 SCEN simulation, or an 80-year event in the CTRL simulation becomes a 110-year event in the SCEN simulation. Here, a further reduction of hurricanes making landfall is the reason explaining the less frequent extreme loss events in the SCEN simulation. This is in contrast to the LFCs of the MRI/JMA model that shows the reverse behaviour for the entire U.S. A 5-year event simulated by the MRI/JMA CTRL simulation becomes a 3-year event in the future, a 10-year event becomes an 8-year event and for really rare events (return periods longer than 70 yr) the LFCs of the CTRL and the A1b scenario simulations show nearly no difference. One reason for the different behaviour of the MRI/JMA model is the less-pronounced future changes of the trajectories. Together with a general intensification of the hurricanes, the MRI/JMA model simulates more frequently occurring extreme loss events for the future.
To gain further insight, the rating zones of the United States are investigated (b–d). For the rating zones (b–d), the ECHAM5 LFCs show a similar behaviour as for the United States. This is expected as in all rating zones, the hurricanes that make landfall are substantially reduced. The regional behaviour of the LFCs of the MRI/JMA model shows that the projected increase in frequency for the entire United States is mainly due to the changes in the rating zone Florida and zone 2, respectively (b,c). In particular over zone 2, a 10-year event in the CTRL simulation becomes a 4.5-year event in the A1b scenario simulation of the MRI/JMA model. This again could be explained by the effect of the general intensification and that TCs steer earlier to the North, which leads to less frequent extreme loss events in zone 1, but slightly more hurricanes over zone 2.
In summary, the two models show contradicting results for the insured losses. For the entire United States, the ECHAM5 model projects lower LFCs for future climate conditions, whereas the MRI/JMA model shows an increase in loss potentials. As expected, differences increase on regional scales. These differences rather express the uncertainties given by the landfalls of the used model, as both models show a general intensification of the hurricanes.
7. Discussion and conclusions
This study combines observational and modelled data with an empirical loss model to assess the impact of future climate change on hurricane characteristics and associated insurance losses in the North Atlantic. The results illustrate that it is still not possible to use simulated hurricane characteristics for insurance loss estimates, although the models are highly resolved (approximately 20 km and 50 km grid resolution, respectively). Such resolutions are apparently still too coarse to detect hurricanes of SScat 5, and the number of hurricanes of SScat 2–4 is underestimated. For the ECHAM5 model, the resolution is the major problem, whereas the underestimation of the MRI/JMA model is mainly attributed to the insufficient cumulus parametrisation scheme (Oouchi et al., Citation2006).
To overcome the model deficiency of underestimating the intensity, we have scaled the simulated central pressure values to observations (best track data) by utilising linear correction functions between the CDFs of the central pressure. As the shape of the CDFs remains unchanged, effects of small-scale physical processes, which may influence the TC characteristics and their sensitivity, cannot be accounted for. Besides this, the same correction functions are also used to scale the results of the future scenarios. Thus, any changes in the relationship between the CTRL and SCEN simulations are ignored by this crude assumption. An application of the more rigorous methods of Emanuel (Citation2006), developed for coarser resolved model simulations, is not necessary as our simulations are able to generate realistic TC tracks. Thus, the statistical approach suggested in our study seems to be sufficient to correct for the underestimated TC intensity.
The geographical distribution of the hurricane tracks in the ECHAM5 CTRL simulation is in good agreement with the best track data. The largest differences are a shorter life time over land, caused by the relatively coarse resolution, and an earlier development already over the African continent. The tracks of the MRI/JMA CTRL simulation are well represented over the ocean, but the number of TCs is underestimated over the Gulf of Mexico and over the US East coast. Even though not the main scope of this article, possible reasons for the underestimation may lie in a less-pronounced subtropical ridge and the climatological SST forcing, diminishing the effect of time varying SST anomalies that are known to be important for the TC formation (Vecchi and Soden, Citation2007).
Assessing the future impact, our results agree with former findings of both models (Bengtsson et al., Citation2007a; Murakami and Wang, Citation2010) projecting a decrease in the number of tracks in the future. Clearly, the decrease in the number of hurricanes is not uniform: ECHAM5 shows a decrease in the TCs around the US coast line, whereas the TCs simulated for the future by the MRI/JMA model are shifted to the East, i.e. they travel more frequently over the ocean due to a premature recurvature. In contrast to the number, the intensity of the major hurricanes increases in the future, again in agreement with Bengtsson et al. (Citation2007a) and Murakami and Wang (Citation2010) and other model simulations (Emanuel et al., Citation2008; Bender et al., Citation2010; Knutson et al., Citation2010), in particular those of similar high resolution (Gutowski et al., Citation2008). Besides this, the ECHAM5 model shows a tendency to an extended hurricane season in the future scenario, similar to the findings of Kossin (Citation2008).
The simulated changes of the TC characteristics have an impact on losses, as illustrated by the LFCs for the United States and for single regions (rating zones) calculated with the Swiss Re loss model. The ECHAM5 simulates a decrease in insured losses in the future for the entire United States and all rating zones. Thus, although the number of major hurricanes increases, the insured losses do not increase in the United States, reflecting to some extent the changes in track density over the region. However, the MRI/JMA AGCM exhibits an increase in insured losses in the future LFC for the United States with the exception of rating zone 1, again being dominated by weaker changes of the trajectories in conjunction with a general intensification. Although the two AGCMs are not fully comparable due to differences in the model setup, they still illustrate that current state-of-the-art models do not yet permit robust conclusions illustrating the limits of our analysis.
In conclusion, it is necessary to analyse different model simulations in US regions to assess the uncertainty of future changes. Based on our study, a conclusive statement about future loss potentials in the Eastern US cannot be drawn. The study, therefore, demonstrates and highlights the current limitations of the use of scenario simulations based on state-of-the-art, high-resolution global models as input for insurance loss models.
8. Acknowledgements
The authors would like to thank the MPI Hamburg, in particular Monika Esch, Lennart Bengtsson and Uwe Schulzweida for making the ECHAM5 time-slice experiments available for this study. The time-slice experiments of the MRI/JMI model were conducted under the framework of the ‘Projection of the change in future weather extremes using super-high-resolution atmospheric models’ supported by the KAKUSHIN program of the Ministry of Education, Culture, Sports and Technology. The calculations were performed on the Earth Simulator. The work of this article is supported by the National Centre for Competence in Research (NCCR) in Climate funded by the Swiss National Science Foundation. Resources from the Swiss National Supercomputing Centre (CSCS) are acknowledged. Moreover, the authors are pleased for the helpful comments by the two anonymous reviewers.
Related Research Data
References
- Bender, M. A, Knutson, T. R, Tuleya, R. E, Sirutis, J. J, Vecchi, G. A and co-authors. 2010. Modeled impact of anthropogenic warming on the frequency of intense Atlantic hurricanes. Science. 48, 57–73.
- Bengtsson L. Botzet M. Esch M. Will greenhouse gas-induced warming over the next 50 years lead to higher frequency and greater intensity of hurricanes?. Tellus A. 1996; 48: 57–73.
- Bengtsson L. Hodges K. Esch M. Tropical cyclones in a T159 resolution global climate model: comparison with observations and re-analyses. Tellus. 2007a; 59(4): 396–416.
- Bengtsson, L, Hodges, K, Esch, M, Keenlyside, N, Kornblueh, L. co-authors. 2007b. How may tropical cyclones change in a warmer climate?. Tellus A. 59(4), 539–561.
- Blender R. Fraedrich K. Lunkeit F. Identification of cyclone-track regimes in the North Atlantic. Quart. J. Roy. Meteor. Soc. 1997; 123: 727–741.
- Dunion J. P. Velden C. S. The impact of the Saharan air layer on Atlantic tropical cyclone activity. Bull. Am. Meteor. Soc. 2004; 85: 353–365.
- Emanuel K. Increasing destructiveness of tropical cyclones over the past 30 years. Nature. 2005; 436(7051): 686–688.
- Emanuel K. Climate and tropical cyclone activity: a new model downscaling approach. J Climate. 2006; 19: 4797–4802.
- Emanuel K. Ravela S. Vivant E. Risi C. A statistical deterministic approach to hurricane risk assessment. Bull. Am. Meteor. Soc. 2006; 87: 299–314.
- Emanuel K. Sundararajan R. Williams J. Hurricanes and global warming – results from downscaling IPCC AR4 simulations. Bull. Am. Meteor. Soc. 2008; 89: 347–367.
- Frank W. Ritchie E. Effects of vertical wind shear on the intensity and structure of numerically simulated hurricanes. Mon. Wea. Rev. 2001; 129(9): 2249–2269.
- Gray, W. M. 1979. Hurricanes: their formation, structure and likely role in the general circulation. In: Meteorology over the Tropical Oceans. (ed. D. B. Shaw). Royal Meteorological Society. 155–218.
- Gutowski, W. J, Hegerl, G. C, Holland, G. J, Knutson, T. R, Mearns, L. O. co-authors. 2008. Causes of observed changes in extremes and projections of future changes. In: CCSP 3.3 Report 725 ‘Weather and Climate Extremes in a Changing Climate’. (eds. T. R. Karl, G. A. Meehl, C. D. Miller, S. J. Hassol, A. M. Waple, and W. L. Murray), Global Change Research Information Office:: WashingtonDC, 80–116.
- Holland G. J. An analytic model of the wind and pressure profiles in hurricanes. Mon. Wea. Rev. 1980; 108: 1212 –1218.
- Holland G. J. The maximum potential intensity of tropical cyclones. J. Atmos. Sci. 1997; 54(21): 2519–2541.
- IPCC. 2001. Climate Change 2001: The Scientific Basis. CambridgeUK and New York, NY, USA: Cambridge University Press. Contribution of Working Group I to the Third Assessment Report of the Intergovenmental Panel on Climate Change, 881pp.
- IPCC. 2007. Climate Change 2007: The Scientific Basis. Contribution of Working Group I to the Fourth Assessment Report of the Intergovernmental Panel on Climate Change. (S. Solomon, et al.), Cambridge University Press: New York
- Kerr R. A. Models forsee more-intense hurricanes in the Greenhouse. Science. 2010; 327: 399.
- Kleppek, S, Muccione, V, Raible, C. C, Bresch, D, Koellner-Heck, P. co-authors. 2008. Tropical cyclones in ERA-40: a detection and tracking method. Geophys. Res. Lett. 35(10), L10705 (5 pp.)
- Knutson, T. R, McBride, J. L, Chan, J, Emanuel, K, Holland, G. co-authors. 2010. Tropical cyclones and climate change. Nat. Geosci. 3(3), 157–163.
- Kossin J. P. Is the North Atlantic hurricane season getting longer?. Geophys. Res. Lett. 2008; 35(23): L23705.
- Landsea C. W. A climatology of intense (or major) Atlantic hurricanes. Mon. Weather Rev. 1993; 121(6): 1703–1713.
- Landsea C. W. Vecchi G. A. Bengtsson L. Knutson T. R. Impact of duration thresholds on Atlantic tropical cyclone counts. J. Climate. 2010; 23(10): 2508–2519.
- Mizuta, R, Oouchi, K, Yoshimura, H, Noda, A, Katayama, K. co-authors. 2006. 20-km-Mesh global climate simulations using JMA-GSM model – mean climate states. J. Meteor. Soc. Japan. 84(1), 165–185.
- Murakami H. Wang B. Future change of North Atlantic tropical cyclone tracks: projection by a 20-km-Mesh global atmospheric model. J. Climate. 2010; 23(10): 2699–2721.
- Murakami H. Wang B. Kitoh A. Future change of western North Pacific typhoons: projection by a 20-km-Mesh global atmospheric model. J. Climate. 2011; 24: 1154–1169.
- Oouchi, K, Yoshimura, J, Yoshimura, H, Mizuta, R, Kusunoki, S. co-authors. 2006. Tropical cyclone climatology in a global-warming climate as simulated in a 20 km-mesh global atmospheric model: frequency and wind intensity analyses. J. Meteor. Soc. Japan. 84(2), 259–276.
- Pielke R. Landsea C. La Niña, El Niño, and Atlantic hurricane damages in the United States. Bull. Am. Meteor. Soc. 1999; 80(10): 2027–2033.
- Raible, C. C. 2007. On the relation between extremes of midlatitude cyclones and the atmospheric circulation using ERA40. Geophys. Res. Lett. 34, L07703. 10.3402/tellusa.v64i0.15672.
- Raible, C. C and Blender R. 2004. Midlatitude cyclonic variability in GCM-simulations with different ocean representations. Clim. Dyn. 20. 10.3402/tellusa.v64i0.15672.
- Rayner, N, Brohan, P, Parker, D, Folland, C, Kennedy, J. co-authors. 2006. Improved analyses of changes and uncertainties in sea surface temperature measured in situ sice the mid-nineteenth century: the HadSST2 dataset. J. Climate. 19(3), 446–469.
- Roeckner, E, Bäuml, G, Bonaventura, L, Brokopf, R, Esch, M. co-authors. 2003. The atmospheric general circulation model ECHAM5: part I: model description. Technical Report 349, Max-Planck-Institut, Hamburg, Germany
- Schwierz, C, Köllner-Heck, P, Zenklusen, E, Bresch, D. N, Vidale, P. co-authors. 2010. Modelling European winter wind storm losses in current and future climate. Clim. Change. 101, 485–514.
- Sriver R. Huber M. Low frequency variability in globally integrated tropical cyclone power dissipation. Geophys. Res. Lett. 2006; 33(11): L11705.
- Sugi M. Noda A. Sato N. Influence of the global warming on tropical cyclone climatology: an experiment with the JMA global model. J. Meteor. Soc. Japan. 2002; 80(2): 249–272.
- Vecchi G. A. Soden B. J. Effect of remote sea surface temperature change on tropical cyclone potential intensity. Nature. 2007; 450: 1066–1070.
- Vickery P. J. Wadhera D. Powell D. Chen Y. Z. A hurricane boundary layer and wind field model for use in engineering applications. J. Appl. Meteor. Clim. 2009; 48: 381–405.
- Webster P. Holland G. Curry J. Chang H. Changes in tropical cyclone number, duration, and intensity in a warming environment. Science. 2005; 309(5742): 1844–1846.
- Yoshimura J. Sugi M. Noda A. Influence of greenhouse warming on tropical cyclone frequency. J. Meteor. Soc. Japan. 2006; 84(2): 405–428.