ABSTRACT
A multi-model archive of global deterministic forecasts and analyses from three operational systems is constructed to analyse recent Northern Hemisphere mid-latitude forecast skill from 2007 to 2012 and its relation to large-scale atmospheric flow anomalies defined by the Arctic Oscillation (AO) index. We find that the anomaly correlation coefficient (ACC) in 120-hr forecasts of 500 hPa geopotential height has similar variability on synoptic, monthly, and seasonal time scales in each of the three forecast systems examined here: the European Centre for Medium-Range Weather Forecasts, the National Centers for Environmental Prediction Global Forecast System, and the U.S. Navy Operational Global Atmospheric Prediction System. The results indicate that forecast skill as measured by the ACC is significantly correlated with the AO index and its transitions between negative and positive phase. Intervals of exceptionally high ACC skill during the 2009–2010 and 2010–2011 winters are associated with periods in which the AO remained in a persistent negative phase pattern. Episodes of low ACC, including so-called ‘forecast skill dropouts’ most frequently occur during transitions between negative and positive AO index and with positive AO index. The root mean square error (RMSE) of 120-hr forecast 500 hPa height is also modulated by the AO index, but to a lesser extent than the ACC. In two recent winters, the RMSE indicates lower 120-hr forecast accuracy during periods with negative AO index, which is opposite to ‘skill’ patterns provided by the ACC. These results suggest that the ACC is not in all situations an optimal metric with which to quantify model forecast skill, since the ACC can be higher when the large-scale atmospheric flow contains strong anomalies even if there is no actual improvement in model forecasts of that atmospheric state.
1. Introduction
The objective of this study is to investigate and quantify possible correlation between metrics of skill in operational weather forecast models and measures of large-scale atmospheric anomalies, specifically here the Arctic Oscillation (AO). Three numerical weather prediction (NWP) systems are used in the study. These are the operational global forecast models of the European Centre for Medium-Range Weather Forecasts (ECMWF), the National Centers for Environmental Prediction (NCEP) Global Forecast System (GFS) and the U.S. Navy Operational Global Atmospheric Prediction System (NOGAPS). The metrics of forecast performance are the anomaly correlation coefficient (ACC, which is a measure of forecast skill in the context of forecasts relative to climatology) and root mean square error (RMSE, which is a measure of forecast accuracy) of 120-hr forecast 500 hPa geopotential height over the Northern Hemisphere (NHEM) mid-latitudes (20°–80°N).
Earlier studies have reported some correspondence between forecast skill and indices of large-scale atmospheric flow anomalies. For example, Johansson (Citation2007) shows higher skill in terms of ACC with large negative and positive values of the Pacific-North American (PNA) teleconnection pattern index and the North Atlantic Oscillation (NAO) index. Thompson and Wallace (Citation1998) describe the AO as incorporating many features of the NAO, although the AO is somewhat larger in horizontal scale. We can thus hypothesise that forecast skill (at least in terms of ACC) may be enhanced when the atmosphere is in a strong negative or positive AO pattern.
Shapiro et al. (Citation2001) note the effect of El Niño-Southern Oscillation (ENSO) phase during 1998 and 1999 on modulation of baroclinic wave life cycles and reduction of a 72-hr forecast error norm in the Navy global model during the strong El Niño event of 1997–1998. Higher forecast accuracy during the 1997–1998 El Niño, relative to the 1998–2001 La Niña is reported by Reynolds and Gelaro (Citation2001).
The relation of forecast skill and atmospheric predictability to large-scale flow anomalies (AO, NAO, ENSO, and others) is an issue of some importance, since the onset and persistence of certain atmospheric flow regimes can have significant effects on model performance (Ferranti et al., Citation2002; Simmons and Hollingsworth, Citation2002; Archambault et al., Citation2008), and on reliability in forecasts of extreme and high-impact weather events including mid-latitude extratropical cyclone activity (Colle and Charles, Citation2011).
Here, we expand upon results of previous studies, comparing variations in AO index with model medium-range forecast skill (ACC) and accuracy (RMSE) of 500 hPa geopotential height. A unique aspect of this study is the compilation of AO, ACC, and RMSE results for five complete years (2007–2012) using three model systems. In Section 2, we briefly describe the multi-model, multi-year data archive and calculation of the ACC and AO measures used in the study. In Section 3, we discuss and compare patterns of ACC in the three models from daily to seasonal time-scales. In Section 4, we describe the correspondence of forecast skill and accuracy to phase of the AO index. In Section 5, we examine model capability to forecast the AO itself, and in Section 6, we provide a summary and conclusion.
2. Data and methods
To assemble a multi-model, multi-year archive of deterministic model forecasts, we have used public forecast data repositories from several global NWP centres, including the ECMWF, the NCEP GFS and the US Navy NOGAPS, for 2007–2012.
A conventionally defined ACC is calculated to quantify the spatial correlation between forecast and observed deviations from climatology (Miyakoda et al., Citation1972; Murphy and Epstein, Citation1989). The ACC spatially aggregates forecast pattern similarity and is a leading measure of forecast skill used by global operational NWP centres. It should be noted that ACC does not penalise either conditional or unconditional biases, and is strongly modulated by the strength of forecast and analysed atmospheric flow anomalies (e.g. departures from climatology) that are not related to actual forecast accuracy. Other limitations and aspects of ACC interpretation are discussed below.
In this study, unless otherwise stated, ACC refers to the un-centred ACC of 120-hr forecast 500 hPa geopotential height for the NHEM mid-latitudes (NHEM, 20°–80°N). Operational centres generally use centred ACC, although for hemispheric domains centred and un-centred ACC provide essentially the same measure of skill. At each grid point, the forecast and observed 500 hPa geopotential height are compared to a reference climatology. This climatology is calculated by moving a weighted 21-d centred mean window at each grid point and synoptic time (00UTC and 12 UTC) following the methodology of Jung and Leutbecher (Citation2008) and using the new NCEP Climate Forecast System Reanalysis (CFSR; Saha et al., Citation2010). As in operational practice, each model forecast is verified against its own analysis. The values of ACC calculated here have been compared and found consistent with those published by operational forecast centres (ECMWF, NCEP, and US Navy). It is also possible to perform spatial decomposition of atmospheric fields into wavenumber bands (e.g. Jung and Leutbecher, Citation2008); however, this study uses complete fields for both forecast and verification, thus retaining characteristics of the full atmospheric flow at all scales.
Another representation of ACC can be derived using the so-called Fisher z-transformation (Branstator, Citation1986), which is a normalisation of the usual ACC. Although this provides useful properties for interpretation of ACC in some contexts, we here examine the usual (‘raw’) values of ACC, since an objective of this study is to make interpretations regarding ACC as used by operational forecast centres.
In addition to ACC, we also calculate the RMSE of forecast 500 hPa geopotential height. In this study, RMSE refers to 120-hr forecast error for the NHEM mid-latitudes (20°–80°N). We will compare the two metrics (ACC and RMSE) and determine if they provide consistent information regarding forecast performance.
The AO index is defined as the first leading mode of an Empirical Orthogonal Function (EOF) analysis (Thompson and Wallace, Citation1998) of monthly mean 1000-hPa geopotential height anomalies (20°–90°N, 0°–360°E) from the NCEP CFSR (1981–2010). To generate daily AO index values, daily geopotential anomalies are projected onto the monthly loading patterns and then normalised to the standard deviation of the monthly AO index. One may also choose a different reanalysis dataset (e.g. ERA Interim) for the calculation of the AO, although this does not substantially affect the results or conclusions.
3. Anomaly correlation patterns
ACC scores from October 2006 to September 2012 for each model (ECMWF, GFS, NOGAPS) are shown in a (as a 30-d centred-mean) for the NHEM to illustrate aspects of medium-range and forecast skill.
Fig. 1. (a) Anomaly correlation coefficient (ACC) for 120-hr forecasts of 500 hPa geopotential height in the domain 20°–80°N for three global numerical weather prediction (NWP) models: European Centre for Medium-Range Weather Forecasts (ECMWF) (red), National Centers for Environmental Prediction (NCEP) Global Forecast System (GFS) (black), and U.S. Navy Operational Global Atmospheric Prediction System (NOGAPS) (blue), from October 2006 to September 2012. Time series are smoothed with a 30-d centred mean. (b) as in (a), except ACC shown as the subtraction of a 7-d centred mean from the 30-d centred mean for January 2009–September 2012. The x-axis indicates initial-time of forecasts from 00UTC and 12 UTC.
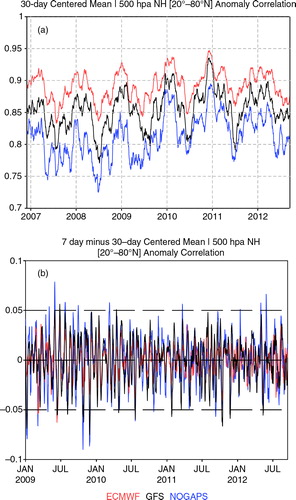
First, there is a definite seasonal signal with ACC scores considerably lower on average during summer and higher in winter. Weather prediction models, in general, show considerably more success in forecasts of synoptic-scale baroclinic waves that dominate error growth in winter, in comparison to smaller-scale errors on the meso- and convective scale that occur during the warm season (Ferranti et al., Citation1990). The change between higher ACC scores in winter and lower scores in summer often occurs abruptly during the transition months of April and October.
For the years examined here, the ECMWF model consistently outperforms both GFS and NOGAPS in terms of ACC score, and maintains that lead during all seasons. The ACC score of each forecast system has increased over time, due to higher resolution, improvements to model physics and dynamics, as well as improved initial conditions from new observations and better data assimilation procedures.
When represented as a 30-d centred-mean (a), transient episodes of relatively high or low ACC score are remarkably well-correlated between the three forecast systems. This illustrates that intrinsic and episodic variations in atmospheric predictability (or the presence of large-scale flow anomalies) tend to increase or decrease the ACC in each model in a similar way, although the magnitudes of ACC are different in each forecast system. This property can be seen more clearly in b, which depicts a centred 7-d mean ACC subtracted from the 30-d centred-mean of ACC. Here, a positive value indicates a forecast that is more-predictable than the monthly average while a negative value demonstrates a less-predictable forecast. Remarkably, the ACC scores of the models closely correlate with each other (above or below average) at nearly all times and all seasons, despite differences in model formulation, data assimilation procedures and observation selection between the three forecast systems.
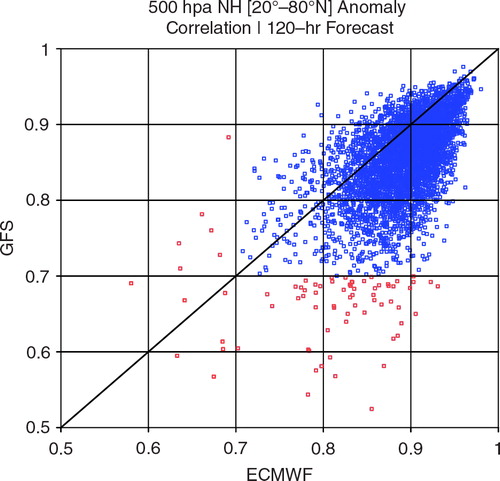
The scatter plot in shows ACC for several thousand ECMWF and GFS 120-hr forecasts from October 2006 to September 2012. It is very uncommon for either GFS or ECMWF to report an ACC below 0.80 while the ACC of the other model in the same forecast is above 0.90. Very high ACC scores (above 0.90) also tend to occur simultaneously in GFS and ECWMF.
Fig. 2. Scatter plot of the anomaly correlation coefficient (ACC) for 120-hr forecasts of 500 hPa geopotential height in the domain 20°–80°N for European Centre for Medium-Range Weather Forecasts (ECMWF) and National Centers for Environmental Prediction (NCEP) Global Forecast System (GFS). Includes all forecasts made from 00UTC and 12UTC during October 2006 to September 2012. Red square markers indicate ACC values of 0.70 or less.
One notable difference in model performance is the smaller variability of ACC in ECMWF forecasts (red line in b) when compared to GFS and NOGAPS. This indicates greater reliability in the ECWMF forecasts. In both ECMWF and GFS, variability of ACC is much larger during summer months, as seen for ECMWF (a) and GFS (b). Episodic forecasts with very low-skill (sometimes referred to as ‘forecast dropouts’, and defined according to various criteria) are also more common in summer and fall, which partially explains the lower average values of ACC in those seasons. Traditionally, a value of ACC=0.60 is considered the limit below which a forecast has no practical value (Hollingsworth et al., Citation1980). This rarely occurs in current operational 120-hr forecasts.
Fig. 3. Anomaly correlation coefficient (ACC) for 120-hr forecasts of 500 hPa geopotential height in the domain 20°–80°N for: a) European Centre for Medium-Range Weather Forecasts (ECMWF) and b) National Centers for Environmental Prediction (NCEP) Global Forecast System (GFS), from January 2007 to September 2012. Individual forecasts (from 00UTC and 12UTC) are shown as blue circles, the 30-d centred mean as a black solid line, and the 90-d centred mean as a solid red line. The x-axis indicates initial-time of the forecasts.

4. AO phase and forecast error metrics
During the winter (DJF) of 2009–2010, historically-extreme values of both the NAO (Overland and Wang, Citation2010; Jung et al., Citation2011) and AO (L'Heureux et al., Citation2010) were associated with bitterly cold and snowy mid-latitude weather conditions over Northern Europe (Cattiaux et al., Citation2010; Ouzeau et al., Citation2011) and the United States (Seager et al., Citation2010; Wang et al., Citation2010). The frequency and persistence of the negative AO and negative NAO blocked phase have been linked to hemispheric-scale cold-air outbreaks (Thompson and Wallace, Citation2000; Guirguis et al., Citation2011). But is there a relation between AO phase, its associated large-scale flow anomalies, and model predictive skill in the medium-range, as found by Johansson (Citation2007) in association with the PNA and NAO?
We find that both ECMWF and GFS performed exceptionally well in terms of ACC score during two recent winters (2009–2010 and 2010–2011), and specifically when there were extended episodes of strong and persistent negative AO index. For example, 120-hr ACC scores for ECMWF and GFS typically exceeded 0.90 during December 2009 and February 2010 (a, c) and from late November 2010 to mid-January 2011 (a, c). Each of these intervals with exceptionally-high values of ACC occurred in conjunction with strong and persistent negative AO index, in some cases with AO index of less than −4.0. The frequency of 120-hr forecasts with very low ACC (‘dropouts’) was also reduced during the periods with strongly negative AO index (Fig. a, c, a, c), and record-high values of 10-d ACC (between 0.7 and 0.8) for ECMWF were reported (Andersson and Richardson Citation2011; see also b).
Fig. 4. Time series of the Arctic Oscillation (AO) index (shown as a solid black line and scaled on the left y-axis). Panels a) and c) show the anomaly correlation coefficient (ACC) for 120-hr forecasts of 500 hPa geopotential height in the domain 20°–80°N for, respectively, European Centre for Medium-Range Weather Forecasts (ECMWF) and National Centers for Environmental Prediction (NCEP) Global Forecast System (GFS), plotted as a blue line and scaled on the right y-axis. Panels b) and d) show the root mean square error (RMSE) for 120-hr forecasts of 500 hPa geopotential height in the domain 20°–80°N for, respectively, ECMWF and GFS, plotted as a blue line and scaled on the right y-axis. The x-axis indicates initial time of forecasts made from 00UTC and 12UTC, during the period 1 November 2009 to 30 April 2010.
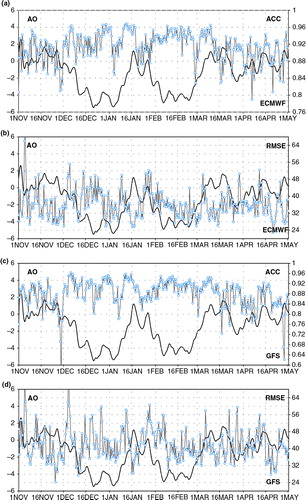
Fig. 5. As in , but for the time period 1 November 2010 to 30 April 2011.

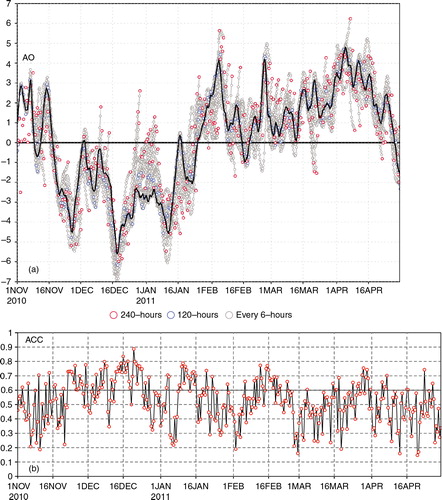
Fig. 6. (a) European Centre for Medium-Range Weather Forecasts (ECMWF) deterministic forecasts (shown at 6-hr intervals) of the Arctic Oscillation (AO) index. 120-hr forecasts of AO index are shown as blue circles, and 240-hr forecasts as red circles. Forecasts are made from 00UTC and 12UTC. The actual AO index (derived from ECMWF analyses at 00UTC and 12UTC) appears as a solid black line at forecast verification time. Panel (b) shows the anomaly correlation coefficient (ACC) for ECMWF 240-hr forecasts of 500 hPa geopotential height in the domain 20°–80°N. The x-axis indicates verification time, from 1 November 2010 to 30 April 2011.
In contrast, average ACC scores were lower during transitions between negative and positive AO phase and, to some extent, during periods of positive AO phase, in which there tend to be increased numbers of relatively low-skill forecasts (‘dropouts’). These forecasts with lower AC can be seen in a, c during onset of the December 2009 negative AO phase, and the short episode of positive AO of in January 2010. Upon reestablishment of another extreme negative AO event around 1 February 2010, ECMWF forecasts rebounded with much higher ACC (a). With the onset of 2010 NHEM spring, the AO negative phase ends, accompanied by lower ACC and larger variability in forecast skill. Similar patterns are seen in the GFS forecasts during these years, keeping in mind differences in average ACC magnitude between the models.
Our results with AO are partially consistent with those of Johansson (Citation2007), who reports a correlation of increased 5-d ACC with strong anomalies of the PNA and NAO in both positive and negative phase. Since the PNA, NAO and AO represent somewhat different measures of large-scale atmospheric circulation anomalies, it is not unexpected to find differences in the correlation of these various indices with the ACC measure of forecast skill.
In the current study, whereas high values of ACC are strongly correlated with negative AO index, we find a weaker connection between ACC and positive AO index. In some instances, the ACC is reduced during intervals with positive AO index. It is possible for example, that a potential increase of ACC from the strong positive AO that develops in March–April 2011 is offset by the transition to the spring season. That is, the positive AO could be a factor tending to increase the ACC, which is partially or totally offset by the typical spring season decrease in ACC.
We now examine forecast accuracy using the RMSE for the same two winters, those of 2009–2010 and 2010–2011. The results, shown in b, d and b, d, suggest that lower forecast accuracy (higher RMSE) occurs during intervals with negative AO, and higher forecast accuracy (lower RMSE) occurs with positive AO. Note in particular the larger RMSE during the periods of negative AO in December 2009 (b, d) and December 2010 to January 2010 (b, d), and the smaller RMSE during the period of positive AO in April 2011 (b, d).
Although the ACC and RMSE are partially-related error measures (both include a measure of mean-square error, Murphy and Epstein, Citation1989) these results indicate that ACC and RMSE do not necessarily provide consistent conclusions regarding model performance or the relation of atmospheric predictability to large-scale atmospheric flow anomalies such as those represented by the AO index. With negative AO index, the atmosphere may be more predictable in terms of large-scale features such as those measured by the 500 hPa ACC, while in terms of features measured by the 500 hPa RMSE, the atmosphere may be less predictable. In addition, the ACC is partly a measure of ‘potential’, rather than actual forecast skill. Therefore, when the atmosphere contains strong and persistent anomalies, the potential forecast skill (and the ACC) is inherently higher than during anomaly index transition periods.
5. Forecasts of the AO
In terms of ability to forecast the AO, current models have fairly good accuracy through about 5-d. Johansson (Citation2007) showed the NAO and PNA teleconnection pattern could be forecast reasonably well at 5-d range. However, model accuracy in forecasts of AO index decreases considerably in the 6 to 10-d range, with considerable uncertainty in the predicted AO index.
In a, we show error in ECMWF forecasts of AO index at d-5 and d-10 during winter 2010–2011. The forecast AO index (open circles) are plotted at 6-hourly intervals, with the analysed AO value shown as a solid black line. At 5 d (blue circles) typical errors in forecasts of AO value are relatively small, but at 10 d (red circles), large errors in forecasts of the AO index are common. In some cases, even the AO phase (negative or positive) is incorrectly forecast at 5 or 10 d. However, as with 120-hr ACC (), the highest 240-hr ACC scores (b) during this winter are achieved during the period of strong negative AO index from November 2010 to January 2011.
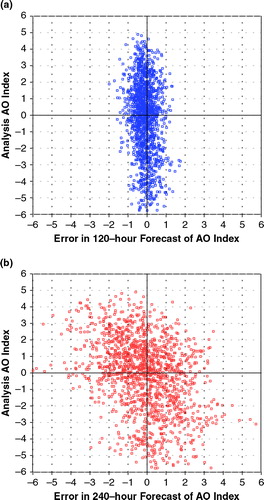
Although forecast skill as measured by ACC is consistently higher during negative AO phase, accuracy in forecasting the AO index at either 5 or 10 d (a, b) seems to have no particular correlation with AO phase. Of central interest here is the discrepancy between model skill in forecasts of the AO itself, which does not appear correlated with AO phase or magnitude of the AO index, as opposed to the relatively strong correlation of ACC with AO phase – in particular the correspondence of high ACC with negative AO index in both ECMWF and GFS. This may be understood by again noting that the ACC will be higher when the large-scale atmospheric flow contains strong anomalies, even if the atmospheric state associated with the anomalies is not well-forecast. In the presence of significant large-scale flow anomalies, such as those represented by strongly negative AO index, there is larger potential forecast skill, which is quantified as higher values of ACC. In fact, the actual forecast accuracy as measured by other metrics, such as the RMSE (b) may not be improved during intervals of strong negative AO index.
Fig. 7. Scatter plot of European Centre for Medium-Range Weather Forecasts (ECMWF) deterministic forecasts of the Arctic Oscillation (AO) index for: (a) 120-hr forecasts and (b) 240-hr forecasts, started from 00UTC and 12UTC. The x-axis indicates error (forecast AO minus analysed AO) in forecasts of the AO index. The y-axis is the analysed AO index at forecast verification time. The figure includes Northern Hemisphere (NHEM) cold season forecasts (1 October to 1 March), 2008 to 2012.
6. Summary
In this brief report, we have used a multi-model, multi-year data archive to investigate some aspects of model forecast performance as measured by the 500 hPa geopotential height ACC and root mean square forecast error, in the context of variations of the AO index of large-scale flow anomalies in the NHEM. The recent winters of 2009–2010 and 2010–2011 saw extended periods with extreme negative values of the AO index, accompanied by exceptionally high (in some cases record high) ACC skill scores, as shown here and reported by ECMWF.Footnote1 However, these periods with negative AO and very high ACC did not have exceptional forecast accuracy as quantified by 500 hPa RMSE.
Our main conclusions are:
The ACC for 120-hr forecast 500 hPa height is strongly modulated by variations in AO index. The highest values of ACC occur during extended periods of strongly negative AO index. The ACC is lower on average and has greater variability during transitions between positive and negative AO phase, and when the AO index has episodes of positive phase.
The RMSE of 120-hr forecast 500 hPa height shows a weaker (compared to ACC) correlation with the AO index, and there is some evidence that forecast accuracy in terms of RMSE is reduced during periods of negative AO index, which is in contradiction to interpretations of model skill based on ACC.
Increases and decreases of ACC on various time-scales (from daily to 30-d mean) tend to occur simultaneously in the ECMWF, GFS and NOGAPS forecast models. This includes the timing and occurrence of forecast skill ‘dropouts’, which frequently occur at the same forecast time in each model, although there are substantial differences in average ACC scores between the models.
Predictions of the AO index are made with relatively good skill in the ECMWF model at 120-hr, with little or no correlation of AO-forecast skill to strength or sign of the AO index. This is additional evidence that high values of ACC in association with strong negative AO index are at least partly an artefact of large-scale anomaly magnitude, and not entirely due to enhanced forecast accuracy.
7. Acknowledgements
This research was performed while the second author held a National Research Council Research Associateship Award at the Naval Research Laboratory in Monterey, California from 2010 to 2012. ECMWF deterministic forecast model data was obtained from the THORPEX Interactive Grand Global Ensemble (TIGGE) ECMWF portal. NCEP GFS and CFSR datasets were obtained from the NCDC NOAA Operational Model Archive and Distribution System (NOMADS). Support from the sponsor ONR PE-601153N for the first author is gratefully acknowledged. This research is supported by the NRL Base Program, PE 0602435N. The helpful comments of three manuscript reviewers are gratefully acknowledged.
Notes
1‘Landmark in Forecast Performance’: www.ecmwf.int/publications/cms/get/ecmwfnews/1268389540174.
Related Research Data
References
- Andersson E. Richardson D. Forecast performance 2010. ECMWF. Newsl. 2011; 126: 10–11.
- Archambault H. Bosart L. F. Keyser D. Aiyyer A. R. Influence of large-scale flow regimes on cool-season precipitation in the Northeastern United States. Mon. Wea. Rev. 2008; 136: 2945–2965. 10.3402/tellusa.v64i0.17531.
- Branstator G. The variability in skill of 72-hour global-scale NMC forecasts. Mon. Wea. Rev. 1986; 114: 2628–2639.
- Cattiaux, J, Vautard, R, Cassou, C, Yiou, P, Masson-Delmotte, V and co-authors. 2010. Winter 2010 in Europe: a cold extreme in a warming climate. Geophys. Res. Lett. 37, L20704. DOI: 10.3402/tellusa.v64i0.17531.
- Colle B. A. Charles M. E. Spatial distribution and evolution of extratropical cyclone errors over North America and its adjacent oceans in the NCEP global forecast system model. Wea. Forecasting. 2011; 26: 129–149. 10.3402/tellusa.v64i0.17531.
- Ferranti L. Klinker E. Hollingsworth A. Hoskins B. J. Diagnosis of systematic forecast errors dependent on flow pattern. Q. J. Roy. Meteorol. Soc. 2002; 128: 1623–1640. 10.3402/tellusa.v64i0.17531.
- Ferranti L. Palmer T. N. Molteni F. Klinker E. Tropical-extratropical interaction associated with the 30–60 day oscillation and its impact on medium- and extended-range prediction. J. Atmos. Sci. 1990; 47: 2177–2199.
- Guirguis, K, Gershunov, A, Schwartz, R and Bennett, S. 2011. Recent warm and cold daily winter temperature extremes in the Northern Hemisphere. Geophys. Res. Lett. 38, L17701. DOI: 10.3402/tellusa.v64i0.17531.
- Hollingsworth A. Arpe K. Tiedtke M. Capaldo M. Savijärvi H. The performance of a medium-range forecast model in winter–impact of physical parameterizations. Mon. Wea. Rev. 1980; 108: 1736–1773.
- Johansson Å. Prediction skill of the NAO and PNA from daily to seasonal time scales. J. Clim. 2007; 20: 1957–1975. 10.3402/tellusa.v64i0.17531.
- Jung T. Leutbecher M. Scale-dependent verification of ensemble forecasts. Q. J. Roy. Meteorol. Soc. 2008; 134: 973–984. 10.3402/tellusa.v64i0.17531.
- Jung, T, Vitart, F, Ferranti, L and Morcrette, J.-J. 2011. Origin and predictability of the extreme negative NAO winter of 2009/10. Geophys. Res. Lett. 38, L07701. DOI: 10.3402/tellusa.v64i0.17531.
- L'Heureux, M, Butler, A, Jha, B, Kumar, A and Wang, W. 2010. Unusual extremes in the negative phase of the Arctic Oscillation during 2009. Geophys. Res. Lett. 37, L10704. DOI: 10.3402/tellusa.v64i0.17531.
- Miyakoda K. Hembree G. D. Strickler R. F. Shulman I. Cumulative results of extended forecast experiments. 1. Model performance for winter cases. Mon. Wea. Rev. 1972; 100: 836–855.
- Murphy A. H. Epstein E. S. Skill scores and correlation coefficients in model verification. Mon. Wea. Rev. 1989; 117: 572–581.
- Ouzeau, G, Cattiaux, J, Douville, H, Ribes, A and Saint-Martin, D. 2011. European cold winter 2009–2010: how unusual in the instrumental record and how reproducible in the ARPEGE-climate model?. Geophys. Res. Lett. 38, L11706. DOI: 10.3402/tellusa.v64i0.17531.
- Overland J. E. Wang M. Large-scale atmospheric circulation changes associated with the recent loss of Arctic sea ice. Tellus. Ser. A. 2010; 62: 1–9. 10.3402/tellusa.v64i0.17531.
- Reynolds C. A. Gelaro R. Remarks on Northern Hemisphere forecast error sensitivity from 1996 to 2000. Mon. Wea. Rev. 2001; 129: 2145–2153.
- Saha, S, Moorthi, S, Pan, H- L, Wu, X, Wang, J and co-authors. 2010. The NCEP climate forecast system reanalysis. Bull. Am. Meteorol. Soc. 91, 1015–1057. 10.3402/tellusa.v64i0.17531.
- Seager, R, Kushnir, Y, Nakamura, J, Ting, M and Naik, N. 2010. Northern Hemisphere winter snow anomalies: ENSO, NAO and the winter of 2009/10. Geophys. Res. Lett. 37, L14703. DOI: 10.3402/tellusa.v64i0.17531.
- Shapiro M. A. Wernli H. Bond N. A. Langland R. H. The influence of the 1997–1998 ENSO on extratropical baroclinic life cycles over the North Pacific. Q. J. Roy. Meteorol. Soc. 2001; 127: 331–342.
- Simmons A. Hollingsworth A. Some aspects of the improvement of skill of numerical weather prediction. Q. J. Roy. Meteorol. Soc. 2002; 128: 647–677. 10.3402/tellusa.v64i0.17531.
- Thompson D. W. J. Wallace J. M. The Arctic Oscillation signature in the wintertime geopotential height and temperature fields. Geophys. Res. Lett. 1998; 25(9): 1297–1300. 10.3402/tellusa.v64i0.17531.
- Thompson D. W. J. Wallace J. M. Annular modes in the extratropical circulation. Part I: month-to-moth variability. J. Clim. 2000; 13: 1000–1016.
- Wang, C, Liu, H and Lee, S. 2010. The record-breaking cold temperatures during the winter of 2009/2010 in the Northern Hemisphere. Atmos. Sci. Lett. 11(3), 161–168. DOI: 10.3402/tellusa.v64i0.17531.