ABSTRACT
Data denial experiments using the European Centre for Medium-Range Weather Forecasts (ECMWF) model are designed to investigate the value of targeted observations for historical extratropical transition (ET) cases over the Atlantic. The impact of removing data from specified locations linked to the ET development is therefore examined. It is shown that the impact of denying data in the near tropical cyclone (TC) environment is, on average, as important as denying data in mid-latitude sensitive regions determined using extratropical singular vectors (SV). The impact of data denial over TC regions propagates downstream from the Atlantic towards Europe, with a maximum degradation at day 4. This degradation is mainly attributed to the data denial at the TC stage, i.e. before ET is completed. When data are denied on mid-latitude sensitive regions, the largest degradation is found around day 2 and also after the day 4 forecast. In general, the loss of information content is larger when data are denied in mid-latitude sensitive areas because these identify dynamically active regions. In both denial experiments, aircraft and satellite radiance data are the most influential observations. For the selected case of Hurricane Irene, the largest degradations are found for forecasts initialised while Irene reached its peak intensity. If observations are denied in the near storm environment, the TC mostly disappears from the analysis and the subsequent forecast. This allows the impact of Irene on the formation of the downstream cut-off low to be investigated.
1. Introduction
The extratropical transition (ET) of tropical cyclones (TCs) is known to cause problems in numerical weather prediction systems as it is often associated with a distinct decrease in forecast skill (Jones et al., Citation2003). Small uncertainties in regions around ET events can lead to large forecast errors in the mid-latitudes and downstream due to the complex physical interactions of the TC with the mid-latitudes (Harr and Elsberry, Citation2000; Klein et al., Citation2002; McTaggart et al., Citation2003; Hart et al., Citation2006; Ritchie and Elsberry, Citation2007; Riemer et al., Citation2008).
Harr et al. (Citation2008) and Anwender et al. (Citation2008) have shown that ET events are associated with plumes of high uncertainty in the European Centre for Medium-Range Weather Forecasts (ECMWF) ensemble prediction system that spread downstream. Reynolds et al. (Citation2009) and Kim and Jung (Citation2009) found that recurving and non-recurving TCs are sensitive to changes in the initial state in the near storm environment. Kim and Jung (Citation2009) attributed this sensitivity to inflow from the subtropical ridge and warming in the mid troposphere. For recurving TCs, the main sensitivities were associated with upper troughs and regions located up to 4000 km upstream (Kim and Jung, Citation2009; Reynolds et al., Citation2009). Torn et al. (Citation2009) used ensemble based sensitivity analysis (Hakim and Torn, Citation2008) to show that forecast error which grows associated with an ET event is sensitive to changes in the ET environment and in the troughs upstream.
In numerical weather prediction, an important source of uncertainty is due to the fact that these types of phenomena are poorly observed given the insufficient and inhomogeneous data coverage over the ocean where the majority of TCs undergo ET. Introducing additional targeted observations in the vicinity of ET events or in sensitive regions associated with TCs approaching the mid-latitudes should bring a notable forecast improvement. Over the last years, numerous field campaigns have been conducted in which observations were collected in specific regions and proved to be beneficial for the forecast (Joly et al., Citation1999; Szunyogh et al., Citation2000, Citation2002; Langland, Citation2005; Fourrié et al., Citation2006). The impact of these observations was found to be positive overall but small, with maximum error reductions in some specific cases of 10–15% for variables such as mean sea-level pressure. Furthermore, the impact of additional aircraft observations on TC forecasts over the North Atlantic (e.g. Aberson, Citation2003, Citation2010) and the western North Pacific (e.g. Weissmann et al., Citation2011) was investigated. In the more recent field campaigns, that is, THORPEX Pacific Asian Regional Campaign (T-PARC) and Dropwindsonde Observations for Typhoon Surveillance near the Taiwan Region (DOTSTAR) (e.g. Chou et al., Citation2011), the forecast skill in the presence of TCs, their ET and downstream impact was investigated. The mean 1–5 d impact of dropwindsondes on the typhoon track forecast with the National Centres for Environmental Prediction (NCEP) model system was found to be positive, reducing the track error by about 10–20%. The impact on the ECMWF system was positive but smaller. Finally, Aberson (Citation2008) found some large forecast degradations in the Global Forecasting System (GFS) in TC synoptic surveillance. He argues these are due to erroneous data assimilated into the model or due to the complexity of data assimilation systems themselves.
Recently, data denial studies at ECMWF were used to investigate the sensitivity of the forecast atmospheric flow over Europe to targeted observations taken over the Atlantic (Buizza et al., Citation2007; Cardinali et al., Citation2007). These studies provided an upper bound of the expected impact that extra observations released in targeting campaigns would have. Singular vectors (SV) with maximum error amplification rate after 2 d over Europe were calculated using the dry total energy norm to determine the sensitive regions. The assimilation experiments were performed in two different seasons for 3 months and the data denied at every assimilation cycle. During ET events a maximum forecast degradation of 13% in terms of the root-mean-squared error (RMSE) of the 500 hPa geopotential height over Europe was found. The impact was larger than the average impact obtained over the 3 months in the two different seasons when no ET events were present.
In this study data denial experiments are designed to investigate the value of additional observations during ET cases over the Atlantic. In particular, the effect of denying data in the near-storm area (not considering upstream sensitivities in contrast to Hakim and Torn, Citation2008; Kim and Jung, Citation2009; Reynolds et al., Citation2009) is compared to the effect of denying data in sensitive regions as defined by the maximum error growth at day 2 forecast over Europe. The loss of information content for both experiments is also investigated. The comparison should shed some light on the most important region to observe in order to improve the forecast over Europe: the ET region itself or dynamically active regions over the Atlantic where initially small errors can grow rapidly. Our investigation extends the earlier studies, in particular, with respect to increasing the awareness of national weather services about uncertainties and possible error growth over Europe for the specific cases when TCs are approaching the mid-latitudes in the Atlantic. For one specific case, Irene (16 August 2005), for which the data denial resulted in a dramatic weakening of the analysed TC, the propagation of the errors in the forecast are investigated in more detail. Downstream of Irene, a cut-off low formed over central Europe several days later, which caused flooding and states of emergency. This cut-off low would not have been forecast without the observations around Irene.
The structure of the paper is as follows. Section 2 describes the ECMWF Integrated Forecasting System (IFS) model used and the experimental set-up. An overview of the eight ET cases is given in section 3. The average impact of data denied in the ET regions versus extratropical SV regions is presented in section 4. In section 5, the loss of information content in both denial experiments is compared. The error propagation in specific forecasts of the ET of Irene (2005) is investigated in section 6. Conclusions are provided in section 7.
2. Experimental set-up
The data denial experiments were conducted with version 37R2 of the ECMWF IFS which was implemented in May 2011. The 12-h window 4D-Var assimilation system (Mahfouf and Raiber, Citation2000; Janisková et al., Citation2002; Lopez and Moreau, Citation2005) at the resolution T255 was used whilst the observation departures (difference between observations and model) and the model trajectory, that is, the forecast, were computed at T799. A vertical resolution of 91 model levels was used.
Eight cases of TC undergoing ET in the North Atlantic between the years 2002 and 2009 were chosen. shows the periods of investigation for each event, the number of denial cases, and the respective ET times. In general, data were denied only over the ocean, the observations were first removed only when TCs moved polewards of 30°N and then at every assimilation cycle until the ET system weakened considerably (about 10 hPa in 12 h) and/or was close to Europe (~10°W, longitude of the Iberian Peninsula). This definition of the investigation periods implies that the number of denial cases vary from ET case to ET case. The data denial was performed in the assimilation cycles used to produce the analyses at 00 and 12 UTC in the respective periods. In the denial experiments all observations were denied. Consequently, the number of observations denied is much larger than the number of observations added in typical targeting field campaigns and do not exactly replicate the impact of adding observations in targeted regions. However, following Cardinali et al. (Citation2007) we believe that the denial experiments can be used to get an upper bound of the potential average impact additional observations could have in different regions. Hereby, the comparison of the value of observations in different regions is more important than determining the size of the impact.
Table 1. Overview of the 8 ET events, the periods during which they were investigated, the consequential number of denial cases, that is, analysis times from which all the forecasts are started, and the ET times
Three types of experiment were carried out. In the first (SVout), data was denied in sensitive regions determined by the first leading extratropical SV, that is, SV1, optimised at day 2 over Europe (35°−60°N, 10°W–25°E). The SVout regions do not comprise the whole SV1 area but only the regions of maximum sensitivity, that is, in which SV1 exceeds a certain value. This value is chosen such that the SVout regions always have the same size. The second experiment (ETout) is characterised by observations denied at each analysis time on boxes centred on the TC. The TC centre was determined by the local minimum of mean sea-level pressure or by the local maximum of relative vorticity at 850 hPa if no distinct mean sea level pressure minimum was found. The boxes have about the same size as the SV areas (~13°×13°, varying slightly in shape with the shape of the ET system) in every denial case.
The third experiment is the control experiment (Ctrl), equivalent to the operational configuration in which all observations are assimilated.
The impact of data denial on the forecast is measured with respect to the Ctrl in terms of RMSE scores and normalised by the RMSE of Ctrl. For the calculation of the RMSE the Ctrl analysis is used. Dry total energy norm is the parameter used in the forecast score index, since the same metric is used in the SV calculation. The difference total energy (DTE) for the RMSE is calculated following Hodyss and Majumdar (Citation2007) and integrated between 200 and 1000 hPa. Hence, impact I is:1
The impact up to day 5 forecast lead time is calculated and averaged for each forecast over the European verification area (35–75°N, 10°W–30°E). A negative impact indicates a degradation of the forecast if data are removed implying that the removed observations are beneficial for the forecast over Europe. From thereafter, the propagation of the impact of data denial will be referred to as the propagation of the signal.
3. The cases
In all of the eight ET cases, the resulting extratropical cyclone deepened strongly (i.e. mean sea-level pressures after ET ≤ 990 hPa) after their transition. All of the cases apart from Bill (2009) are characterised by the formation of a cut-off cyclone over Europe downstream of the ET event (). shows all eight cases at or after their ET is completed when a distinct impact downstream can be noticed. In many of the cases the downstream trough seems to have been reinforced by the ridges which are found immediately downstream of the ET events. The ridge building has been strengthened or deformed by the respective ET event. For all cases except for Bill the mid-latitude flow pattern was characterised by strong meridional excursions of the upper-level mid-latitude jet after the ET. During Bill's ET a strong dipole between the subtropical ridge and an extensive band of low pressure north of 55°N led to a zonal mid-latitude flow. Embedded in this flow Bill moves rapidly towards Europe.
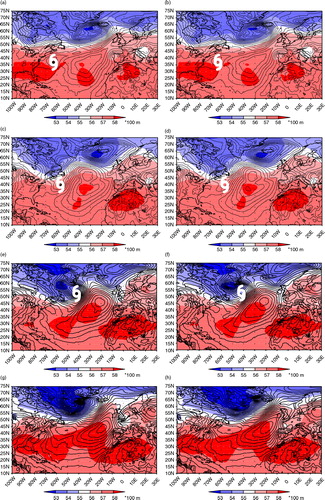
Fig. 1. ECMWF analysis of the 500 hPa geopotential (shaded), mean sea-level pressure (contours, contour interval is 5 hPa) for a) Cristobal, b) Fabian, c) Irene, d) Maria, e) Florence, f) Helene, g) Bertha and h) Bill after the formation of a downstream trough. The position of SV1 at the respective analysis time is marked by black dots. Each ET system is centred in a white rectangular box.
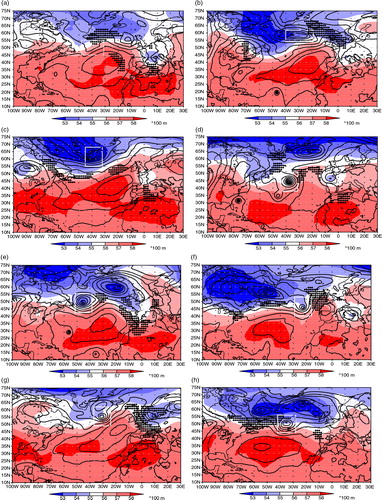
In two cases (Fabian, b, Florence, e) the ET system stays nearly stationary over the North Atlantic while a block forms over Europe. Most of the cases are characterised by the ET systems turning to north and following divergent flow to the west of Europe (c, d, f, g). Only in two cases (Cristobal, a, Bill, h) do the remnants of the ET affect Europe directly.
Strong flooding over Central Europe, the Ukraine and East Russia resulted from the ETs of Cristobal, Irene and Bertha. The Elbe flooding in 2002 that resulted in considerable loss of life and economical damage was associated with the cut-off low that developed downstream of Cristobal's ET. The flooding due to the cut-off low downstream of Irene caused a state of disaster over Bulgaria, led to fatalities over Romania and caused flooding over Germany, Switzerland and Austria. The low pressure system downstream of Bertha led to huge destruction in association with two rivers in Romania and Ukraine flowing over their banks following copious rainfalls.
Positions of SVs and the ETout box are shown for each ET case () to give an indication of where the regions of the data denial as defined in section 2 are located. SV1 which is optimised over Europe is mainly associated with the ridge between the ET system and the downstream trough at the times shown. Hence, it is connected to the deep pressure system resulting from the respective ET. However, parts of SV1 are also found far upstream over Newfoundland. The locations are largely in agreement with Buizza and Palmer (Citation1995) who found that the first 5 extratropical SVs are located in the leading edge of baroclinic zones determined by the Eady Index. The Eady Index is based on the growth rate of the most unstable normal mode in the simplest model for baroclinic instability, the Eady model (Eady, Citation1949).
Further parts of SV1 are found over Europe, but note that data was denied only over the ocean. ETout boxes are centred on the respective ET event and adapted to the shape of the deep pressure system resulting from the ET. At times before the ET formation, when the ETout box was over the west Atlantic and well to the south of the mid-latitudes (not shown), SV1 was also mainly connected to the mid-latitude flow close to Europe and, hence, was not associated with the ET event.
4. Impact of ETout versus SVout
4.1. Averaged impacts
The total energy RMSE differences averaged over all denial cases between Ctrl and ETout and Ctrl and SVout over Europe are shown for each 12-h forecast interval for up to 5 d forecast lead time (). For up to 48-h forecast time, the percentage degradation in SVout is stronger than in ETout (a). This is expected because the total energy SVs are optimised for 48 h over Europe and, hence, denial in those regions should have the highest impact over Europe at 48 h. The SVout the degradation increases slowly to about 17% at 120 h, while f ETout the degradation dips down to over 22% at 120 h.
Fig. 2. a) Percentage and b) total (not normalised by RMSE (Ctrl)) RMSE difference averaged over all denial cases in total energy (m2/s2) between Ctrl and ETout (red) and between Ctrl and SVout (blue) over Europe for all forecast lead times from 12 to 120 h in 12-h steps. In a) both experiments are normalised by the RMSE of Ctrl.
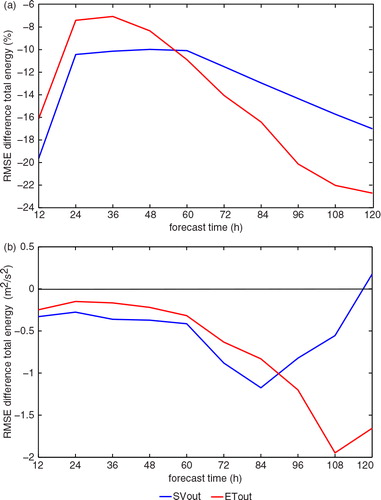
If the total energy RMSE difference is not normalised by the RMSE of the Ctrl (b) it is confirmed that after day 4 the forecast in ETout is degraded more strongly than the maximum degradation in SVout (at 84 h). At day 5 the impact in SVout has become slightly positive. Furthermore, the small not normalised RMSE differences at 12 h (b) illustrate that the strong percentage degradations at 12 h (a) are the result of dividing a small RMSE difference (RMSE(Ctrl) – RMSE(SVout)) by a small RMSE of Ctrl. Consequently, an interpretation of this time step does not yield insight into the effects of data denial and, thus, will not be considered.
As mentioned in the previous section Buizza and Palmer (Citation1995) found that the first 5 extratropical SVs are located in the leading edge of baroclinic zones determined by the Eady Index. Consequently, as soon as a TC undergoes ET and interacts with the baroclinic zone, SVout and ETout regions may be collocated. To separate the impact of denying data over the baroclinic zone and of denying data around the TC, the impact of ETout and SVout is compared during different stages (). The earlier stage (before the TC completed ET) is referred to as the TC stage and the later stage (after the TC completed ET) is referred to as ET stage.
Fig. 3. As separated for denial cases a) before and b) after the TC completed ET.
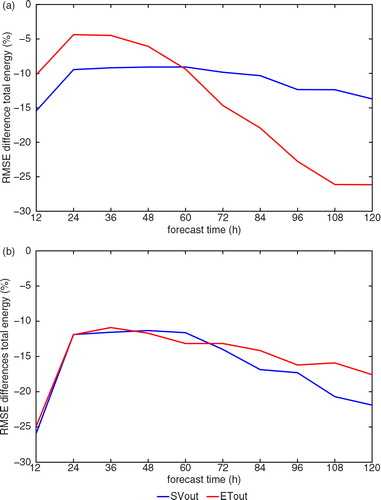
While the degradation curves in ETout and SVout have different shapes for the TC stage (a) they look quite similar for the ET stage (b). This behaviour reflects the fact that the position of the ETout regions and the extratropical SVs overlap partly in the ET stage while the ETout regions are not connected to SV1 in the TC stage. Hence, in the ET stage the SV based sensitive regions for forecast degradation over Europe are strongly associated with the ex-TCs.
In the TC stage, the degradation over Europe in ETout is much stronger, that is, 25%, after 120 h than in SVout (about 13%) (a). Consequently, we deduce that when a TC over the Atlantic is approaching the mid-latitudes, additional observations around the TC are much more beneficial for 60 h and longer forecast ranges over Europe than additional observations in extratropical sensitive regions. It has to be considered, however, that the SVs were optimised for 48 h because for the total energy norm the linearity assumption is no longer fulfilled after that time.
Another striking difference in ETout between the TC and the ET stage is the strong increase of degradation with increasing forecast time in the TC stage (a). During their TC stage the storms are located in the western North Atlantic. The minimum at 120 h reflects the downstream propagation of the effects due to the ETout denial from the TCs towards Europe. In the ET stage the ETout degradation drops down only weakly with increasing forecast time from about 12% at 24 h to about 17% at 120 h.
In SVout the differences between the TC (a) and the ET stage (b) are smaller. However, after 60 h forecast time the increase in degradation in the ET stage is distinctly stronger than in the TC stage. The maximum difference at 120 h is about 22% in the ET stage while it was only about 14% in the TC stage. Again, this reflects the strong impact of the ET events on the forecast over Europe because in this stage the ETout areas partly cover the SVout areas. Nevertheless, the degradation in SVout is stronger than that in ETout after 60 h in the ET stage. This is probably due to the rectangular shape of the ETout boxes. Data denial in these boxes is obviously less effective than data denial in SV1 areas which determine the mid-latitude sensitive regions more appropriately.
More understanding of forecast impacts with regard to different forecast lead times can be gained using cumulative distribution functions (CDF) of the impacts. The impact of each denial case is shown for forecast steps 24 h, 48 h, 72 h, 96 h and 120 h both for ETout and SVout (). The y-axis represents the fraction of denial cases with 1 being equivalent to the complete number of 122 denial cases.
Fig. 4. Cumulative distribution functions (CDF) of forecast impacts at the 24-h (black), 48-h (blue), 72-h (green), 96-h(red) and 120-h (magenta) forecast steps in a) ETout and b) SVout. The fraction of denial cases () is given on the y-axis. On the x-axis the forecast impact is shown in percent.

In ETout more extreme degradations are seen at longer forecast steps than in SVout. SVout shows just two denial cases at 72 h and three denial cases at 96 h which are degraded by more than 50%. A degradation of more than 150% is seen only for 96 lead time by one denial case in SVout (b). In contrast, ETout shows nine denial cases at 72 h and a fraction of over 0.1, that is, over 12 of the denial cases, at 96 h which are degraded by more than 50%. At both 96 h and 120 h two denial cases are degraded by more than 150%. The highest degradation of about 230% (a) is seen at 96 h lead time. However, stronger and more positive impacts are seen for ETout, as well.
For the short forecast lead times, 24 h and 48 h, the opposite behaviour is seen between ETout and SVout. For SVout only two denial cases at 24 h and only 15 at 48 h show positive impacts (b). At 24 h ETout shows 10 denial cases and at 48 h 19 denial cases (a) which have a positive impact on the forecast when data are denied. In SVout (b) the distance between the 24 h and 48 h curve (black and blue) to the zero line is larger on the negative side of the zero line than for ETout (a) signifying larger degradation in SVout than in ETout at these time steps.
An important feature both in ETout (a) and SVout (b) is the fact that the shorter the forecast time, the larger the number of denial cases that show negative impacts, that is, degradations due to data denial (a fraction of over 0.9 at 24 h). Hence, in a fraction of over 0.9 denial cases the denied observations are beneficial for the 24 h forecast. As the forecast time increases, the number of positive impacts, that is, improvements due to data denial, increases also. Nevertheless, a fraction of 0.75–0.8 of the denial cases at 96 h and 120 h show negative impacts, that is, the largest part of the denied observations are beneficial also for 5-d forecasts.
Morss and Emanuel (Citation2002) showed with an idealised system that the influence of adding observations yields a risk of degradation even if the observations are perfect and the model is perfect. This effect is produced by the fact that the background, model and observation error covariance matrices in 4D-Var data assimilation are not the true covariance matrices and are not flow dependent but only statistically represent the error variances and correlations. However, they found that short term forecasts are most likely to be improved. The longer the forecast time is, the higher is the probability of degrading the forecast by additional observations until no difference can be seen between the percentage of degradation and the percentage of improvement due to additional data. Hence, regarded from the opposite viewpoint that taking out observations are expected to degrade the forecast, our results are in accordance with Morss and Emanuel (Citation2002).
All degradations for both ETout and SVout are significant at the 5% level as computed by Student's significance test.
It can be concluded that, on average, introducing data into sensitive regions, as determined by extratropical SVs, is more beneficial for Europe verification region for up to 48 h than introducing data into ET areas. However, when ET systems are close to Europe, introducing data in sensitive regions should yield stronger improvements over Europe than if no ET system is present. This result is in accordance with Cardinali et al. (Citation2007).
If a TC is present in the Atlantic after undergoing recurvature and is approaching the mid-latitudes, additional observations in and around the TC are expected to improve day 3 to 5 forecast over Europe much more than additional observations in SVs which optimise after 2 d. After the TC underwent ET the extratropical SVs are closely connected to the ET system.
4.2. Individual impacts
Using boxplots the impact of one denial case on all forecast steps can be visualised together. The significance for the individual cases was tested using again Students t-test. In ETout (a) 86 cases show a significant impact and in SVout (b) 90 cases show a significant impact of the data denial on the total energy forecast. In ETout just one and in SVout none of the improved forecasts are significant.
Fig. 5. a) ETout and b) SVout: Box and whiskers plot of the percentage impact over Europe (35–75°N, 10°–30°E) in terms of total energy for all denial cases. The boxes comprise the 25 and the 75 quantile, the median is indicated by a horizontal red line in each box. The most extreme outliers are shown by the whiskers. ET cases are divided by vertical dashed lines. ET times are indicated by vertical dotted lines.
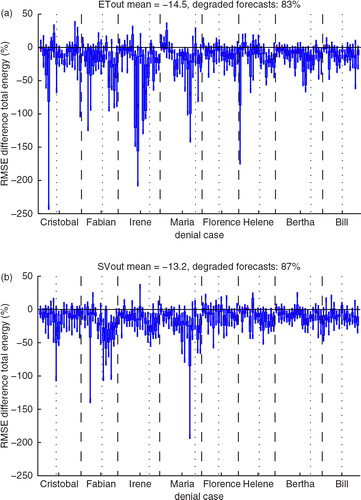
In ETout (a) more extremely negative impacts are found in comparison to SVout (a) as seen in the CDFs () already. Also, the distributions of the impacts are broader in many cases, that is, the boxes comprising the 25 to 75 percentiles are broader.
Looking at the relative positions of the degradations with respect to the ET times (dotted lines) we notice that in ETout (a) about 1 or 2 d before the ET a stronger degradation occurs, as a larger analysis sensitivity is related to the beginning of the TCs transition. In section 6 the impact of an erroneous realisation of the ET system during the ET's onset is presented for Irene which shows remarkable forecast degradations at the beginning of the ET.
For SVout (b) similar periods of increased degradations may be noticed mainly for the earlier cases, that is, Cristobal, Fabian, Irene and Maria. However, in SVout these periods are more coincident with the ET time or shortly later. Hence, the extratropical systems resulting from the ETs lead to larger forecast sensitivities over Europe. This result is in accordance with Cardinali et al. (Citation2007) who found that data denial in SV areas are more detrimental in the presence of ETs.
For ETout the number of degradations is slightly smaller, that is, just 83% compared to 87% in SVout, but the mean of the impacts is slightly larger, that is, 14.5% compared to 13.2% in SVout (a, b, headers). The impacts for denial cases before ET is on average much larger in ETout than the impact after ET.
5. Information content
The information content or degree of freedom for signal (DFS) qualifies the number of statistically independent directions constraint by each observation Hoaglin and Welsh (Citation1987). The calculation of the DFS is described in detail by Cardinali et al. (Citation2004). In particular, the mean observation influence can be also computed by for example observation type. The observation influence depends on the background error covariance matrix, the observation error covariance matrix and the forecast model (Cardinali et al., Citation2004).
The observing system is composed of conventional observations (ground-based observations) and the satellite observations. Surface data such as surface pressure, temperature, relative humidity and winds (SYNOP) are measured by land weather stations and from ships as well as by drifting buoys (DRIBU). Upper air wind and temperature data are taken from aircraft measurements (AIREP) and from radiosondes (PILOT and TEMP). Satellite observations are from geostationary or polar orbiting platforms. The measured variables are satellite cloud drift winds (SATOB), microwave scatterometer derived winds at the ocean surface (SCATT) and satellite infrared (e.g. AIRS, IASI, HIRS) and microwave radiances (e.g. AMSU-A, AMSU-B, SSMI), as well as temperature information from GPS radio occultation. The satellite radiances and temperature information are arranged under the notation SATEM below.
The DFS was calculated per ET case and per observation type respectively for the Ctrl experiment and for the Atlantic/European area (100°W–10°E, 20°– 80°N) ().
Fig. 6. a) Total DFS per ET case for Ctrl. b) Total DFS per observation type for Ctrl. The DFS was calculated over the Atlantic/European area (100°W–10°E, 20°–80°N).
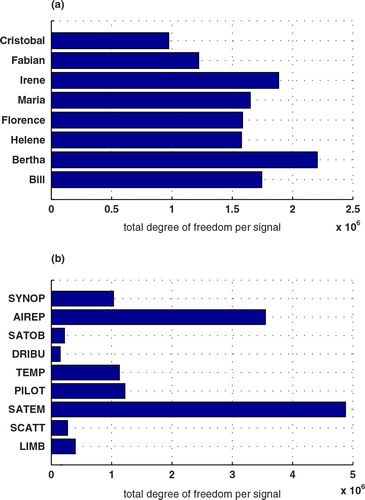
The information contents for the individual ET cases are quite different (a) which is mainly due to the different investigation periods, that is, the DFS for Bertha (18 denial cases) is naturally higher than for Bill (14 denial cases) (). Apart from that, for the early cases Cristobal and Fabian the DFS is smallest because less observations, in particular satellite observations, were available at that time.
Among the different observation types, satellite radiances (SATEM) have the largest DFS, followed by the aircraft measurements (AIREP). The information content of SYNOP, TEMP and PILOT is quite small. Although DRIBU are very accurate measurements, the smallest DFS is found for these observations because of their small number.
The information content differences between ETout and SVout are shown in . In most of the denial cases the values are positive, so that ETout has in general a larger information content than SVout. This indicates that denying observations in SV areas leads to more loss of information content than denying observations in the ET area. For individual cases the values are negative. The leading singular vector SV1 is found in the leading edge of regions of high baroclinicity in the mid-latitudes (Buizza and Palmer, Citation1995) as mentioned in section 4.1. Cardinali et al. (Citation2004) have in fact shown that observations in dynamically active regions have a larger influence. In contrast, TCs which will undergo ET are in general south of the mid-latitude flow in their TC stage, that is, in less dynamically active regions.
Fig. 7. Difference between the information content of all observations for ETout–SVout, normalised by SVout, for all eight ET cases in the Atlantic/European area (100°W–10°E, 20°–80°N).
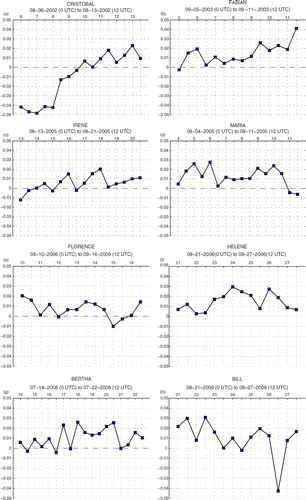
When the data denial is performed for similar regions for ETout and SVout experiments, the DFS differences are quite small or close to zero. This occurs, when ETs reintensify at the poleward side of the jet exit region (Bill around 24 September, g, or Bertha after 20 September, h).
A strong negative peak in DFS differences for cyclone Bill on the 26 August 2009 12 UTC (h) is noticed. The resulting ET system was located on the west coast of Ireland whilst the maximum of SV1 was located over Newfoundland and Greenland, that is, rather far upstream. Denying data in the ET area over Ireland led, therefore, to a larger loss of DFS than denying data in the SVout area. The ET area is, however, also covered by parts of SV1 which do not belong to SVout as they show weaker sensitivity.
For Cristobal (a), the loss of DFS in ETout is higher than in SVout at the TC stage and until the ET on 9 August 2002. Before ET, Cristobal was located in the vicinity of the southern tip of a trough which strongly deepened and then was stationary over Newfoundland for about 3 d when finally Cristobal interacted with the mid-latitudes and transitioned to an extratropical system (not shown). Again, the ETout area was in a dynamically active region that was not captured by SV1.
In general, the DFS differences show a larger DFS loss in the SVout than in the ETout region, and this reflects on the average larger deterioration of the short-range forecast (48-h) in SVout than ETout as found in section 4.1.
6. Signal propagation
In section 4.2 we made the assumption that the short periods of degradation 1 or 2 d before each ET (a) were due to the erroneous representation of the TC on the forecast over Europe. In this section it is shown how errors in the initial condition around the TC approaching the mid-latitudes can propagate downstream and cause forecast degradation over Europe.
Two of the strongest degradations in ETout, that is, 130% and 140%, were seen for the ET of Irene for data denial on 16 September 00 UTC and 12 UTC (a). The data denial in the ETout analysis leads to a significantly different representation of TC Irene on 16 September 12 UTC (b, white TC symbol) than the Ctrl analysis (a). Only a weak deep pressure system embedded in a weak cyclonic circulation is visible in ETout whereas in Ctrl Irene is still a TC of distinct strength with a marked cyclonic circulation.
Fig. 8. Analyses of 16 September 12 UTC for a) Ctrl and b) ETout. Forecasts for c, d) 36 h, e ,f) 60 h and g, h) 84 h initialised on 16 September 12 UTC for Ctrl (left) and ETout (right). 500 hPa geopotential (shaded), mean sea level pressure (contours, contour interval is 2 hPa). The position of Irene is marked by a white TC symbol.
In the 36-h Ctrl forecast, TC Irene starts to interact with the mid-latitude trough that has approached from the west (c). The same forecast range for ETout shows a surface pressure system at about 47°N and 52°W obviously associated with baroclinic development in the region of highest vorticity advection downstream of the trough axis (d). A weak surface low pressure centre is also seen in the region in which Irene is situated in Ctrl (40°N, 59°W).
One day later, that is, 6 h after Irene's ET is completed, the system reintensifies strongly in Ctrl (e). Its intensification is connected to a cyclonic poleward wrap-up of the mid-latitude trough. The structure of the wave breaking resembles the LC2 pattern of the paradigm of baroclinic wave life cycle which is in general associated with a strong intensification of the connected deep surface pressure system (Thorncroft et al., Citation1993). The trough downstream of the ET system which is located over the British Isles has also deepened.
A weak cyclonic wrap-up is seen in ETout as well (f), but it is much less pronounced. The enhancement of the ridge is weaker and its axis is tilted from the southeast to the northwest in contrast to the ridge axis in Ctrl which is oriented quite meridionally (e). The downstream trough over the British Isles thins more rapidly than in Ctrl.
The fact that in Ctrl the ET system is strong while in ETout the TC was almost not present leads us to the conclusion that the formation, the tilt and the propagation of the ridge is mainly influenced by the ET. The meridional orientation of the ridge axis in Ctrl as well as the delayed propagation of the ridge leads in turn to a broader downstream trough. In ETout the downstream trough is instead already dispersing under the influence of the rapidly eastward propagating ridge.
The Ctrl 84-h forecast shows the strong deep pressure system rather stationary over Greenland which has developed from the ET being blocked by the downstream ridge (g). The ridge axis has tilted in a southwest–northeast direction and favours the deepening of the downstream trough and the formation of the cut-off low over Europe which is associated with a mature surface pressure system.
In ETout the deep pressure system in the North Atlantic is instead found farther east from Greenland in the 84-h forecast range (h). The ridge axis has tilted further in the east–west direction and the downstream trough decays. No distinct surface deep pressure system can be assigned to this trough.
The 36-h forecast difference in 500 hPa geopotential height between Ctrl and ETout in the region of Irene is shown in a. Twenty four hours later, this difference is embedded in the mid-latitudes (b). A deeper trough and a higher ridge in Ctrl is apparent in the region of the ex-TC. The presence of the ET system Irene modifies the wave breaking pattern south of Greenland. Deeper values in the downstream cut-off low become apparent at this time. In the 84 h forecast, the differences in the cut-off low over Europe are much larger than around the ex-ET system (c). The differences have propagated from the ET event downstream. The rather zonal orientation of the ridge in ETout leads to a quick decay of the downstream trough. Over Europe strong and exclusively negative values imply that in ETout the negative anomaly in the geopotential is much weaker than in Ctrl.
Fig. 9. Difference between Ctrl and ETout forecasts in terms of the 500 hPa geopotential (shaded) for a) 36-h forecast, b) 60-h forecast and c) 84-h forecast time initialised on 16 September 12 UTC. Ctrl forecast of 500 hPa geopotential (contours).

The formation of the cut-off low due to the influence of the ET of TC Irene led to a long lasting almost stationary precipitation event. These caused the flooding over central and eastern Europe. In the 120-h forecast in ETout (b) no precipitation is found over central Europe while there was a distinct event in Ctrl (a). In ETout larger values of precipitation are located over the French–Spanish border which is connected to a weak cut-off that resulted from the quickly decaying trough over Europe (not shown).
Fig. 10. Forecast of large scale and convective precipitation (mm) (shaded) and of 200 hPa geopotential (contours) for 120 h (a, b) and 144 h (c, d) initialised on 16 September 12 UTC for Ctrl (left) and ETout (right).
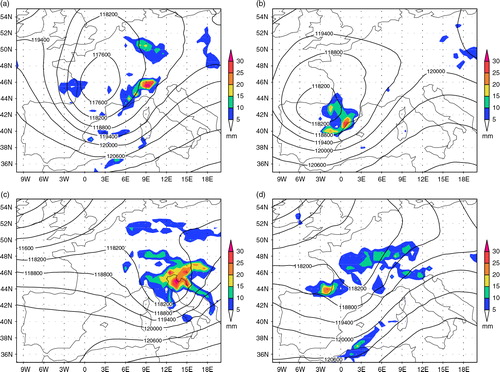
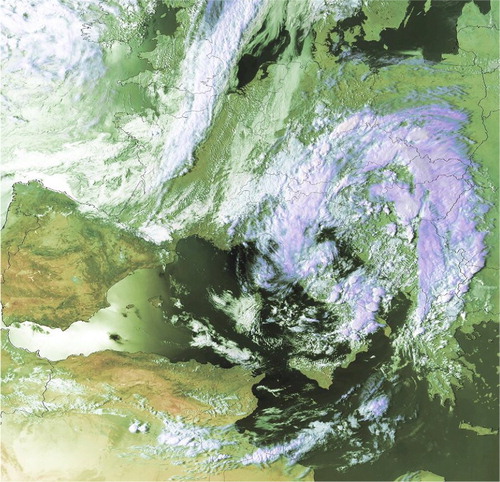
In the 144-h forecast in ETout (d), weak values of precipitation are elongated across central Europe well north of the strong precipitation in Ctrl (c) which is centred over northern Italy at this forecast time. Comparing the 144-h Ctrl forecast (c) to the National Oceanic and Atmospheric Administration (NOAA) visible satellite image of 15:58 (), that is, 4 h after the Ctrl forecast, confirms that the location of the cut-off low leading to the enhanced precipitation was forecast quite well.
Fig. 11. NOAA visible satellite image at 22 August 2005 15:58. www.wettergefahren-fruehwarnung.de; M. Wienzek.
The above case-study clearly highlights the influence of observations in the ET event not only on the analysis but also on the prediction of the European storm. For Cristobal for which the strongest of all degradations was seen for the denial case on the 7 August 2002 12 UTC the surface pressure is much weaker in the ETout than in the Ctrl analysis and also travels towards Europe much quicker (not shown). However, the denial of observations in Cristobal leads to a much stronger reintensification after ET than in Ctrl. While the mid-latitude flow in the Ctrl forecast is quite zonal, a strong ridge and a deeper longer lasting downstream trough over Europe than the Ctrl forecast is formed in the ETout forecast.
However, as seen in , the representation of the TC in the analysis does not necessarily have an impact on the forecasts over the Atlantic (not shown) or over Europe. In some cases, the ET systems strongly influence the atmospheric development by modifying the mid-latitude flow pattern.
7. Conclusions
Data denial experiments have been performed during 8 ET events using the 4D-Var data assimilation system of the ECMWF IFS. The aim was to identify the most important regions in which observations should be made in such situations in order to improve the forecast over Europe. The impact of denying data in the environment of a TC undergoing ET was compared to the impact of denying data in extratropical sensitive regions as determined by the first leading SV, SV1, optimised for the European region.
The average degradation impact over all denial cases on the forecast for total energy integrated between 200 and 1000 hPa is of similar magnitude in both ETout and SVout, that is, about 20% of degradation. For up to 48 h, the degradation in SVout is stronger and in ETout the degradation for longer forecast ranges is stronger.
The average impact of denial cases before the ET is completed (TC stage) leads to degradations of more than 25% at 120 h in ETout. After the ET is completed (ET stage) the degradation in SVout is stronger, that is, about 22%. However, in the ET stage the degradation curves in SVout and ETout are similar because the extratropical SVs are largely connected to the ET systems in this stage. In the ET stage the degradation of SVout is stronger than in the TC stage assigning a distinct importance to the presence of the ET system.
We conclude that in general additional observations in extratropical SV regions are more important to improve short range forecasts, that is, 2 to 3 d, over Europe. For improving the day 3 to 5 forecast when a TC approaches the mid-latitudes, it is much more beneficial to observe the TC region. If the extratropical SV regions are associated with ET events the degradation is higher.
For the 24-h forecast range, the data denial degrades over 90% of the forecasts, measured in terms of total energy, in SVout and ETout. For longer forecast ranges, more improvements due to data denial are found, that is, more of the observations are detrimental to the forecast. For the 5-d forecast range, the data denial degrades 75% of the forecasts both in SVout and ETout. The result, that for longer forecast ranges, additional observations not only improve but can also be detrimental, even if the observations are perfect and the model is perfect, are in agreement with theoretical studies of data impact by Morss and Emanuel (Citation2002). However, the largest part of observations still improves the forecasts after 5 d.
Data denial in ETout leads to more extreme degradations and the variability of impacts from denial case to denial case is larger. Periods of stronger degradations were noted in ETout about 1–2 d before ET was completed and in SVout during and after ET. In ETout this is attributed to enhanced sensitivity around the TC at the beginning of and during transition. In SVout, the degradation is attributed to the ETs, that is, sensitivity areas start to overlap with ET areas.
The total information content (DFS) varies strongly between the ET cases with later cases having higher total DFS. Satellite radiances have largest information content owing to their large number. In general, denying observations in the area of the first leading SV region leads to a larger loss of information content than denying observations in ET areas. This is due to the dynamically active regions identified by leading SVs and reflects the larger degradation of the short range forecasts (up to 48 h) in SVout than in ETout.
The downstream propagation of the impact of ETout is shown for Irene (2005). For two specific denial cases during Irene's ET, the TC almost disappeared from the analysis, if all data was denied. The degradations of the forecasts calculated from these two analyses were almost the highest of all ETout forecast degradations, that is, about 200% and 150%. By comparing these denial cases with the Ctrl in which Irene was present we could compare the development with and without TC Irene. The downstream cut-off low which caused flooding over wide parts of central Europe in 2005 was only weak and disappeared quickly in ETout. Difference plots showed that Irene's ET influenced the shape, the orientation and the propagation speed of the ridge directly downstream and, therefore, led to the formation of the long lasting cut-off low which brought disastrous rainfall to the affected regions. The two forecasts in the ETout experiment failed to predict the strong precipitation over Central Europe.
Based on our study it can be said that if operational weather centres aim for continuous targeting during extreme weather events like ETs it is desirable to take observations close to the TC centre as well as in sensitive regions in the mid-latitudes. In particular, during the movement of a TC towards the mid-latitudes additional observations around this system could improve the 3 to 5 d forecast over the downstream continent.
8. Acknowledgments
This study was financed by the Program ‘Atmosphere and Climate’ of the Helmholtz Association and contributed to the DFG research unit PANDOWAE (FOR896). Acknowledgment is made for the use of ECMWF's computing and archive facilities through the special project ‘The impact of TCs on extratropical predictability’. The first author appreciates having been given the opportunity of an extended visit to ECMWF. We are very thankful to Roberto Buizza and Martin Leutbecher for their help with the SV calculation. We are grateful to Carsten Maas and his colleagues at ECMWF user support for their support in the use of the ECMWF model. The input of Patrick Harr into the design of the denial experiments based on structural features of ET is very much appreciated.
References
- Aberson S. D. Targeted observations to improve operational tropical cyclone track forecast guidance. Mon. Wea. Rev. 2003; 131: 1613–1628. 10.3402/tellusa.v64i0.19151.
- Aberson S. D. Large forecast degradations due to synoptic surveillance during the 2004 and 2005 hurricane seasons. Mon. Wea. Rev. 2008; 136: 3138–3150. 10.3402/tellusa.v64i0.19151.
- Aberson S. D. 10 years of hurricane synoptic surveillance (1997–2006). Mon. Wea. Rev. 2010; 138: 1536–1549. 10.3402/tellusa.v64i0.19151.
- Anwender D. Harr P. A. Jones S. C. Predictability associated with the downstream impacts of the extratropical transition of tropical cyclones: case studies. Mon. Wea. Rev. 2008; 136: 3226–3247. 10.3402/tellusa.v64i0.19151.
- Buizza R. Cardinali C. Kelly G. Thépaut J. -N. The value of targeted observations – Part II: the value of observations taken in singular vectors-based target areas. Quart. J. Roy. Meteor. Soc. 2007; 133: 1817–1832. 10.3402/tellusa.v64i0.19151.
- Buizza R. Palmer T. N. The singular-vector structure of the atmospheric global circulation. J. Atmos. Sci. 1995; 52: 1434–1456.
- Cardinali C. Buizza R. Kelly G. Shapiro M. Thépaut J. -N. The value of targeted observations. III: influence of weather regimes on targeting. Q. J. R. Meteorol. Soc. 2007; 133: 1833–1842. 10.3402/tellusa.v64i0.19151.
- Cardinali C. Pezzulli S. Andersson E. Influence-matrix diagnostics of a data assimilation system. Quart. J. Roy. Meteor. Soc. 2004; 130: 2767–2786. 10.3402/tellusa.v64i0.19151.
- Chou, K. -H, Wu, C. C, Lin, P. H, Aberson, S. D, Weissmann, M and co-authors. 2011. The impact of dropwindsonde observations on typhoon track forecasts in DOTSTAR and T-PARC. Mon. Wea. Rev. 139, 1728–1743. 10.3402/tellusa.v64i0.19151.
- Eady E. T. Long waves and cyclone waves. Tellus. 1949; 1: 33–52. 10.3402/tellusa.v64i0.19151.
- Fourrié N. Marchal D. Rabier F. Chapnik B. Desroziers G. Impact study of the 2003 North Atlantic THORPEX Regional Campaign. Quart. J. R. Meteorol. Soc. 2006; 132: 275–295. 10.3402/tellusa.v64i0.19151.
- Hakim, G. J and Torn, R. D. 2008. Journal: Meteorological Monographs. 33(55): 147–162. 10.3402/tellusa.v64i0.19151.
- Harr P. A. Anwender D. Jones S. C. Predictability associated with the downstream impacts of the extratropical transition of tropical cyclones: methodology and a case study of Typhoon Nabi (2005). Mon. Wea. Rev. 2008; 136: 3205–3225. 10.3402/tellusa.v64i0.19151.
- Harr P. A. Elsberry R. L. Extratropical transition of tropical cyclones over the Western North Pacific. Part II: the impact of midlatitude circulation characteristics. Mon. Wea. Rev. 2000; 128: 2634–2653.
- Hart R. E. Evans J. L. Evans C. Synoptic composites of the extratropical transition life cycle of North Atlantic tropical cyclones: factors determining post-transition evolution. Mon. Wea. Rev. 2006; 134: 553–578. 10.3402/tellusa.v64i0.19151.
- Hoaglin, D. C and Welsh, R. E. 1987. The hat matrix in regression and ANOVA. Am. Stat. 32, 17–22.
- Hodyss D. Majumdar S. J. The contamination of ‘data impact’ in global models by rapidly growing mesoscale instabilities. Quart. J. R. Meteorol. Soc. 2007; 133: 1865–1875. 10.3402/tellusa.v64i0.19151.
- Janisková M. Mahfouf J. -F. Morcrette J. -J. Chevallier F. Linearized radiation and cloud schemes in the ECMWF model: development and evaluation. Quart. J. Roy. Meteor. Soc. 2002; 128: 1505–1527. 10.3402/tellusa.v64i0.19151.
- Joly, A, Browning, K. A, Bessemoulin, P, Cammas, J. -P, Caniaux, G and co-authors. 1999. Overview of the field phase of the Fronts and Atlantic Storm-Track Experiment (FASTEX) project. Quart. J. R. Meteorol. Soc. 125, 3131–3163. 10.3402/tellusa.v64i0.19151.
- Jones, S. C, Harr, P. A, Abraham, J, Bosart, L. F, Bowyer, P. J and co-authors. 2003. The extratropical transition of tropical cyclones: forecast challenges, current understanding, and future directions. Weather. Forecast. 18, 16–56.
- Kim H. M. Jung B. -J. Singular vector structure and evolution of a recurving tropical cyclone. Mon. Wea. Rev. 2009; 137: 505–524. 10.3402/tellusa.v64i0.19151.
- Klein P. M. Harr P. A. Elsberry R. L. Extratropical transition of western North Pacific tropical cyclones: midlatitude and tropical cyclone contributions to re-intensification. Mon. Wea. Rev. 2002; 132: 2240–2259.
- Langland R. H. Issues in targeted observing. Quart. J. R. Meteorol. Soc. 2005; 613: 3409–3425. 10.3402/tellusa.v64i0.19151.
- Lopez P. Moreau E. A convection scheme for data assimilation: description and initial tests. Quart. J. Roy. Meteor. Soc. 2005; 131: 409–436. 10.3402/tellusa.v64i0.19151.
- Mahfouf J. F. Rabier F. The ECMWF operational implementation of four-dimensional variational assimilation. II: experimental results with improved physics. Quart. J. Roy. Meteor. Soc. 2000; 126: 1171–1190. 10.3402/tellusa.v64i0.19151.
- McTaggart-Cowan R. Gyakum J. R. Yau M. K. The influence of the downstream state on extratropical transition: Hurricane Earl (1998) case study. Mon. Wea. Rev. 2003; 131: 1910–1929. 10.3402/tellusa.v64i0.19151.
- Morss R. E. Emanuel K. E. Influence of added observations on analysis and forecast errors: results from idealized systems. Quart. J. R. Meteorol. Soc. 2002; 128: 285–321. 10.3402/tellusa.v64i0.19151.
- Reynolds C. A. Peng M. S. Chen J. -H. Recurving tropical cyclones: singular vector sensitivity and downstream impacts. Mon. Wea. Rev. 2009; 137: 1320–1337. 10.3402/tellusa.v64i0.19151.
- Riemer M. Jones S. C. Davis C. A. The impact of extratropical transition on the downstream flow: an idealised modelling study with a straight jet. Q. J. R. Meteorol. Soc. 2008; 134: 69–91. 10.3402/tellusa.v64i0.19151.
- Ritchie E. A. Elsberry R. L. Simulations of the extratropical transition of tropical cyclones: phasing between the upper-level trough and tropical cyclones. Mon. Wea. Rev. 2007; 135: 862–876. 10.3402/tellusa.v64i0.19151.
- Szunyogh, I, Toth, Z, Majumdar, S, Morss, R, Etherton, B and co-authors. 2000. The effect of targeted observations during the 1999 winter storm reconnaissance program. Mon. Wea. Rev. 128, 3520–3537.
- Szunyogh I. Toth Z. Zimin A. V. Majumdar S. J. Persson A. Propagation of the effect of targeted observations: the 2000 winter storm reconnaissance program. Mon. Wea. Rev. 2002; 130: 1144–1165.
- Thorncroft C. D. Hoskins B. J. McIntyre M. E. Two paradigms of baroclinic-wave-life-cycle behaviour. Q. J. R. Meteorol. Soc. 1993; 119: 17–55. 10.3402/tellusa.v64i0.19151.
- Torn R. D. Hakim G. J. Initial condition sensitivity of western Pacific extratropical transitions determined using ensemble-based sensitivity analysis. Mon. Wea. Rev. 2009; 137: 3388–3406. 10.3402/tellusa.v64i0.19151.
- Weissmann, M, Harnisch, F, Wu, C. -C, Lin, P. -H, Ohta, Y and co-authors. 2011. The influence of assimilating dropsonde data on typhoon track and mid-latitude forecasts. Mon. Wea. Rev. 139, 908–920. 10.3402/tellusa.v64i0.19151.