Abstract
The high ice-covered topography of Greenland represents a significant barrier to atmospheric flow and, as a direct and indirect result, it plays a crucial role in the coupled climate system. The wind field over Greenland is important in diagnosing regional weather and climate, thereby providing information on the mass balance of the ice sheet as well as assisting in the interpretation of ice core data. Here, we identify a number of hitherto unrecognised features of the three-dimensional wind field over Greenland; including a 2500-km-long jet along the central ice sheet's western margin that extends from the surface into the middle-troposphere, as well as a similar but smaller scale and less intense feature along its eastern margin. We refer to these features as Greenland Plateau Jets. The jets are coupled to the downslope katabatic flow and we argue that they are maintained by the zonal temperature gradients associated with the strong temperature inversion over the central ice sheet. Their importance for Greenland's regional climate is discussed.
1. Introduction
Greenland's location, adjacent to the North Atlantic storm track, in combination with its height, size and ice-covered surface, results in it having an important influence on regional and global weather patterns (Kristjansson and McInnes, Citation1999; Petersen et al., Citation2004; Renfrew et al., Citation2008); as well as being an important repository of paleoclimate data on variability in the coupled climate system (Alley et al., Citation1993). For example, the Greenland ice sheet (GrIS) results in significant atmospheric flow distortion leading to the presence of intense low-level jets in the vicinity of Cape Farewell, Greenland's southernmost point, as well as along its southeast coastline, see for locations (Doyle and Shapiro, Citation1999; Moore and Renfrew, Citation2005). This flow distortion comes about when stably stratified air is advected towards a barrier that is sufficiently high that the flow is deflected around rather than passing over the barrier.
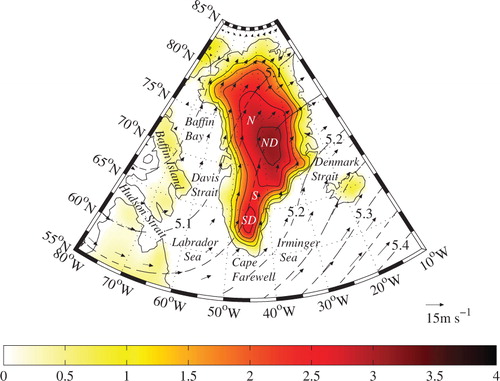
Fig. 1 The ERA-I topography (shading – km) and the winter mean (DJF) 500 mb geopotential height (contours – km) and the 500 mb horizontal wind (vectors – m/s). Locations in the coastal seas around Greenland are indicated as are the South Dome (SD), North Dome (ND), Saddle (S), and NGRIP (N) sites on the ice sheet.
Idealised studies (Smith, Citation1989; Olafsson and Bougeault, Citation1996, Citation1997; Petersen et al., Citation2003, Citation2004) with a focus on large obstacles such as Greenland have categorised the synoptic-scale situation via a non-dimensional mountain height, ĥ=Nh/U, where N is the Brunt–Väisälä frequency, h is the mountain height and U is the upstream wind component normal to the barrier. Generally there is blocking, with flow splitting around the obstacle, for ĥ greater than around 0.5–1; however this is dependent on the Rossby number as well as the aspect ratio of the obstacle (Smith, Citation1989; Olafsson and Bougeault, Citation1996, Citation1997).
The air–sea interaction associated with these orographic jets plays an important role in the ocean's meridional overturning circulation (Pickart et al., Citation2003). Barrier flow, that is flow directed parallel to the topographic barrier along the southeast coast of Greenland, (Moore and Renfrew, Citation2005; Harden et al., Citation2011) contributes to the equatorward transport of polar water through the Denmark Strait (Haine et al., Citation2009); as well as acting to modulate the ice–ocean interactions in fjords that contribute to the discharge of ice from glaciers in this region (Straneo et al., Citation2010).
Understanding the surface circulation over the GrIS itself is important for the interpretation of ice core records and mass balance changes (Hanna et al., Citation2008; Van den Broeke et al., Citation2009; Van Angelen et al., Citation2011a). Surface observations and numerical simulations indicate that the surface circulation over the GrIS is dominated by katabatic flow on its slopes that is forced by cooling over its central regions (Steffen and Box, Citation2001; Ettema et al., Citation2010). Wind speeds over the GrIS tend to be strongest during the winter months and less directionally constant over the South and North Domes (Cassano et al., Citation2001; Steffen and Box, Citation2001).
Schwerdtfeger (Citation1972) introduced the concept of ‘inversion wind’ to explain the vertical wind profile observed in central Greenland at Station Centrale near 71°N 41°W, elevation 2965 m asl by the French Polar Expedition (LeSchack, Citation1964). This data showed that the direction of the wind in the boundary layer was not constrained to follow the typical Ekman spiral but rather depended on the direction of the upper-level wind. Schwerdtfeger (Citation1972) argued that the presence of a temperature inversion over the sloping terrain of the GrIS led to a horizontal temperature gradient that, through the thermal wind relation, resulted in a vertical gradient in the along-slope component of the wind.
Using data from the Greenland Ice Margin Experiment (GIMEX), Van den Broeke and Gallée (Citation1996) identified a thermally driven barrier wind during the summertime along the west coast of Greenland near 67°N 50°W, elevation 150 m asl. This barrier wind was proposed to be the result of the thermal gradient across the transition zone between the (cold) ice cap and (warm) coastal tundra region that, through the thermal wind relationship, led to strong surface winds directed to the right of the ice margin, that is in the north-westerly direction. The dynamics behind these barrier winds were assumed to be similar to that occurring over the Weddell Sea to the east of the Antarctic Peninsula (Schwerdtfeger, Citation1975). In addition, Van den Broeke and Gallée (Citation1996) observed that melt rates during periods with strong barrier flow were twice as large as those occurring during periods characterised by strong katabatic flow; suggesting that barrier winds play an important role in the mass balance of the GrIS.
In the free troposphere, the circulation over the GrIS is dominated by the Canadian Polar Trough (CPT) (Shabbar et al., Citation1997) resulting in predominately southerly flow over the region at the 500 mb level (). The coupling of the upper-level and surface flow over the GrIS has not been examined in detail and for this reason, we have developed a new climatology of the three-dimensional wind field over Greenland that uses model-level data from the ECMWF Interim Reanalysis (ERA-I) (Dee et al., Citation2011). The relatively high spatial, both vertical and horizontal, resolution of this data set (compared to previous reanalyses) allows for a more complete view of the wind field in the vicinity of and over the GrIS than has been possible previously. We also argue that the inversion winds described by Schwerdtfeger (Citation1972) and the barrier winds described by Van den Broeke and Gallée (Citation1996) are local manifestations of the same phenomenon that we refer to as the Greenland Plateau Jet. As we shall show, these jets extend along both margins of the central GrIS and are coupled into the downslope katabatic flow. The jet along the western margin is the most pronounced and it has a meridional extent in excess of 2500 km as well as extending throughout the depth of the troposphere.
2. Data
The ERA-I has a T255 spectral truncation in the horizontal and uses a hybrid vertical co-ordinate with 60 levels that is terrain-following near the surface and gradually transitions to pressure levels with increasing height (Simmons and Burridge, Citation1981; Dee et al., Citation2011). The parameterisation of stable boundary layers in the underlying model agrees reasonably well with observations with respect to wind speed but tends to overestimate boundary-layer heights. This trait is in common with most numerical weather prediciton (NWP) stable boundary-layer parameterisations in that it is too diffusive resulting in temperature inversions that are too weak (Cuxart et al., Citation2006).
In the vicinity of Greenland, there were approximately 16 model levels within 2 km of the surface. For this study, we used the 6-hourly model-level data as well as the 10 m wind field data that are available at a horizontal resolution of 0.75° for the period from January 1979 to December 2012. Seasonal mean values of the 10 m vector winds and 10 m wind speed, as well as the horizontal vector winds, horizontal wind speed, pressure, temperature and geopotential height on model levels were calculated or used. In addition, the directional constancy of the horizontal wind at both 10 m and on model levels was also computed.
The latter field is defined as follows:where U and V are the zonal and meridional component of the wind with the over-bar representing the monthly mean average of the 6-hourly data. The directional constancy is a useful diagnostic measure of the persistence in the wind direction with a value of 1 representing unidirectional flow and a value of 0 representing no preferred direction (Parish, Citation1988; Moore, Citation2003; Parish and Cassano, Citation2003). For the purposes of this article, we will focus on winter (DJF) and summer (JJA) mean fields.
3. Results
presents a comparison between the 10 m wind speed data from the Greenland Climate Network (GC-Net) (Steffen and Box, Citation2001) with those from this study as well as a similar comparison with the Polar MM5 regional climate model (Box et al., Citation2004). For both comparisons, the 6-hourly model data were interpolated to the locations of the automatic weather stations and compared to the data at the corresponding time. Only the 15 stations used in the Polar MM5 comparison were used for the ERA-I comparison (Box et al., Citation2004). The agreement between the 10 m wind speeds from the ERA-I and the GC-Net is good with root mean square error (RMSE) of approximately 1 m/s and correlations of approximately 0.65. In comparison to the Polar MM5 results, the ERA-I has lower RMSE as well as higher correlations. It should be noted that the periods of comparison are not identical, as the aim is to demonstrate the quality of ERA-I, rather than inter-compare a reanalysis with a re-forecast. It should be noted that the GC-Net data are not assimilated into the ERA-I and so the two data sets are independent of each other.
Table 1. Comparison of the 10 m wind speed from Polar MM5 (Box et al., Citation2004) and from the ERA-I with the 10 m wind speed from the automatic weather stations of the GC-Net (Steffen and Box, Citation2001)
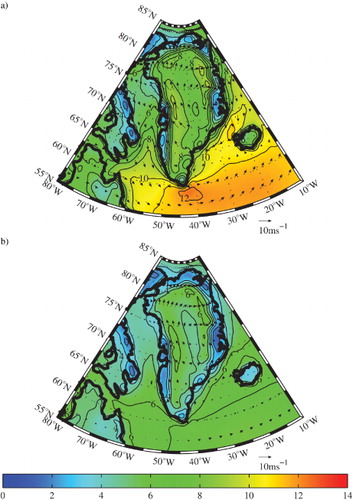
In , we present the winter (DJF) and summer (JJA) mean 10 m wind field. This figure qualitatively reproduces the known characteristics of the surface wind field in the vicinity of Greenland including: higher wind speeds during the winter (Steffen and Box, Citation2001); high wind speeds near Cape Farewell and along the Denmark Strait (Moore, Citation2003; Moore and Renfrew, Citation2005; Harden et al., Citation2011); anti-cyclonic circulation around the high topography of the North Dome; low wind speeds over the South and North Domes; and katabatic flow around the slopes of the GrIS (Van den Broeke et al., Citation1994; Stearns et al., Citation1997; Heinemann, Citation1999; Steffen and Box, Citation2001; Ettema et al., Citation2010). There is predominantly southerly flow over much of the western slopes of the GrIS during both summer and winter. During the summer months, there is also evidence of northerly flow along the eastern slopes of the GrIS. As we will discuss, these flows along the margins of the central GrIS are signatures of the phenomenon that we will refer to as the Greenland Plateau Jet.
Fig. 2 The ERA-I (a) winter mean (DJF) and (b) summer mean (JJA) 10 m wind speed (contours and shading – m/s) and vector wind (vectors – m/s) fields.
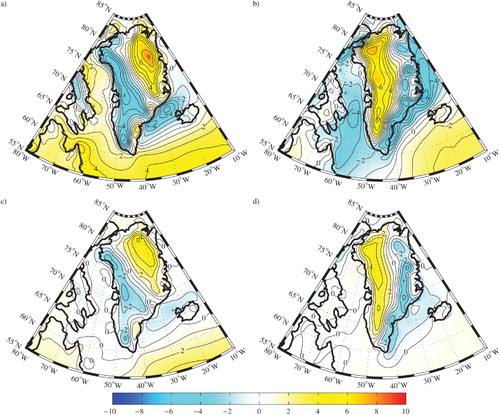
The characteristics of the surface flow over the GrIS and the coastal barrier flow can be more clearly seen in the zonal and meridional components of the winter and summer mean 10 m wind (). The zonal flow directed down the topographic gradient along the ice sheet's eastern and western margins is the downslope primarily katabatically forced flow (Heinemann and Klein, Citation2002). This flow is more intense during the winter months. The barrier winds along the southeast coast of Greenland are also evident as the north-easterly flow in this region that is again stronger during the winter. There is also southerly flow along the western margin of the GrIS that is present during both winter and summer, and extends along the length of Greenland from 62°N to 80°N (b and d); as well as northerly flow along the eastern margin of the GrIS that is also present during both seasons. However, it is most pronounced during the summer. Other features of the surface wind field include northerly flow during the winter along the northeast coast of Greenland that segues into the previously documented barrier flow south of the Denmark Strait (Van Angelen et al., Citation2011b; Moore, Citation2012). There is evidence of channel flow down Nares Strait (Samelson and Barbour, Citation2008) as well as enhanced northerly flow over Baffin Bay with a local extrema in the vicinity of the Davis Strait.
Fig. 3 The ERA-I winter mean (DJF): (a) zonal component and (b) meridional component of the 10 m wind (contours and shading – m/s) fields; the summer mean (JJA) (c) zonal component; and (d) meridional component of the 10 m wind (contours and shading – m/s) fields.
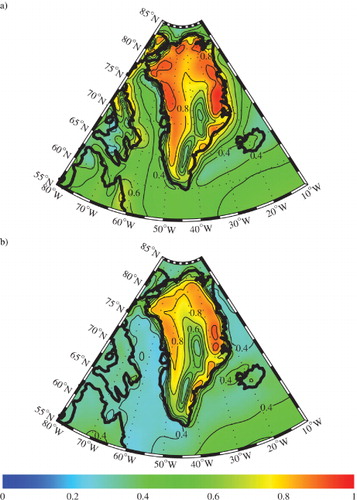
Information on the directional constancy of the 10 m wind over the GrIS can be found in . The figure clearly shows the high directional constancy of the 10 m wind along the eastern and western margins of the central GrIS that is collocated with the meridional flow associated with the plateau jets as well as the katabatic flow. The figure also confirms the previously documented low directional constancy over the high topography of the South and North Domes (Steffen and Box, Citation2001). Along the east and southeast coast of Greenland, there is high directional constancy during the winter (although not as high as over the GrIS) associated with the barrier winds in this region (Moore and Renfrew, Citation2005; Harden et al., Citation2011). There is also high directional constancy during the winter along the eastern coast of Baffin Island in the region where enhanced northerly flow was previously noted (b), and a local maximum in directional constancy along the topography to the south of Hudson Strait that is associated with enhanced westerly flow (a).
Fig. 4 The ERA-I (a) winter mean (DJF) and (b) summer mean (JJA) directional constancy of the 10 m wind speed (contours and shading).
The structure of the flow above the surface can be seen in and , which show the winter mean pressure, meridional component of the horizontal wind, temperature and directional constancy of the horizontal wind at 2.8 and 8 km asl. The topography in the vicinity of the North Dome is higher than 2.8 km asl and so the flow in the region that is ‘underground’ is not shown. There is a pronounced zonal gradient of the pressure field along the western margin of the GrIS at 2.8 km asl (a) that is associated with the enhanced southerly flow that occurs along this margin (b). There is also weaker northerly flow along the eastern margin of the GrIS at this height that is again associated with the zonal gradient in the pressure field along this margin. The temperature field at this height has a large-scale predominately northwest–southeast gradient with the coldest air being situated to the northwest of Greenland as well as a local minimum in temperature above the South Dome and enhanced gradients perpendicular to the topography along the margins of the North Dome (c). Finally, the directional constancy field at this height shows a region of low directional constancy above the South Dome as well as a pronounced region of high directional constancy along the western margin of the GrIS. At this height above sea level, there is no evidence of the high directional constancy associated with the barrier flow along the southeast coast of Greenland, confirming that these features of the wind field are shallow (Petersen et al., Citation2009; Harden et al., Citation2011).
Fig. 5 The ERA-I winter mean (DJF): (a) pressure (shading and contours – mb) and wind field (vectors – m/s); (b) meridional component of the wind (shading and contours – m/s); (c) temperature (shading and contours – K); and (d) directional constancy of the wind field (shading and contours) at 2.8 km. The area shaded in black is underground.
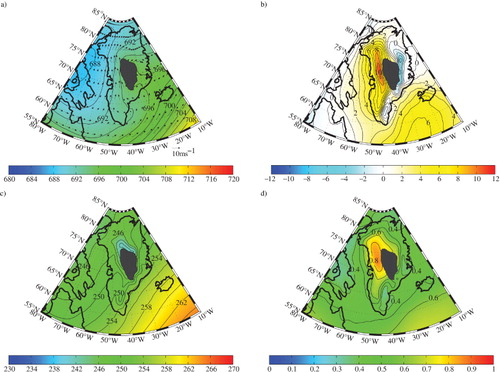
Fig. 6 The ERA-I winter mean (DJF): (a) pressure (shading and contours – mb) and wind field (vectors – m/s); (b) meridional component of the wind (shading and contours – m/s); (c) temperature (shading and contours – K); and (d) directional constancy of the wind field (shading and contours) at 8 km.
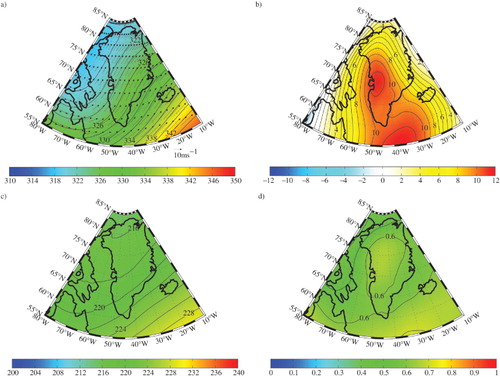
At 8 km asl (a), the flow is dominated by the CPT with no evidence of the topographic distortion in the pressure field present at 2.8 km asl (a). In association with the CPT, there is a local maximum in the meridional component of the horizontal wind at this height that is again much broader in scope than that associated with the plateau jet found at 2.8 km (b). There is another local maximum in the meridional component of the wind to the southeast of Greenland near 55°N 40°W that is associated with the main North Atlantic storm track. The temperature field at 8 km asl (c) shows only the predominately northwest–southeast gradient with no evidence of distortion due to the topography of Greenland. Finally, the directional constancy field at 8 km asl (d) is quite uniform, again unlike that observed at 2.8 km asl (d).
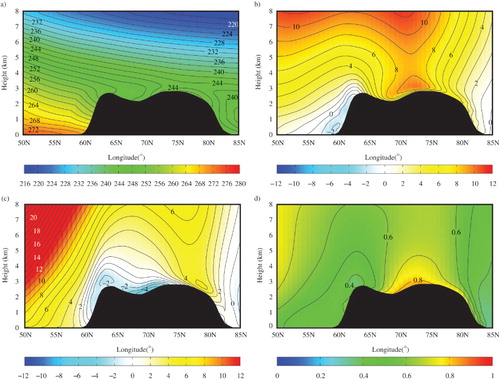
The vertical structure of the winter mean temperature and wind fields along 72°N, the cross-section that passes though the North Dome region, are shown in . The temperature cross-section (a) indicates a weak synoptic-scale zonal gradient with the coldest air being situated to the west with evidence of a strengthening of this gradient near the surface to the east of the GrIS. There is also evidence of a thermal inversion over the summit of the GrIS consistent with the known climatological stable boundary-layer conditions in this region (Steffen and Box, Citation2001; Cohen et al., Citation2007). The presence of the elevated cold surface of the GrIS and the resulting inversion also results in enhanced zonal temperature gradients of opposing sign along the western and eastern margins of the central GrIS.
Fig. 7 Zonal cross-section of the flow along 72°N from the ERA-I for the winter mean (DJF) flow: (a) the temperature field (K); (b) the meridional component of the wind (m/s); (c) the zonal component of the wind (m/s); and (d) the directional constancy of the horizontal wind.
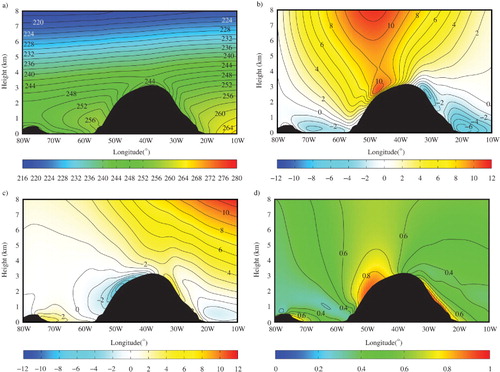
The cross-section of the meridional component of the wind (b) is dominated by two localised low-level extrema situated on either margin of the central GrIS that are the plateau jets identified previously. The western jet is characterised by southerly flow centred close to 45°W with a maximum of 10 m/s situated above the surface. Although it has a surface maximum, it is connected to the upper-level jet associated with the CPT (see also and ), that is the plateau jet stretches from the surface to mid-troposphere. The eastern jet is characterised by northerly flow with a maximum of 4 m/s near the surface centred close to 35°W. Distinct from this plateau jet, there is also a local extrema off the eastern coast of Greenland centred at 20°W (the barrier jet) that is characterised by northerly flow with a maximum of 6 m/s above the surface. Over Davis Strait, one can see the northerly flow is largest along the topography of Baffin Island suggesting that this circulation may also be a barrier flow.
The cross-section of the zonal component of the wind (c) indicates the presence of shallow down-slope flow along either margin of the GrIS that is associated with katabatic flow (Van den Broeke et al., Citation1994; Heinemann, Citation1999; Steffen and Box, Citation2001; Heinemann and Klein, Citation2002; Ettema et al., Citation2010). To the east of Greenland, the zonal wind speed increases with height as one appraches the core of the jet stream.
The cross-section of the directional constancy of the horizontal wind (d) is dominated by large values, in excess of 0.8, along the western margin of the GrIS that is associated with the western Plateau Jet as well as the katabatic flow in the region. As shown previously (d and d), the directional constancy in this jet decreases above the surface. The directional constancy associated with the eastern Plateau Jet, the katabatic flow in this region and the barrier flow along the Denmark Strait is not as large as that for the western jet. There is also high directional constancy along the topography of Baffin Island.
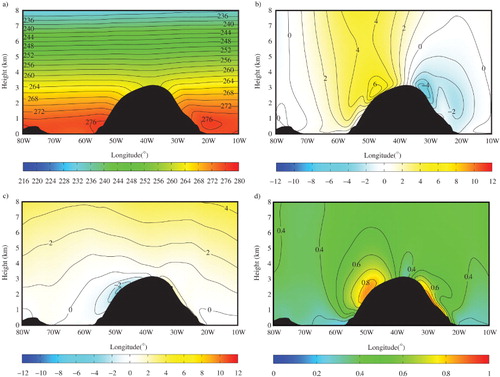
shows the same cross-sections as in except for summer mean conditions. In general, the circulation is less vigourous during the summer, as would be expected from the reduced thermal gradients, including the weakening of the inversion over the central GrIS. This results in reduced katabatic flow, as well as weakened barrier flow along the Denmark Strait. The meridional and zonal wind cross-sections are also more symmetric during the summer as compared to the winter. Indeed, both plateau jets are of approximately the same strength during the summer. The directional constancy field during the summer is quite similar to that during the winter with the only significant change being the reduction in the magnitude of this field over the Denmark Strait that is associated with the aforementioned reduction in the magnitude of the barrier flow.
Fig. 8 Zonal cross-section of the flow along 72°N from the ERA-I for the summer mean (JJA) flow: (a) the temperature field (K); (b) the meridional component of the wind (m/s); (c) the zonal component of the wind (m/s); and (d) the directional constancy of the horizontal wind.
shows the structure of the winter mean temperature and wind fields in a North-South cross-section along 45°W, the approximate centre of the western Plateau Jet. There is a broad-scale meridional temperature gradient with the coldest air being situated to the north of Greenland (a). Superimposed on this synoptic-scale temperature field is an inversion along the summit regions of the GrIS that attains its maximum along the point of highest topography near 75°N. Across both the South and North Dome regions, fine-scale structure in the temperature field results in local dipoles in the meridional gradient. The meridional structure of the western Plateau Jet is evident with southerly flow all along the summit region of the GrIS with a maximum in the vicinity of the high topography of the North Dome (b). The upper-level jets associated with the CPT and the North Atlantic stormtrack are also evident. Downslope primarily katabatic flows are also evident, that is northerly flow (south of the South Dome) and southerly flow (north of the North Dome), along the southern and northern margins of the GrIS (b). The zonal wind field is dominated by the strong upper-level winds associated with North Atlantic stormtrack and to a lesser degree by those associated with the CPT (c). In addition, along the summit region of the GrIS, there are three localised extrema in zonal wind field: easterly jets to the south of the South Dome and North Domes as well as a westerly jet to the north of the North Dome. As will be discussed below, these features are associated with the dipoles in the meridional gradient of the temperature field along the summit ridge. The directional constancy field is a maximum in the core region of the western Plateau Jet as well as in the vicinity of the westerly jet to the north of the North Dome.
Fig. 9 Meridional cross-section of the flow along 45°W from the ERA-I for the winter mean (DJA) flow: (a) the temperature field (K); (b) the meridional component of the wind (m/s); (c) the zonal component of the wind (m/s); and (d) the directional constancy of the horizontal wind.
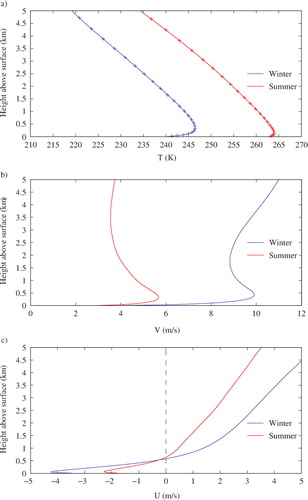
shows vertical profiles of the winter and summer mean temperature as well as the meridional and zonal wind at 72°N 45°W (at the intersection of the two cross-section planes shown in –). As noted in –, the presence of the cold surface of the GrIS can be seen to impact the low-level temperature field resulting in an inversion near the North Dome that is more pronounced during the winter. The low-level maximum in the meridional wind that is part of the western Plateau Jet is evident. The magnitude of this wind speed maximum is larger during the winter as is the vertical shear leading up into the CPT. The shallow easterly flow associated with the downlope katabatic flow can be seen in the zonal wind profile, again this is stronger in winter.
Fig. 10 The ERA-I winter mean (DJF) and summer mean (JJA) vertical profiles of: (a) temperature (K); (b) meridional component of the wind (m/s); and (c) zonal component of the wind (m/s) at 72°N 45°W. The vertical levels on which the data are available are indicated by the ‘ + ’ in (a).
4. Discussion
We have identified and characterised new jet-like structures along the margins of the central GrIS as well as describing the climatological features of the downslope katabatic flow that is also present in these regions. In this section, we will present an analysis of the dynamical processes responsible for these jets and their coupling with the katabatic flow. An inspiration for this analysis is that developed by Schwerdtfeger (Citation1975) with respect to barrier flow along the eastern boundary of the Antarctic Peninsula.
Schwerdtfeger presented two different but essentially equivalent ways to describe this phenomenon. In the first, he proposed that a temperature gradient exists between the cold ice-covered surface of the Weddell Sea and the adjoining Antarctic Peninsula that arises from the ascent and adiabatic cooling of the air. Through the thermal wind relation, this temperature gradient would result in vertical shear of the perpendicular (along-slope) component of the wind resulting in a decrease in wind speed with height. Alternatively, he proposed that the accumulation of the cold air along the coast of the Peninsula would result in a gradient in the pressure perpendicular to the coast that, through geostrophic balance, would result in southerly flow along the coast. This gradient would be strongest at the surface and its weakening with height would also result in a decrease in this along coast flow with height. Both scenarios would result in flow along the coast that decreased with height. Subsequently Parish (Citation1983) and Van den Broeke and Gallée (Citation1996) noted that frictional processes would result in maximum wind speeds occurring a few hundred metres above the surface.
The concept of barrier wind resulting from geostrophic flow in the presence of a normal temperature gradient has been used to explain the observations of enhanced surface flow along the southeast coast of Greenland near the Denmark Strait (Moore and Renfrew, Citation2005). Aircraft, modelling and climatological studies have all confirmed that these winds attain their maximum above the surface (Petersen et al., Citation2009; Harden et al., Citation2011).
In what follows, we will use these concepts to understand the dynamical processes behind the jets that we have identified. The basis is the concept of geostrophic balance:
where (x, y) are the directions perpendicular and parallel to the topography, (U g, V g) are the components of the geostrophic wind, T,P are the temperature and pressure fields, R is the ideal gas constant and f is the Coriolis parameter.
Under the assumption of hydrostatic balance and ignoring vertical gradients in T, one also has the thermal wind relationships (Andrews, Citation2010):
It must be emphasised that the geostrophic balance relationships are of course sufficient to define the geostrophic wind, including its vertical structure. Nevertheless, the use of the thermal wind relationships provides a simple way to diagnose changes in the geostrophic wind with height.
In , we present the vertical cross-sections of the two forcing terms, as well as V
g and V along 72°N for winter mean conditions. With respect to the zonal derivative of the pressure field (a), the cross-section shows surface-confined regions of negative values over the Davis Strait region to the west of Greenland as well as over the Denmark Strait to the east of Greenland. Over the western margin of the GrIS, there is a region of positive values that is also surface-enhanced but that extends up into the upper troposphere. While over the eastern margin of the GrIS, there is a surface-confined region of negative values that merges with the region over Denmark Strait.
Fig. 11 Zonal cross-section of the flow along 72°N from the ERA-I for the winter mean (DJF) flow: (a) the zonal derivative of the pressure field (mb/100 km); (b) the zonal derivative of the temperature field (K/100 km); (c) the meridional component of the geostrophic wind (m/s); and (d) the meridional component of the wind (m/s).
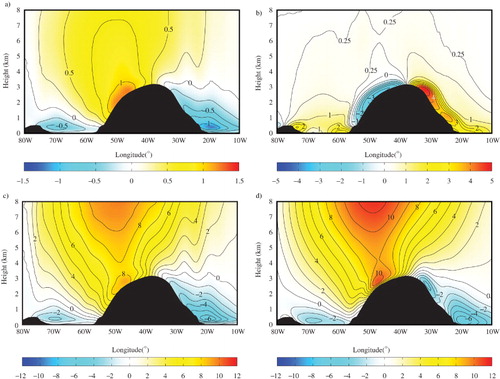
The cross-section of the zonal derivative of the temperature field shows a number of surface-confined features of either sign as well as a broad region of small but positive values that fills the region above the surface (b). The anomalies in this field that are of the largest magnitude are situated along either side of the summit region with a negative anomaly along its western margin and a positive anomaly along its eastern margin. Both arise from the presence of the cold elevated surface of the GrIS that results in temperature gradients of opposing sign with respect to the adjoining warmer air. Along the west coast, there is a region with a positive anomaly that arises from the adiabatic warming of the katabatic flow and so results in a situation where the air temperatures along the coast are warmer than those over the adjoining ice-covered waters (King et al., Citation1998; Renfrew and Anderson, Citation2002). There is no such anomaly along the east coast, although there is a reduction in the magnitude of the zonal gradients in the vicinity of the coast that may be the result of the same process. Offshore of the east coast, there is an increase in the magnitude of the positive anomaly that reflects the thermal gradient that exists between the ice-covered and the ice-free regions of the Denmark Strait.
The vertical cross-section of V g clearly shows the presence of the southerly flow along the western margin of the central GrIS as well as its connection with the upper-level jet associated with the CPT and the northerly flow along the eastern margin of the central GrIS (c). There is also evidence of northerly barrier flow along the east coast of Greenland over the Denmark Strait as well as similar barrier flow along the east coast of Baffin Island over the Davis Stait. The barrier flow along the Denmark Stait does extend along the eastern margin of the GrIS but does not exhibit a well-defined maximum as occurs along the western margin. A comparison with V (d) shows overall agreement indicating that to first order, the flow can be understood as being in geostrophic balance. There are, however, some important differences that include a smaller magnitude western Plateau Jet in V g compared to V as well as a more boundary-confined characteristic. The same is also true for the barrier winds over the Denmark Strait. In addition, the eastern Plateau Jet is well defined in the V cross-section, where it is clearly separated from the coastal barrier winds, while no such separation exists in the V g cross-section.
With respect to the thermal wind relationship, the vertical gradients of the two plateau jets are in agreement with the sign of , even though the details of the eastern Plateau Jet are ageostrophic in character. For the western Plateau Jet, the negative zonal temperature gradient requires a decrease in southerly flow with height, consistent with the reduced winds above the low-level plateau jet. The opposite applies for the eastern Plateau Jet. The same is also true for the barrier winds along the east coasts of Greenland and Baffin Island. Aloft, the positive zonal temperature gradient requires an increase of southerly flow with height as is observed in the CPT jet.
The coupling with the katabatic flow can be understood as resulting from the presence of frictional effects that are not included in the geostrophic analysis. Near the surface, there is a three-way balance between downslope pressure-gradient force, the Coriolis force and the frictional force (Lynch and Cassano, Citation2006). For the case of the western Plateau Jet, this balance results in downslope katabatic flow that is turned to the right of the terrain fall line (i.e. southeasterly near-surface flow as seen in a). Above the surface, the frictional effects become more muted resulting in approximately geostrophic balance and southerly flow that is parallel to the topographic gradient (a). As a result, the vertical strcuture of the meridional wind along the western margin of the GrIS (b) can be understood as resulting from the combined effects of the no-slip lower boundary condition that results in a positive vertical shear near the surface and the negative zonal thermal gradient associated with the surface inversion that results in a negative vertical shear above the surface. Once one is out of the boundary layer, the synoptic-scale positive zonal thermal gradient results in a reversal in the vertical shear that gives rise to the coupling with the CPT.
There is of course the issue of the ability of the ERA-I to resolve these shallow boundary-layer features. As mentioned previously, most NWP-stable boundary-layer parameterisations are overly diffusive resulting in temperature inversions that are too weak, and katabatic flow that is too diffuse (e.g. Renfrew and Anderson, Citation2006) although they can compare reasonably well with observations of wind speed (Cuxart et al., Citation2006). It is therefore possible that the ERA-I underestimates the magnitude of the thermal inversion and therefore may underestimate the magnitude of the plateau jets and detailed vertical structure of the katabatic flow.
To enable the best representation possible, and in the absence of any better climatological data sets, this study makes use of the ERA-I reanalysis data on terrain-following model levels and therefore, in contrast to data on pressure levels, retains the full vertical resolution of the underlying NWP model. The symbols on the temperature profiles in a show the heights of the model levels at this location and as one can see, there is sufficient vertical resolution to capture the surface temperature inversion as well as the surface characteristics of the horizontal wind field.
As discussed, the above-surface features of the plateau jets are geostrophic in nature and therefore should be resolvable in other reanalyses, even with lower resolution. To demonstrate this, the results obtained from the ERA-I were compared with those obtained from the NCEP Reanalysis (NCEPR) (Kalnay et al., Citation1996) and the Climate Forecast System Reanalysis (CSFR) (Saha et al., Citation2010). Both of these reanalyses are provided on pressure levels and therefore do not have the same vertical resolution in regions of high topography as is the case for the ERA-I model-level data. The NCEPR has a horizontal resolution of 2.5° and the CFSR has a horizontal resolution of 0.5°. In the vicinity of the North Dome, with a surface pressure of approximatly 700 mb, both the NCEPR and CFSR have a vertical resolution of 50 mb or approximately 500 m.
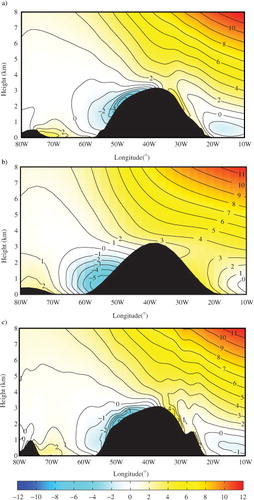
In , the winter mean cross-sections of the meridional wind and temperature fields along 72°N are shown for the period of overlap between the three reanalyses 1979–2009. With respect to the temperature field, neither the NCEPR nor the CFSR is able to fully capture the inversion over the central GrIS. This is most likely the result of the reduced vertical resolution, the different boundary-layer parameterisations, and the availability of the NCEPR and CFSR data only on pressure levels. All three reanalyses are able to capture the overall structure of the western Plateau Jet and its coupling with the CPT. As a result of its coarse horizontal resolution, the NCEPR does not fully resolve the jet's surface expression. The CFSR has a lower wind speed in the core of the jet as compared to the ERA-I that is most likely the result of the CFSR's reduced vertical resolution. The NCEPR is unable to resolve the eastern Plateau Jet as well as placing the core of the Denmark Strait barrier flow along the coast. In contrast, the CFSR is able to fully resolve these features. Please note that there are differences in the topography between the ERA-I and CFSR along the eastern margin of the GrIS at this latitude and as result, there are some differences in the coupling of these features. The structure of the meridional wind and temperature cross-sections with the ERA-I pressure-level data, which has a similar vertical resolution to that of the CFSR, is also able to capture the structure of the plateau jets albeit with a reduction in wind speed as compared to the ERA-I model-level representation. As was the case with the CFSR, the ERA-I pressure-level data were unable to fully resolve the inversion over the central GrIS.
Fig. 12 Zonal cross-section of the meridional component of the wind (solid contours and shading-m/s) and temperature (dashed contours – K) along 72°N from the: (a) ERA-I; (b) NCEPR; and (c) CFSR for the winter mean (DJF) during the period 1979–2009.
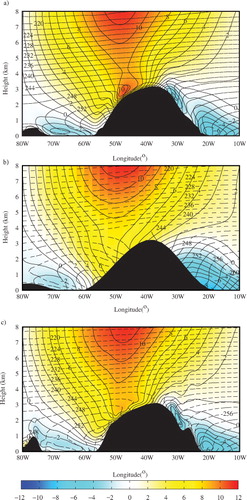
In , the winter mean cross-section of the zonal wind along 72°N are shown for the period of overlap between the three reanalyses. With respect to the structure of the katabatic flow along both margins of the GrIS, the CFSR and ERA-I are again in good overall agreement. There are some differences between these two reanalyses in the vicinity of Baffin Island that is most likely the result of differences in the topography in the region. In contrast, the NCEPR is unable to resolve the shallow nature of the katabatic flow along both margins.
Fig. 13 Zonal cross-section of the zonal component of the wind (shading and contours-m/s) along 72°N from the: (a) ERA-I; (b) NCEPR; and (c) CFSR for the winter mean (DJF) during the period 1979–2009.
5. Conclusions
A new climatology of the wind field over Greenland that uses relatively high-resolution model-level data covering a 33-yr period from the ERA-I presents a unified view of the impact that Greenland's topography has on atmospheric flow. Over the ice sheet itself, there is good agreement with AWS data from the GC-Net (). With the ERA-I, we have identified flow along the western and eastern slopes of the central ice sheet that we refer to as Greenland Plateau Jets. Similar although less pronounced jets are also observed along the southern margin of the South Dome, in the saddle region between the South and North Domes as well as to the north of the North Dome. In addition, barrier flow along the east coast of Baffin Island, over Baffin Bay, and its acceleration though the adjoining Davis Strait has also been identified. This flow may play a role in the climatological transport of sea ice and fresh water from the Arctic through Davis Strait and then onwards into the North Atlantic Ocean (Dickson et al., Citation2007).
The plateau jets that we have identified are all primarily geostrophic in nature and arise from enhanced normal pressure gradients that develop along the steep topography of the central GrIS. As such, we argue that they not artefacts of the ERA-I and indeed are present in other reanalyses. The pressure gradients are for the most part co-located with normal gradients in temperature that arise from the cold and ice-covered GrIS. The plateau jets are all surface-enhanced. This can be explained by appealing to the thermal wind balance or through the recognition that the corresponding pressure gradient is also surface-confined. In this sense, either of the explanations provided by Schwerdtfeger (Citation1975) as to the underlying dynamics of barrier flow also holds for the plateau jets. However, there is an important distinction. For the plateau jets, a component of the cross-jet thermal gradient is on a slope, hence providing a downslope pressure-gradient force (i.e. a katabatic force) which is not a part of Schwerdtfeger's barrier flow dynamical analysis. In fact, one could view the plateau jets as continent-scale examples of a combination of Schwerdtfeger's barrier winds and his inversion winds, as both large-scale pressure gradients (due to blocking) and boundary-layer scale pressure gradients (due to surface cooling) are important. From this perspective, the two phenomena, that is the plateau jets and the katabatic flow, are coupled and it is not possible to separate them.
For the most part, these flows have a jet core that is situated above the surface (–). This characteristic is not captured in the geostrophic flow and is the result of frictional processes at the surface (Parish, Citation1983; Van den Broeke and Gallee, Citation1996). The frictional processes at the surface also give rise to the downslope katabatic flow (Lynch and Cassano, Citation2006).
Given the strong dependence of these jets on the presence of the cold elevated surface of the GrIS, it is not surprising that they are strongest along the western margin of the GrIS as well as during the winter months. Given this dependence, it is somewhat surprising that the eastern Plateau Jet is better defined as a distinct feature during the summer. This is likely a result of the weaker synoptic forcing during this season that reduces the impact of transient extra-tropical cyclones that are common to the east of Greenland during the winter months. In this sense, the flow during the summer months along the eastern margin of the GrIS is closer to what would be expect to occur in response to the thermal forcing alone. To the west of Greenland, the synoptic forcing is often weak even during the winter and so the flow in this region is more likely to be thermally driven.
The plateau jets’ existence explains the different near-surface wind regimes observed around the North Dome and its ice core sites (Steffen and Box, Citation2001). In particular, the anti-cyclonic circulation around the North Dome with flow directed perpendicular to the topographic gradient identified by Stearns et al. (Citation1997) can be understood as arising from the presence of the four plateau jets identified in and . In addition, the south-easterly flow across the saddle region between the South and North Domes can be seen to be associated with the plateau jet that is present in this region (c). In addition, Steffen and Box (Citation2001) noted that the GISP site, located in the centre of the North Dome, was characterised by winds of low directional constancy while those at the nearby NGRIP site were characterised by southerly flow. The NGRIP site is located to the northwest of the GISP site () and therefore is influenced by the western Plateau Jet. It follows that this difference in wind regime may impact our interpretation of these ice cores.
Finally, the intensity of the plateau jets is determined by the structure of the temperature field over the GrIS. It follows that any changes to this field that occur due to natural or anthropogenic climate variability may play a role in modulating their intensity (Mote, Citation2007).
6. Acknowledgements
The authors thank the ECMWF for access to the ERA-I and the GC-Net for access to the AWS data. They also thank M. Van den Broeke and the anonymous reviewers for useful discussions regarding this paper. G. W. K. M. was supported by the Natural Sciences and Engineering Research Council of Canada. I. A. R.'s contributions to this work were supported NERC grants NE/C003365/1 and NE/I028297/1. J. J. C.'s contributions to this work were supported by the United States Department of Energy grant DE-SC0006178.
Related Research Data
References
- Alley R. B. , Meese D. A. , Shuman C. A. , Gow A. J. , Taylor K. C. , co-authors . Abrupt increase in Greenland snow accumulation at the end of the younger Dryas event. Nature. 1993; 362: 527–529.
- Andrews D. G . An Introduction to Atmospheric Physics. 2nd ed. Cambridge University Press, Cambridge, x, 237 pp.
- Box J. E. , Bromwich D. H. , Bai L . Greenland ice sheet surface mass balance 1991–2000: application of Polar MM5 mesoscale model and in situ data. J. Geophys. Res. 2004; 109: 1–21.
- Cassano J. J. , Box J. E. , Bromwich D. H. , Li L. , Steffen K . Evaluation of Polar MM5 simulations of Greenland's atmospheric circulation. J. Geophys. Res. 2001; 106: 33, 867–33, 889.
- Cohen L. , Helmig D. , Neff W. D. , Grachev A. A. , Fairall C. W . Boundary-layer dynamics and its influence on atmospheric chemistry at summit, Greenland. Atmos. Environ. 2007; 41: 5044–5060.
- Cuxart J. , Holtslag A. A. M. , Beare R. J. , Bazile E. , Beljaars A. , co-authors . Single-column model intercomparison for a stably stratified atmospheric boundary layer. Bound. Layer. Meteorol. 2006; 118: 273–303.
- Dee D. P. , Uppala S. M. , Simmons A. J. , Berrisford P. , Poli P. , co-authors . The ERA-interim reanalysis: configuration and performance of the data assimilation system. Q. J. Roy. Meteorol. Soc. 2011; 137: 553–597.
- Dickson R. , Lazier J. , Meincke J. , Rhines P. , Swift J . Current estimates of freshwater flux through Arctic and subarctic seas. Progr. Oceanogr. 2007; 73: 210–230.
- Doyle J. D. , Shapiro M. A . Flow response to large-scale topography: the Greenland tip jet. Tellus. A. 1999; 51: 728–748.
- Ettema J. , van den Broeke M. R. , van Meijgaard E. , van de Berg W. J . Climate of the Greenland ice sheet using a high-resolution climate model – Part 2: near-surface climate and energy balance. Cryosphere Discuss. 2010; 4: 603–639.
- Haine T. W. N. , Zhang S. , Moore G. W. K. , Renfrew I. A . On the impact of high-resolution, high-frequency meteorological forcing on Denmark Strait ocean circulation. Q. J. Roy. Meteorol. Soc. 2009; 135: 2067–2085.
- Hanna E. , Huybrechts P. , Steffen K. , Cappelen J. , Huff R. , co-authors . Increased runoff from melt from the Greenland ice sheet: a response to global warming. J. Clim. 2008; 21: 331–341.
- Harden B. E. , Renfrew I. A. , Petersen G. N . A climatology of wintertime barrier winds off southeast Greenland. J. Clim. 2011; 24: 4701–4717.
- Heinemann G . The KABEG'97 field experiment: an aircraft-based study of katabatic wind dynamics over the Greenland ice sheet. Bound. Layer. Meteorol. 1999; 93: 75–116.
- Heinemann G. , Klein T . Modelling and observations of the katabatic flow dynamics over Greenland. Tellus. A. 2002; 54: 542–554.
- Kalnay E. , Kanamitsu M. , Kistler R. , Collins W. , Deaven D. , co-authors . The NCEP/NCAR 40-year reanalysis project. Bull. Am. Meteorol. Soc. 1996; 77: 437–471.
- King J. C. , Varley M. J. , Lachlan-Cope T. A . Using satellite thermal infrared imagery to study boundary layer structure in an Antarctic katabatic wind region. Int. J. Rem. Sens. 1998; 19: 3335–3348.
- Kristjansson J. E. , McInnes H . The impact of Greenland on cyclone evolution in the North Atlantic. Q. J. Roy. Meteorol. Soc. 1999; 125: 2819–2834.
- LeSchack L. A . The French Polar effort and the expeditions Polaires Francaises. Arctic. 1964; 17: 2–14.
- Lynch A. H. , Cassano J. J . Applied Atmospheric Dynamics. 280. John Wiley, Chichester, England, x.
- Moore G. W. K . Gale force winds over the Irminger Sea to the east of Cape Farewell, Greenland. Geophys. Res. Lett. 2003; 30: 1–4.
- Moore G. W. K . A new look at Greenland flow distortion and its impact on barrier flow, tip jets and coastal oceanography. Geophys. Res. Lett. 2012; 39: 1–5.
- Moore G. W. K. , Renfrew I. A . Tip jets and barrier winds: a QuikSCAT climatology of high wind speed events around Greenland. J. Clim. 2005; 18: 3713–3725.
- Mote T. L . Greenland surface melt trends 1973–2007: evidence of a large increase in 2007. Geophys. Res. Lett. 2007; 34: 1–4.
- Olafsson H. , Bougeault P . Nonlinear flow past an elliptic mountain ridge. J. Atmos. Sci. 1996; 53: 2465–2489.
- Olafsson H. , Bougeault P . The effect of rotation and surface friction on orographic drag. J. Atmos. Sci. 1997; 54: 193–210.
- Parish T. R . The influence of the Antarctic Peninsula on the wind-field over the western Weddell Sea. J. Geophys. Res. 1983; 88: 2684–2692.
- Parish T. R . Surface winds over the Antarctic continent – a review. Rev. Geophys. 1988; 26: 169–180.
- Parish T. R. , Cassano J. J . The role of katabatic winds on the Antarctic surface wind regime. Mon. Wea. Rev. 2003; 131: 317–333.
- Petersen G. N. , Olafsson H. , Kristjansson J. E . Flow in the lee of idealized mountains and Greenland. J. Atmos. Sci. 2003; 60: 2183–2195.
- Petersen G. N. , Kristjansoon J. E. , Olafsson H . Numerical simulations of Greenland's impact on the Northern Hemisphere winter circulation. Tellus. A. 2004; 56: 102–111.
- Petersen G. N. , Renfrew I. A. , Moore G. W. K . An overview of barrier winds off southeastern Greenland during GFDex. Q. J. Roy. Meteorol. Soc. 2009; 135: 1950–1967.
- Pickart R. S. , Spall M. A. , Ribergaard M. H. , Moore G. W. K. , Milliff R. F . Deep convection in the Irminger Sea forced by the Greenland tip jet. Nature. 2003; 424: 152–156.
- Renfrew I. A. , Anderson P. S . The surface climatology of an ordinary katabatic wind regime in Coats Land, Antarctica. Tellus. A. 2002; 54: 463–484.
- Renfrew I. A. , Anderson P. S . Profiles of katabatic flow in summer and winter over Coats Land, Antarctica. Q. J. Roy. Meteorol. Soc. 2006; 132: 779–802.
- Renfrew I. A. , Petersen G. N. , Outten S. , Sproson D. , Moore G. W. K. , co-authors . The Greenland flow distortion experiment. Bull. Am. Meteorol. Soc. 2008; 89: 1307–1324.
- Saha S. , Moorthi S. , Pan H.-L. , Wu X. , Wang J. , co-authors . The NCEP climate forecast system reanalysis. Bull. Am. Meteorol. Soc. 2010; 91: 1015–1057.
- Samelson R. M. , Barbour P. L . Low-level jets, orographic effects, and extreme events in Nares Strait: a model-based mesoscale climatology. Mon. Wea. Rev. 2008; 136: 4746–4759.
- Shabbar A. , Higuchi K. , Skinner W. , Knox J. L . The association between the BWA index and winter surface temperature variability over eastern Canada and west Greenland. Int. J. Clim. 1997; 17: 1195–1210.
- Schwerdtfeger W . Vertical variation of wind through friction-layer over Greenland ice cap. Tellus. A. 1972; 24: 13–16.
- Schwerdtfeger W . Effect of Antarctic Peninsula on temperature regime of Weddell Sea. Mon. Wea. Rev. 1975; 103: 45–51.
- Simmons A. J. , Burridge D. M . An energy and angular-momentum conserving vertical finite-difference scheme and hybrid vertical-coordinates. Mon. Wea. Rev. 1981; 109: 758–766.
- Smith R. B . Hydrostatic airflow over mountains. Adv. Geophys. 1989; 41: 1–41.
- Stearns C. R. , Weidner G. A. , Keller L. M . Atmospheric circulation around the Greenland Crest. J. Geophys. Res. 1997; 102: 13801–13812.
- Steffen K. , Box J . Surface climatology of the Greenland ice sheet: Greenland climate network 1995–1999. J. Geophys. Res. 2001; 106: 33951–33964.
- Straneo F. , Hamilton G. S. , Sutherland D. A. , Stearns L. A. , Davidson F. , co-authors . Rapid circulation of warm subtropical waters in a major glacial fjord in East Greenland. Nat. Geosci. 2010; 3: 182–186.
- Van Angelen J. H. , van den Broeke M. R. , van de Berg W. J . Momentum budget of the atmospheric boundary layer over the Greenland ice sheet and its surrounding seas. J. Geophys. Res. 2011a; 116: 1–14.
- Van Angelen J. H. , van den Broeke M. R. , Kwok R . The Greenland Sea jet: a mechanism for wind-driven sea ice export through Fram Strait. Geophys. Res. Lett. 2011b; 38: 1–7.
- Van den Broeke M. R. , Gallee H . Observation and simulation of barrier winds at the western margin of the Greenland ice sheet. Q. J. Roy. Meteorol. Soc. 1996; 122: 1365–1383.
- Van den Broeke M. R. , Duynkerke P. G. , Oerlemans J . The observed katabatic flow at the edge of the Greenland ice sheet during GIMEX-91. Glob. Planet. Change. 1994; 9: 3–15.
- Van den Broeke M. , Bamber J. , Ettema J. , Rignot E. , Schrama E. , co-authors . Partitioning recent Greenland mass loss. Science. 2009; 326: 984–986.