Abstract
The compensation between the meridional heat transports in the atmosphere and ocean is studied through a coupled model's water-hosing experiments. It is found that the atmospheric heat transport (AHT) change compensates the oceanic heat transport (OHT) change very well in the extratropics, while the former over-compensates the latter in the tropics. Similar to previous studies, the fresh water input in the high latitude Atlantic weakens the Atlantic meridional overturning circulation and thus the northward Atlantic OHT significantly, leading to a warming (cooling) in sea surface temperature in the Southern (Northern) Hemisphere and in turn a southward shift of atmospheric convection. This results in an enhanced Hadley Cell (HC) and stronger northward AHT, compensating the reduced Atlantic OHT. Meanwhile, the wind-driven Subtropical Cell in the Indo-Pacific oceans is enhanced in response to the HC change, increasing the northward OHT in the Indo-Pacific, which partly offsets the reduced OHT in the Atlantic. The response in the Indo-Pacific is responsible for the overcompensation of the AHT to the global OHT. The Held's mechanism works very well in the tropical Indo-Pacific in our experiments. This is substantially different from previous studies.
1. Introduction
Assessing the meridional heat transport (MHT) and its oceanic and atmospheric partition is a classical question of climate research (Carissimo et al., Citation1985; Vallis and Farneti, Citation2009). Early in the 1970s, Vonder Haar and Oort (Citation1973) estimated the MHT using the satellite observation of radiative fluxes. One robust feature of the total MHT is that Earth's climate system is maintained by a hemispherically antisymmetric poleward heat transport with the peak value of about 5.5 PW (1 PW=1015 W) at 35°N/S (e.g. Trenberth and Carton, Citation2001). Another robust feature of the MHT is that the atmospheric heat transport (AHT) dominates poleward at about 30°N/S while the oceanic heat transport (OHT) dominates in the deep tropics (Held, Citation2001; Wunsch, Citation2005; Czaja and Marshall, Citation2006).
Previous studies suggest that for a steady Earth climate, the changes in the AHT and OHT tend to be compensated on decadal and longer time scales – this is called ‘Bjerknes compensation’ (Shaffrey and Sutton, Citation2006; Van der Swaluw et al., Citation2007). In the 1960s, Jacob Bjerknes first suggested that if the top of atmosphere (TOA) fluxes and the oceanic heat storage did not vary too much, the total energy transport by the climate system would not vary too much either (Bjerknes, 1964). This implies that any large variations of oceanic and atmospheric energy transport should be equal and opposite. This simple scenario has become known as Bjerknes compensation. It would be a critical constraint that might reduce the degree of freedom or uncertainty of the climate system.
Generally, there are two approaches to study Bjerknes compensation. One approach is to check it in the frame of internal climate variability (Shaffrey and Sutton, Citation2006; Van der Swaluw et al., Citation2007; Farneti and Vallis, Citation2013). The other way is to check it under significant external forcings (Zhang and Delworth, Citation2005; Cheng et al., Citation2007; Vellinga and Wu, Citation2008; Laurian et al., Citation2009; Drijfhout, Citation2010). The Bjerknes compensation in the changes of MHT are found in both scenarios. However, the compensation ‘structure’ and mechanisms in these two scenarios are radically different. The former (latter) suggests that Bjerknes compensation is valid in the high (low) latitudes. Even in the latter scenario, although the responses of the atmosphere and ocean circulations as well as their thermal structures are more or less the same in the water hosing (WH) runs of different models, the compensation structure is different among different models. In Vellinga and Wu (Citation2008) (VW08), the compensation is very efficient at low latitudes and nearly complete at the equator, but is incomplete farther north across the northern mid-latitude storm tracks. The maximum AHT change occurs right on the equator while the maximum OHT change occurs near 20°N. In Zhang and Delworth (Citation2005) (ZD05), the compensation situation is similar to that in VW08, but the maximum AHT change occurs around 15–20°N. The overcompensation of AHT to OHT in VW08 and ZD05 is not significant. In Cheng et al. (2007) (CBC07), the compensation is quite good from the low latitudes to 40°N. The maximum changes in AHT and OHT occur around 20–30°N. Instead of overcompensation, there is a slight undercompensation in the tropics and strong undercompensation in the high latitudes (40°N poleward).
Although those modelling studies have recognised its existence in the climate change, Bjerknes compensation is still not well-established because of the fundamental controversies on its applicability. Most important currently Bjerknes compensation has not been validated from the observations. Even if the data were available, the direct calculation of ocean and atmosphere heat transport from velocity and temperature fields would contain a big error, which might be even bigger than the absolute values of AHT and OHT (Wunsch, Citation2005) and may result in being unfeasible to validate the Bjerknes compensation in the real world. The validity of Bjerknes compensation turns out to be dependent on the timescale and latitudes as well as the models (Shaffrey and Sutton, Citation2006; Vellinga and Wu, Citation2008).
The Bjerknes compensation is worthy of extensive and thorough exploration. It is investigated in this work in a fully coupled climate model through WH experiments, following the approach in VW08. It is found that the changes in the AHT and OHT are generally consistent with VW08. In our work, the compensation is very good in both low and northern mid-latitudes. The maximum changes in AHT and OHT occur around 10°N and 20°N, respectively. There is a strong overcompensation of AHT to OHT around 10°N. The overcompensation magnitude is about 50% of the total AHT change. This is significantly different from VW08, ZD05 and CBC07, where either the overcompensation is trivial or there is undercompensation instead. In our hosing experiments, the change in the TOA flux is insignificant because no additional thermal forcing is included in the system. The ocean changes first due to the suppression of the deep water formation in the high-latitude Atlantic, and then the atmosphere in the low–mid-latitudes adjusts quickly to the varying ocean. The ocean wind-driven circulation changes again in response to atmosphere change. This causes the compensation and overcompensation in different latitudes.
The Fast Ocean-Atmosphere Model (FOAM) (Jacob, Citation1997) is used in this work. FOAM is computationally efficient and has been used extensively to simulate the global climate in the past, present and future (e.g. Yang and Liu, Citation2005). Two long WH integrations are preformed, in which 0.1 Sv and 1 Sv fresh water are injected into the North Atlantic basin (50–70°N, 70°W–15°E) for 2000 yr, respectively. For comparison, a parallel control run is also integrated for the same length. By the end of integration the climate is nearly in equilibrium. The responses averaged over the last 200 yr of the integration are treated as the equilibrium climate sensitivity. Monthly data of 200 yr are used. The results from 0.1 Sv and 1 Sv WH experiments are qualitatively similar. In this paper, only the results from the 1 Sv WH experiment are discussed in detail. The Atlantic meridional overturning circulation (AMOC) is reduced by about 90% in the 1 Sv WH experiment. The meridional OHT is reduced by 15%, while the AHT is enhanced about the same magnitude. The total MHT change is much smaller than the AHT and OHT changes. The mechanism of the AMOC impact on the wind-driven circulation is also discussed.
2. Heat transport compensation
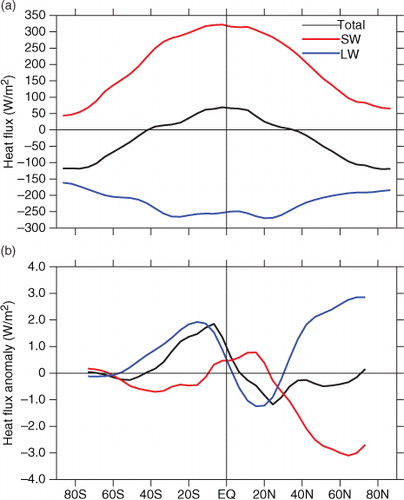
The total MHT in our experiment is nearly hemispherically antisymmetric, with the maximum poleward transport occurring around 40°N/S. The AHT plays a leading role in the MHT poleward of about 10°N/S while the OHT dominates in the deep tropics (a). This general picture of the MHT is consistent with previous studies (e.g. Trenberth and Caron, Citation2001). Compared with the control run, the net radiative flux at the TOA does not vary too much in the WH run. shows the radiation at the TOA in the control, and their changes in the WH experiment. It is seen that, generally, the long-wave (LW), the short-wave (SW) and the net radiation forcing change within 2% range of the respective total values. Specifically, in the northern extratropical region (25°N northward), the changes in the SW and LW are big but tend to be compensated with each other, so that the net radiation forcing changes the least. In this region, the decrease in the SW (red line in b) is due to the increase of the planet albedo, which in turn may result from more sea ice in the high latitudes. The decrease in the outgoing LW at the TOA (positive LW change, blue line in b) is due to the decrease in the surface temperature. In the region between 30°S and 25°N, the net radiation change is big and appears to be determined by the LW change. In general for the radiation changes averaged within 30°S and 25°N, the net radiation change is positive due to less outgoing LW, which is related to the more convective clouds. The extra energy surplus in the tropical air-sea system has to be transported northward by the atmosphere and ocean circulation, which is thought to be the Hadley Cell (HC) and Indo-Pacific Subtropical Cell (STC).
Fig. 1 (a) The net radiation flux (black), the net downward short wave (SW) (red) and net outgoing long wave (blue) at the top of atmosphere (TOA). (b) The changes of the TOA radiation flux in the WH experiment. Black, red and blue are for net total, SW and LW, respectively. The mean values from the control run have been subtracted. All data used in this paper is averaged over the last 200 years of the 2000-yr run.
Although the total MHT change is small (a), the changes in the AHT and OHT are remarkable, with the similar magnitude but opposite signs (b and c), showing compensation with each other to some extent. The compensation rate (see definition in Van der Swaluw et al., Citation2007) varies from the minimum 50% at 10°N to about 80% at other latitudes. The Bjerknes compensation hypothesis seems to be valid during the re-establishment of the equilibrium climate in the WH situation.
Fig. 2 (a) Meridional heat transport of total (black), atmosphere (red), ocean (blue) in the control run (solid lines) and water hosing (WH) run (dashed lines); (b) Meridional ocean heat transport in control run (solid) and WH run (dashed). Black lines are for global oceans, red for the Atlantic and blue for the Indo-Pacific; (c) The changes of the meridional heat transport in the WH run. Solid red (blue) is for the atmosphere (global oceans) and solid black represents the sum of atmosphere and ocean. Dashed (dash-dotted) blue is for the Atlantic (Indo-Pacific) and the dashed black represents the sum of atmosphere and Atlantic ocean. Unit: PW, 1 PW = 1015 W.
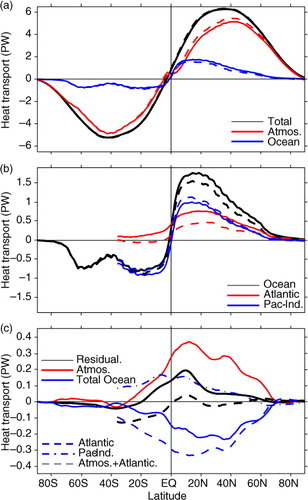
In fact the AHT and OHT changes compensate very well in the extratropics. In the tropics, the AHT overcompensates the southward OHT change by about 50% (solid black line in c). This overcompensation is statistically significant when compared to the individual changes in both the AHT and OHT. The most remarkable overcompensation occurs in the tropics within 20°N/S. The AHT changes the most near 10°N, which is related to the HC change in the tropics. The global OHT changes the most near 30°N, which results from the combined effect of the weakened AMOC and the strengthened Indo-Pacific STC. A decomposition of the global OHT shows that the Atlantic OHT (dashed blue in c) almost mirrors the AHT change while the Indo-Pacific OHT changes the most in the tropics (dash-dotted blue). The former has the maximum near the 10°N and is consistent with the suppression of the AMOC. The latter results from the enhanced (weakened) STC in the Northern Hemisphere (NH) (Southern Hemisphere, SH), which is in turn forced by the HC change. It is seen that the residual of the compensation (solid black) coincides mostly with the Indo-Pacific OHT change (dash-dotted blue), and this is particularly clear in the NH. We will return to this with more details further on.
3. Global responses
The AMOC, the HC and the STC play dominant roles in the changes of the Atlantic OHT, the AHT and Indo-Pacific OHT, respectively, during the different stages of the re-establishment of the equilibrium climate in the WH experiment. Specifically, the fresh water input in the high latitude Atlantic slows down the AMOC, and thus reduces the Atlantic OHT significantly. This produces a dipole response in the Atlantic, with a cooling (warming) in the North (South) Atlantic, consistent with those in most previous studies (Zhang and Delworth, Citation2005; Stouffer et al., Citation2006; Cheng et al., Citation2007; Vellinga and Wu, Citation2008; Laurian et al., Citation2009). Furthermore, a similar sea surface temperature (SST) gradient is also produced in the Pacific and Indian oceans through equatorial atmospheric teleconnection (Zhang and Delworth, Citation2005; Wu et al., Citation2007). The enhanced meridional SST gradient across the global tropics causes a southward shift of atmospheric convection, that is, the ascending branch of the HC, enhancing the AHT towards the NH (Zhang et al., Citation2010). This change speeds up the easterly trade wind and in turn, the STC in the tropical Indo-Pacific oceans (Liu, Citation1994), eventually increasing the wind-driven OHT in the tropics. Compared with the persistent fresh water input in the high latitude that leads to the collapse of AMOC, the STC change appears to have little feedbacks to the HC and AMOC. The detailed changes in the ocean and atmosphere are depicted in the following text.
3.1. Changes in the global SST and Atlantic
Due to the massive fresh water input (1 Sv) in the high latitudes of North Atlantic, the surface salinity is lowered by as much as 16 psu, which results in surface density decrease by as much as 6 kg/m3 (a). This builds a very strong pycnocline in the deep water formation region (near 60°N), which eventually shuts down the AMOC. The AMOC is reduced by 90% in the first few years and its maximum is reduced to less than 2 Sv in the final state (a), similar to previous studies (e.g. Mignot et al., Citation2007; Stouffer et al., Citation2007). As a result of AMOC shutdown and associated northward OHT reduction, the SST change shows a dipole pattern (b), in which a strong cooling occurs in the north Atlantic, in accompany with a weak warming in the SH and a weak cooling in the north Pacific due to atmospheric teleconnection (Zhang and Delworth, Citation2005). This SST change is also consistent with the change in the net TOA radiation. In our WH run, the net downward TOA anomaly is positive (negative) in the SH (NH) (black line in b), indicating a positive (negative) ocean heat uptake in the SH (NH).
Fig. 3 (a) SSS (shaded) and surface density (contours) changes and (b) SST change in the WH run. The contour intervals (CI) are 1 psu, 1 kg/m3 and 1°C for SSS, density and SST, respectively. Mean values from the control run are removed.
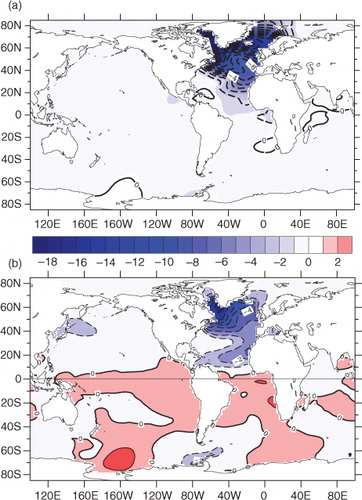
Fig. 4 (a) The mean Atlantic meridional overturning circulation (AMOC) in the control run (contours, CI=4 Sv) and in the WH run (shaded, CI= 2 Sv). (b) The latitude-depth section of zonal averaged Atlantic temperature change in the WH run (CI = 0.5°C). (c) The mean subtropical cell (STC) in the Indo-Pacific in the control run (contours, CI = 5 Sv) and the STC change in the WH run (shaded, CI = 1 Sv). (d) Same as (b) but for the Indo-Pacific.
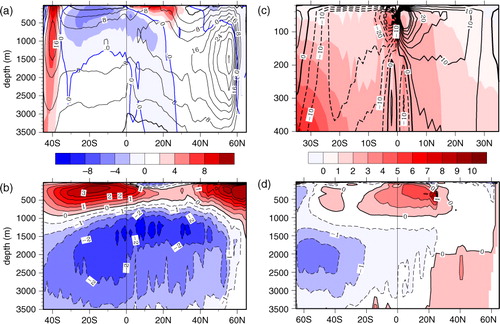
It is worth noting that the Atlantic OHT is only reduced by 40–50% in the northern tropics (b, c), much lower in the extent than the 90% reduction in the AMOC. This occurs partly because a portion of the OHT is associated with the shallow wind-driven circulation, such as the Atlantic STC. Even in the absence of AMOC, the wind-driven circulation will transport heat poleward as long as the vertical temperature stratification exists. In addition, the vertical temperature stratification is generally enhanced in response to the AMOC collapses (b), leading to an increased OHT. The reduced deep water formation in the north Atlantic causes a baroclinic response in the subsurface ocean and eventually warms up the subsurface water (Chang et al., Citation2008). However, the intermediate to bottom water becomes colder because of reduced downwelling (w’>0, dT/dz>0, so –w'dT/dz<0) of the relatively warm water in the upper ocean (b). The vertical temperature structure is one of two factors in determining the OHT. The enhanced stratification in turn increases the OHT. Here the stratification plays an opposite role to the mass transport in the change of OHT, and it actually plays as a recovering mechanism to the OHT change.
To further clarify this question, we have decomposed the Atlantic OHT change into the change due to the AMOC and the change due to the stratification. It is seen that in north Atlantic (20°N–60°N), the stratification contribution is opposite to the AMOC contribution. The magnitude of the former (blue line in a) can be as large as 50% of the latter (red line in a). This confirms that in the WH run, although the AMOC reduction causes significant northward heat transport loss, the enhanced stratification (b) can partly make up the loss. There is a partial compensation between the two components of OHT in the mid–high-latitude Atlantic.
Fig. 5 The meridional OHT change in the (a) Atlantic and (b) Indo-Pacific in the WH run. The black line shows the total OHT change; the red (blue) line represents the OHT change due to the circulation change (the vertical temperature stratification change). Unit in PW.
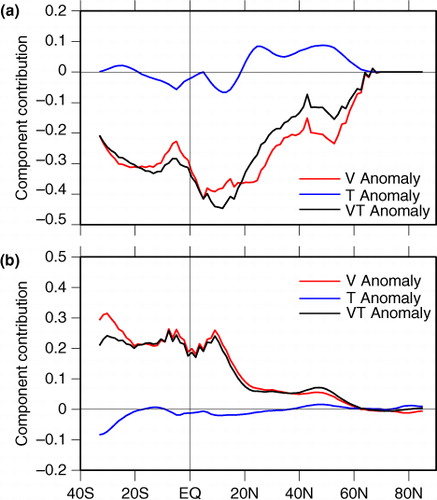
The stratification contribution in other latitudes (south of 20°N) is not significant. Although the vertical temperature stratification is enhanced in almost all latitudes (b), the circulation south of 20°N in the WH is a little bit more complex (a). The wind driven STC in the upper 1000 m is not that symmetric to the equator. For instance, in the northern tropics (0–20°N), the circulation in the upper 500 m is opposite to that below 500 m, which suggests opposite mass transport in the vertical. Therefore the vertical integrated MHT is small and shows slightly southward (blue line between 0–20°N in a). In the Southern basin, the mass transport in the upper 1500 m is also opposite to that below 1500 m, so the total MHT is small (blue line between 0–40°S in a).
3.2. Changes in the HC and Indo-Pacific
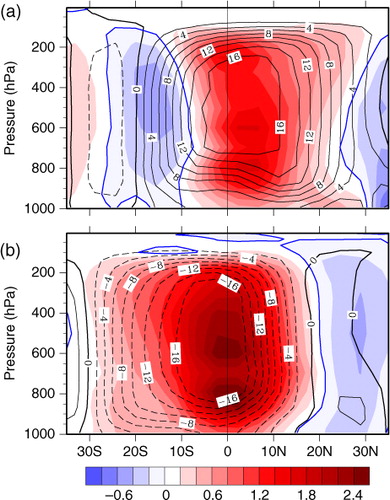
The HC changes significantly in the WH experiment. The surface cooling (warming) in the NH (SH) results in a southward shift of the ascending branch of atmosphere. Therefore, in boreal winter the HC is enhanced due to the enhanced ascending atmosphere in 0–10°S (a). In boreal summer the HC is weakened because the enhanced ascending in 0–20°S counteracts the descending atmosphere in the same latitudes (b). This HC change results in a northward anomalous AHT throughout a year, which largely compensates the reduced Atlantic OHT (c). The wind-driven overturning circulation, mainly the STC in the Indo-Pacific, changes accordingly in response to the HC change in the WH experiment (c). The northern (southern) branch of STC (mainly the equatorial cells) is strengthened (weakened) by about 20%, showing a strong coupling with the atmospheric HC changes. The concert changes in the HC and STC are consistent with the framework proposed by Held (2001), which suggests that in the tropics the atmospheric and oceanic transports would have to change proportionally with the same sign, in the case of a circulation anomaly, because both the atmosphere and ocean transports can be approximated as the Ekman transport due to strong coupling through surface zonal wind.
Fig. 6 The mean Hadley cell (HC) in the control run (contours, CI = 2×10¹⁰ kg/s) and the HC change in the WH run (shaded, CI = 0.2×10¹⁰ kg/s) in boreal (a) winter (DJF) and (b) summer (JJA). The blue lines show the zero contours of the mean HC.
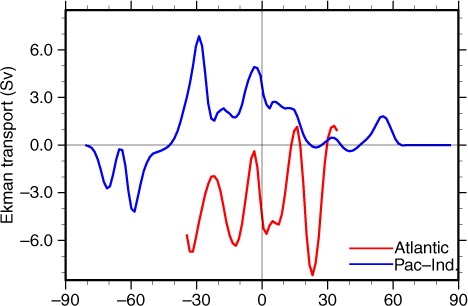
To verify Held's mechanism in our experiments, the Ekman transport change is examined in . It is seen that the Ekman transport increases mainly in the tropical Indo-Pacific. Consistent with the HC and STC changes, the northward Ekman transport anomaly occurs between 30°S–20°N, which is around 5–20% of the total northward Ekman transport. In the Atlantic, generally the overall northward Ekman transport is weakened. The enhanced Indo-Pacific STC manifests itself clearly as the northward Ekman transport anomaly in the whole tropics. The Held mechanism works very well here. The Indo-Pacific OHT change compensates the Atlantic OHT change by about 50% in the tropics (c), which eventually results in the overcompensation of the AHT to the global OHT. In short, here we see the consistent pictures: the positive anomalous HC change in the tropics results in anomalous northward AHT. In response to the HC change, the STC increases (decreases) in the NH (SH), resulting in anomalous northward OHT in both the hemispheres. The overcompensation of the AHT to the global OHT is resulted from the re-adjustment of the wind-driven circulation in the Indo-Pacific during the later stage of the climate shift in the WH world.
Fig. 7 The Ekman transport change in the Atlantic (red line) and Indo-Pacific (blue line) in the WH run. The Ekman transport is calculated as the zonal and vertical integration of poleward meridional velocity. The depth of integration is determined by the location where the meridional velocity direction is opposite to that in the surface layer.
3.3. Comparison between the Atlantic and Indo-Pacific
There are fundamental differences in the Atlantic and Indo-Pacific responses. First of all, in the Atlantic the subsurface warming occurs mainly in the mid–high-latitudes within the depth of 700 m (b), while that in the Indo-Pacific occurs mainly in the tropics within the depth of 1000 m (d). Second, the magnitude of subsurface response in the Indo-Pacific is much weaker than that in the Atlantic. Consistent with these different subsurface responses, in the northern Atlantic, the stratification contribution to the OHT change can be as large as 50% of the OHT change due to AMOC reduction (a). While in the Indo-Pacific, the OHT change due to the temperature change is negligible (b), and the enhanced OHT is exclusively due to the enhanced STC. In the WH run, the warmer surface water in the Indo-Pacific can transport to the subsurface by the enhanced STC (d). Since the NH SST is colder in WH run, the stratification in the upper layer of the tropical Indo-Pacific becomes weaker. Therefore, the stratification change in the Indo-Pacific cannot increase the efficiency of the STC. In short, in the Atlantic both the stratification and circulation changes should be paid attention to, while in the Indo-Pacific only the circulation change matters. These are fundamental differences between the Atlantic and Indo-Pacific Oceans.
4. Conclusions and discussions
The Bjerknes hypothesis is tested in the WH experiment. In general, the decrease of the global OHT can be compensated by the increase of the AHT. However, there is significant overcompensation in the tropics. In response to the fresh water forcing in the high-latitude Atlantic, the AMOC and thus the OHT are weakened significantly. The atmospheric HC adjusts quickly following the SST changes and causes the increase of the wind-driven northward OHT in the Indo-Pacific. It is worth noting that there are three stages of compensations in our WH run. First, in the mid–high-latitude Atlantic, the reduced OHT due to the AMOC shutdown is compensated partly by the enhanced OHT due to the strengthened temperature stratification (a). Second, the reduced Atlantic OHT is almost completely compensated by the enhanced AHT due to the HC change (c). Third, the enhanced Indo-Pacific OHT due to the HC change also partly compensates the weakened Atlantic OHT. It is the response in the Indo-Pacific that alleviates the weakening of the global OHT, and ultimately results in the overcompensation of the AHT to the OHT in the tropics.
In this paper only the final equilibrium state in the WH experiment is discussed. The detail analyses on the evolutions of the AMOC, the SST, the HC and the STC are underway. To identify the response timescale of these circulations, ensemble WH experiments have been performing. Preliminary results show that under the 1 Sv fresh water forcing, the AMOC reaches the quasi-equilibrium in 20 yr, and about 10 yr later, the SST reaches the stable state. The HC reaches the equilibrium in 50 yr and then the STC follows closely. Accordingly, as far as the MHT is concerned, the Atlantic OHT, the AHT and the OHT related to the wind-driven STC reach the equilibrium sequentially. The whole adjustment process is fulfilled in about 60 yr, which is much shorter than we expected. We are also currently performing ensemble 0.1 Sv WH experiments. It is expected that the evolution processes should be much slower.
The conclusions in this work are generally consistent with previous studies (e.g. VW08). This suggests that the Bjerknes compensation in the tropics might be a robust feature, although observational and more modelling studies are still needed. In VW08, the heat budget and cloud radiation forcings in the tropics are carefully examined. While our work focus on the analyses of the connection of the heat transport change with the dynamic consequences of circulations, based on the philosophy that in the sense of zonal average any imbalance of the net heat flux at the TOA or surface has to be transported meridionally by circulations. One of weaknesses of this work is that we did not consider the role of cloud feedbacks in the tropical heat transport. Cloud feedbacks could make the tropical responses much stronger, amplifying impact on the shift of tropical convection zone, weakening the degree of the compensation of the AHT and OHT (Kang et al., Citation2008; Zhang et al., Citation2010). We will provide detail analyses in our next work. Nevertheless, through these simple WH experiments, this study sheds light on a potential self-recovering mechanism in a complex climate system.
Acknowledgement
This work is jointly supported by the NSF of China (No. 40976007, 41176002) and the Norwegian Research Council through the East Asian DecCen project (No. 193690/S30). All the experiments are performed on the supercomputer at the Department of Atmospheric and Oceanic Sciences, Peking University.
Related Research Data
References
- Bjerknes J , Landsberg H. E , Van Mieghem J . Atlantic air-sea interaction. In Advances in Geophysics. 1964; New York: Academic Press. 1–82. Vol. 10.
- Carissimo B. C , Oort A. H , Vonder Haar T. H . Estimating the meridional energy transports in the atmosphere and ocean. J. Phys. Oceanogr. 1985; 15: 82–91.
- Chang P , Zhang R , Hazeleger W , Wen C , Wan X , co-authors . Oceanic link between abrupt changes in the North Atlantic Ocean and the African monsoon. Nat. Geosci. 2008; 1: 444–448.
- Cheng W , Bitz C. M , Chiang J. C. H . Adjustment of the global climate to an abrupt slowdown of the Atlantic meridional overturning circulation, ocean circulation: mechanisms and impacts. Geophys. Monogr. Series. 2007; 173: 295–313.
- Czaja A , Marshall J . The partitioning of poleward heat transport between the atmosphere and ocean. J. Atmos. Sci. 2006; 63: 1498–1511.
- Drijfhout S. S . The atmospheric response to a THC collapse: scaling relations for the Hadley circulation and the nonlinear response in a coupled climate model. J. Clim. 2010; 23: 757–774.
- Farneti R , Vallis G. K . Meridional energy transport in the coupled atmosphere-ocean system: compensation and partitioning. J. Clim. 2013. (in press).
- Held I. M . The partitioning of the poleward energy transport between the tropical ocean and atmosphere. J. Atmos. Sci. 2001; 58: 943–948.
- Jacob R . Low Frequency Variability in a Simulated Atmosphere Ocean System.
- Kang S.M , Held I.M , Frierson D. M. W , Zhao M . The response of the ITCZ to extratropical thermal forcing: idealized slab-ocean experiments with a GCM. J. Clim. 2008; 21: 3521–3532.
- Laurian A , Drijfhout S. S , Hazeleger W , van Dorland R . Global surface cooling: the atmospheric fast feedback response to a collapse of the thermohaline circulation. Geophys. Res. Lett. 2009; 36: L20708, DOI: 10.1029/2009GL040938.
- Liu Z . A simple model of the mass exchange between the subtropical and tropical ocean. J. Phys. Oceanogr. 1994; 24: 1153–1165.
- Mignot J , Ganopolski A , Levermann A . Atlantic subsurface temperatures: response to a shutdown of the overturning circulation and consequences for its recovery. J. Clim. 2007; 20: 4884–4898.
- Shaffrey L , Sutton R . Bjerknes compensation and the decadal variability of the energy transports in a coupled climate model. J. Clim. 2006; 19: 1167–1181.
- Stouffer R , Yin J , Gregory J , Dixon K , Spelman M , co-authors . Investigating the causes of the response of the thermohaline circulation to past and future climate changes. J. Clim. 2006; 19: 1365–1387.
- Stouffer R. J , Seidov D , Haupt B. J . Climate response to external sources of freshwater: North Atlantic versus the southern ocean. J. Clim. 2007; 20: 436–448.
- Trenberth K. E , Caron J. M . Estimates of meridional atmosphere and ocean heat transports. J. Clim. 2001; 14: 3433–3443.
- Vallis G. K , Farneti R . Meridional energy transport in the coupled atmosphere-ocean system: scaling and numerical experiments. Q. J. Roy. Meteorol. Soc. 2009; 135: 1643–1660.
- Van der Swaluw E , Drijfhout S. S , Hazeleger W . Bjerknes compensation at high northern latitudes: the ocean forcing the atmosphere. J. Clim. 2007; 20: 6023–6032.
- Vellinga M , Wu P . Relations between northward ocean and atmosphere energy transports in a coupled climate model. J. Clim. 2008; 21: 561–575.
- Vonder Haar T. H , Oort A. H . A new estimate of annual poleward energy transport by the oceans. J. Phys. Oceanogr. 1973; 3: 169–172.
- Wu L , He F , Liu Z . Atmospheric teleconnections of tropical Atlantic variability: interhemispheric, tropical-extratropical and cross-basin interactions. J. Clim. 2007; 20: 856–870.
- Wunsch C . The total meridional heat flux and its oceanic and atmosphere partition. J. Clim. 2005; 18: 4374–4380.
- Yang H , Liu Z . Tropical-extratropical climate interaction as revealed in idealized coupled climate model experiments. Clim. Dyn. 2005; 24: 863–879.
- Zhang R , Delworth T . Simulated tropical response to a substantial weakening of the Atlantic thermohaline circulation. J. Clim. 2005; 18: 1853–1860.
- Zhang R , Kang S , Held I. M . Sensitivity of climate change induced by the weakening of the Atlantic meridional overturning circulation to cloud feedback. J. Clim. 2010; 23: 378–389.