Abstract
The Regional Ocean Modeling System ocean model is used to simulate the decadal evolution of the regional waters in offshore Iberia in response to atmospheric fields given by ECMWF ERA-40 (1961–2001) and ERA-Interim (1989–2008) reanalyses. The simulated sea surface temperature (SST) fields are verified against satellite AVHRR SST, and they are analysed to characterise the variability and trends of coastal upwelling in the region. Opposing trends in upwelling frequency are found at the northern limit, where upwelling has been decreasing in recent decades, and at its southern edge, where there is some evidence of increased upwelling. These results confirm previous observational studies and, more importantly, indicate that observed SST trends are not only due to changes in radiative or atmospheric heat fluxes alone but also due to changes in upwelling dynamics, suggesting that such a process may be relevant in climate change scenarios.
1. Introduction
Coastal upwelling regions are rich in nutrients and essential for the trophic chain of coastal fish species. About 20% of the worldwide fish catchment is captured in coastal upwelling regions (Pauly and Christensen, Citation1995), although it is estimated that upwelling areas enclose less than 1% of the world oceans. Coastal upwelling is also an important climatic factor, contributing to cooler summers in the western coastal areas of continents. Due to the known impacts of coastal upwelling phenomena on coastal fishing communities and climate, the correct modelling of coastal upwelling trends is of great importance.
The Canary Current Eastern Boundary Upwelling Ecosystem, one of the major upwelling ecosystems in the world, encloses the western Iberian coast in its northern limit. Early studies of upwelling in this region using in situ (Barton et al., Citation1977) and remote sensing data (Fiuza et al., Citation1982) have looked at the different patterns of coastal upwelling due to the coastal morphology and wind intensity. Unlike what is found in the core of the Canary system, upwelling is episodic off Iberia, with a majority of events occurring during the summer months (Wooster et al., Citation1976; Alvarez-Salgado et al., Citation1993; Gomez-Gesteira et al., Citation2006; Ambar and Dias, Citation2008). During this season, northerly wind is more frequently observed in the region due to the combined effects of an atmospheric thermal depression present over Iberia and the Azores anticyclone located over the North Atlantic (Bakun and Nelson, Citation1991). However, some upwelling events during the autumn and winter months have also been reported (Santos et al., Citation2004; deCastro et al., Citation2008).
The persistent northerly surface wind blowing along the western Iberian coast gives origin to coastal upwelling, characterised by offshore Ekman transport in the upper ocean layers, implying the formation of a strong density front where the thermocline upwells to the surface, and the presence of an associated along-front geostrophic southward jet-like flow (Peliz et al., Citation2002; Aristegui et al., Citation2009). Simultaneously, the sea level near the coast is lowered due to the convergence of upper ocean layers in the offshore region, building a zonal gradient of the sea surface height, and contributing to the onset of the southward flow. The latter weakens with depth and usually becomes northward near the seafloor over the continental slope.
Detailed studies have been conducted focused on biological and physical aspects of upwelling off western Iberia, using remote sensing techniques, numerical models and local observations. Looking at wind data from local meteorological stations, satellite retrieved sea surface temperature (SST) and phytoplankton data, Sousa and Bricaud (Citation1992) showed that the occurrence of pigment-rich mesoscale structures is strongly associated with the upwelling regime. Oliveira et al. (Citation2009) used the Regional Ocean Modeling System (ROMS) model and satellite data to study the main regional patterns of coastal SST variability near Lisbon, namely the strong along-slope flows, the development of filaments, jets and shadow areas downstream of the main capes, frontal-scale instabilities and the rapid onset of coastal counter-currents along the inshore zone during wind relaxation phases. Mason et al. (Citation2011) looked at a much wider domain between Portugal and the southern limit of the Canary Current, using ROMS forced by gridded wind data from scatterometer, identifying patterns of variability in the system and its interactions with the Azores current and with flow through the Gibraltar Strait. Peliz et al. (Citation2007) also used ROMS with a lagrangian sub-model that includes advection, diffusion and diurnal vertical migration, to successfully simulate crab larvae dispersal on the Iberian coast.
In recent years, the sensitivity of coastal upwelling to climate change has been questioned. Bakun (Citation1990) reported evidence of intensification of the main upwelling systems during the second half of the 20th century. Demarcq (Citation2009) analysed SST data for the period 1985–2007 of the Pathfinder database and observed a slightly lower SST trend in upwelling regions (0.42°C per decade) than elsewhere in the continental margins (0.56°C per decade), which may be a consequence of an increase of upwelling, a result also supported by Narayan et al. (Citation2010), and possibly due to global warming effects. Snyder et al. (Citation2003) after looking at numerical simulations of climate change scenarios for the California region showed that the increasing concentration of CO2 implies an intensification of the land–ocean temperature contrast and consequently an intensification of the upwelling favourable wind. However, there is large uncertainty about future trends of upwelling in the main coastal upwelling systems, as noted by Wang et al. (Citation2010) in an analysis of an ensemble of 21 large scale climate models, with contradictory results.
Specifically in what concerns the Iberian sector, few studies have been published, and these mostly emphasise uncertainty about coastal upwelling trends off western Iberia. Some studies suggested a weakening in coastal upwelling intensity in the northern limit of western Iberia (e.g. Bode et al., Citation2009), or even along all the western Iberian coast (Alvarez et al., Citation2008), while others suggested increasing upwelling in the south sector of western Iberia (Santos et al., Citation2005; Relvas et al., Citation2009).
2. Data and methods
The present study uses the ROMS ocean numerical model (Shchepetkin and McWilliams, Citation2005, Citation2009). ROMS is a 3-D, free-surface, sigma-coordinate, split-explicit primitive equation model that takes into account the Boussinesq and hydrostatic approximations. ROMS has been applied to the four major coastal upwelling ecosystems, for example, by Capet et al. (Citation2004) and Penven et al. (Citation2006) to the Californian current system; by Penven et al. (Citation2001) and Blanke et al. (Citation2002) to the Benguela current system; by Penven et al. (Citation2005) and Colas et al. (Citation2012) to the Humboldt current system; and by Peliz et al. (Citation2007) and Mason et al. (Citation2011) to the Canary current system.
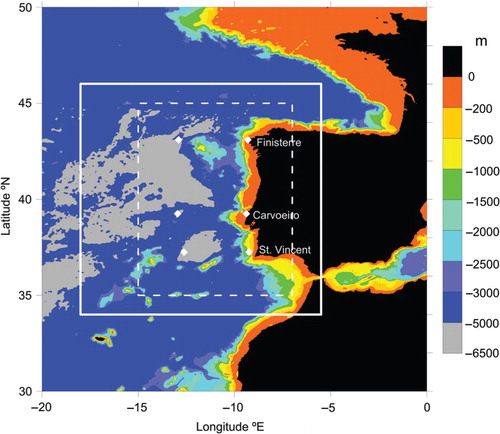
Here, ROMS is applied to the region off western Iberia (), using a Mercator projection computational grid with a horizontal resolution of 1/12° (approximately 7 km), which is high enough to resolve the near-shore upwelling dynamics in the region where the baroclinic Rossby deformation radius is about 25 km (Chelton et al., Citation1998). The model was configured with 32 vertical sigma layers, with increasing vertical resolution near the ocean surface (θ s =7) and seafloor (θ b =0.4). Raw bathymetry data are taken from the 2-minute resolution ETOPO2 topography of Smith and Sandwell (Citation1997). Several passes of a smoothing filter reduce the r factor to below 0.2 (r=Δh/2h) (Haidvogel and Beckmann, Citation1999). Points where the model grid depth is shallower than 5 m are reset to 5 m. A linear (quadratic) bottom drag was applied. The parameterisation of vertical mixing uses the generic length scale (GLS) turbulence closure scheme, with a k–kl closure, where k is the turbulent kinetic energy and l is the turbulent length scale (Warner et al., Citation2005). The model was initialised with monthly mean salinity and temperature profiles from the World Ocean Atlas (Locarnini et al., Citation2006), which are also used to define the boundary conditions on the open boundaries, where radiation and nudging conditions were imposed (Marchesiello et al., Citation2001).
Fig. 1 Bathymetry and limits of the computational domain applied in the ROMS ERA-Interim (white solid rectangle) and ERA-40 (white dashed rectangle) simulations. The location of the three main capes and corresponding offshore points are also shown.
Two multidecadal simulations, representing the recent climate evolution, were performed using different atmospheric forcing. Both experiments use 6-hourly atmospheric data from the ECMWF reanalyses, the first corresponding to the period 1961–2000 included in the ERA-40 database (Uppala et al., Citation2005), the second covering the period 1989–2008 from ERA-Interim (Dee et al., Citation2011). In both experiments, atmospheric data are bi-linearly interpolated to the ROMS grid. Seven surface atmospheric variables (surface wind, shortwave net radiation, surface air temperature, surface pressure, relative humidity, cloud cover and precipitation) are transferred to ROMS with a 6-hour periodicity. Sensible and latent heat, and momentum fluxes at the atmosphere–ocean interface are computed in ROMS using bulk formulas (Fairall et al., Citation2003). Each simulation was started by a 5-yr spin-up period, repeating the first year of ERA-40 and ERA-Interim data, respectively.
While the focus of this study is on recent variability and trends, which turn out to be more relevant, and are also more easily validated against remote sensing data, the use of the longer ERA-40 experiment offers an opportunity for some sensitivity analysis and emphasises the relevance of the more recent results. Due to computational constraints, the ERA-40 simulations used a smaller domain, but one that still covers the full region of interest.
Numerical results from ROMS are here compared with AVHRR processed satellite data from Marullo et al. (Citation2007). This database includes daily SST data in an extended Mediterranean area, obtained by optimal interpolation from AVHRR data to a 1/16° resolution grid. The validation with in situ measurements showed that the satellite AVHRR SST is able to reproduce in situ measurements with a mean bias of less than 0.1 K and root mean square error of about 0.5 K and that those errors do not drift with time or with the interpolation error. Because of the interpolation used to fill in the data gaps, the AVHRR database is likely to underestimate short term variability. On the other hand, Dufois et al. (Citation2012) noted that AVHRR data tend to overestimate SST in the coastal upwelling regions.
Due to the episodic nature of Iberian upwelling, a criterion for its occurrence is required, as well as a measure of its intensity. Three model variables were analysed in that context: anomaly of near-shore SST, evolution of sea surface height and of the near surface currents. While all these variables offer sensible results, the focus will be on SST, as it is more easily verified against distributed observations. Some of the analyses will be based on time series at the three capes presented in – representative of the northernmost region of the northwest of Iberia (Finisterre), of the western coast (Carvoeiro) and of the region southwest of Iberia (St. Vincent). For each cape, the anomaly of its near-shore SST is computed by subtracting the SST 300 km offshore at the same latitude.
3. Results
3.1. Wind forcing
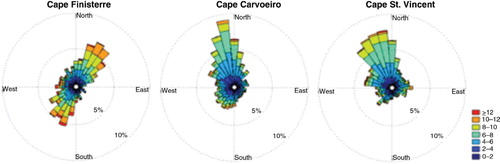
shows wind roses retrieved from the 1989–2008 ERA-Interim reanalysis database at each of the three main western Iberia capes () during the main upwelling season (June–July–August; JJA). In the northern cape of Finisterre the wind blows most frequently from NE, although with significant frequency of SW flow. At Cape Carvoeiro, wind is mostly from NNW, whereas at Cape St. Vincent it blows from NW with somewhat stronger directional variability. In spite of the strong annual cycle of land temperature, dominant wind direction in the different seasons (not shown) is essentially similar to that shown in .
Fig. 2 Summer (JJA) wind roses for the period 1989–2008 (ERA-Interim) at (from North to South): Cape Finisterre, Cape Carvoeiro and Cape St. Vincent. It was considered the closest point to each cape over the ocean.
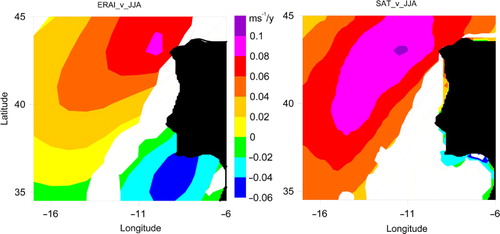
Due to its almost perfect north–south alignment, the intensity of northerly wind plays a dominant role in Iberian upwelling. During the period 1989–2008, ERA-Interim data indicate a significant trend in the summer wind field, with a slight intensification of northerly flow in the SW, near St. Vincent, accompanied by a stronger but opposite trend in the NW (-left). Both trends are confirmed by satellite scatterometer measurements (data retrieved from an ensemble of different satellite sensors) although these data only indicate statistically significant trends in the NW, where they are somewhat higher than suggested by the reanalysis. For the computation of , time series at each grid point were filtered by removing the mean annual cycle and statistical significance of the trends was calculated following the Mann–Kendall trend test. The results presented in point to a decreasing of upwelling-favourable wind in the north and increasing of upwelling-favourable wind in the south. Note the slight difference in the time intervals used for ERAI and scatterometer due to data availability and the difference in spatial resolution (1° for ERAI vs. 0.25° for the scatterometer data).
Fig. 3 Trends of the southerly wind in summer (JJA) from (a) ERA-Interim for the period 1989–2008 and (b) satellite scatterometer data for the period 1988–2007. Colour fill is applied only for those that are statistically significant at the 95% level.
3.2. Climatology of SST in ROMS simulations
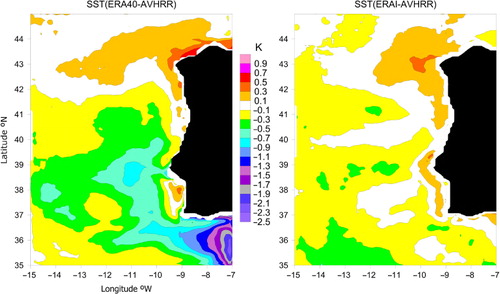
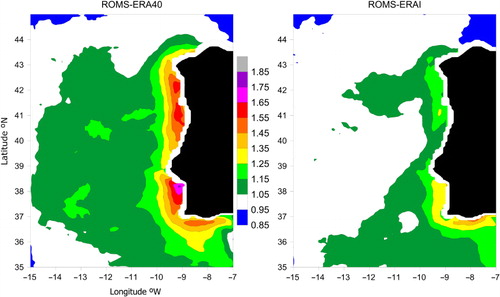
The two ROMS simulations performed have a common period of 13 yr (1989–2001), which can be used to benchmark the quality of atmospheric forcing in those simulations. shows a comparison of the mean SST in that period, from each simulation, against the AVHRR SST data from Marullo et al. (Citation2007). Results using the ERA-Interim forcing are clearly closer to observations everywhere in the domain, but more notably in the southern region. The differences in that region may be partially explained by the smaller domain size of ERA-40 forced run but are mostly due to differences in the wind forcing. Errors in the mean ROMS SST field in the ERA-Interim forced run are almost always below 0.3 K, and always below 0.5 K. Errors in the near-shore region, mostly affected by upwelling, are not systematically larger than elsewhere.
Fig. 4 Difference between simulated and observed mean daily SST in the common period of the two simulations (1989–2001): (left) ROMS with ERA-40, (right) ROMS with ERA-Interim.
The same common period was used to assess the intra-annual variability of daily SST, computed as the multiannual mean of the annual standard deviation of SST at each grid point. shows the ratio of that value to the corresponding value from satellite data, that is, the normalised intra-annual variability, with the value ‘1’ representing a perfect match. Both simulations indicate excessive intra-annual variability in the ROMS simulations, especially in the coastal waters, but the ERA-Interim simulation is closer to the remote sensing measurements, with an overestimation of intra-annual variability by only 15–25% in the western coast (slightly more in a very narrow strip on the southern coast). The mismatch in the near-shore region may be partially explained by the resolution of ERA-Interim (about 80 km), which implies interpolation between inland and offshore wind and other atmospheric data, a process that could only be completed avoided by a coupled atmosphere-ocean simulation. A simpler approach to this problem was tried, following Kara et al. (Citation2007), consisting of an extrapolation of atmospheric forcing data from the offshore fields towards the coast. However, the corresponding simulations, only for ERA-Interim data, showed slightly worst results, with an increase in coastal SST bias, and an underestimation of the frequency of upwelling events (shown later in ). Considering these results, the ERA-Interim data were directly used in the following results and further analysis of this issue is left for the discussion.
Fig. 5 Intra-annual variability of the SST field in the 1989–2001 period: (a-left) ratio between the intra-annual standard deviation of the SST field in the ROMS +ERA-40 simulation and the intra-annual standard deviation of the AVHRR SST field; (b-right) the same for the ROMS+ERA-Interim simulation.
On the other hand, as previously mentioned, the AVHRR data are likely to underestimate variability in regions often covered by clouds, where optimal interpolation is used to fill in missing data. This may partially explain the excessive variability found in the coastal waters in the ERA-Interim forced run.
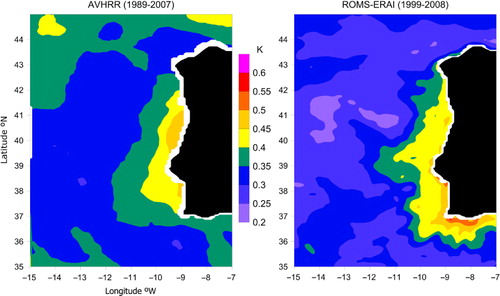
A complementary analysis of SST variability is given in showing inter-annual variability in the full period of the ERA-Interim ROMS simulation (1989–2008) and the satellite database (1989–2007), computed as the inter-annual standard deviation of the annual mean SST. Results show a rather good agreement on the western coast, indicating a qualitatively good representation of enhanced inter-annual variability in the region affected by episodic upwelling. Results are poor on the southern coast, a region where all results should be considered with caution, since the simulation domain and resolution do not allow for a representation of the interaction between the Upper Atlantic Water and the mid-depth Mediterranean Water (Serra et al., Citation2010).
Fig. 6 Inter-annual standard deviation of the SST field in (left) the AVHRR satellite data 1989–2007, and (right) the ROMS+ERA-Interim simulation 1989–2008.
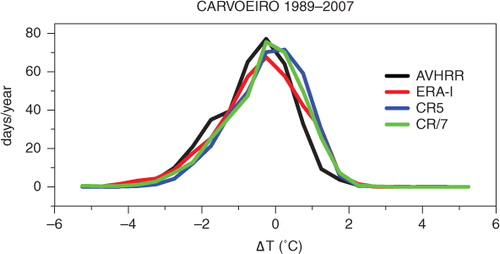
A better view of the temporal variability of SST is given in , showing the evolution of SST offshore Cape Carvoeiro in ROMS+ERA-Interim and the satellite dataset. Both indicate much higher variability in the near-shore location, a signature of the upwelling episodes. The match is overall rather good, indicating the ability of ROMS in reproducing the upwelling dynamics. The distribution of the anomaly of the near-shore SST in relation to SST 300 km offshore is analysed in , with a clear asymmetry towards negative values in both observations (AVHRR) and simulation results, a signal of upwelling. Again, simulations indicate more vigorous upwelling, confirming results by Dufois et al. (Citation2012) concerning a warm bias in AVHRR coastal data, but results are otherwise comparable. also shows the results from the two simulations where the near-shore atmospheric data from ERA-Interim was pre-processed following Kara et al. (Citation2007): CR7 uses the creeping method for all seven forcing variables, CR5 only uses creeping for the thermodynamic variables (not for wind and atmospheric pressure). In the region of the histogram corresponding to upwelling (ΔT≤−2°C), creeping leads to poor match with observations: AVHRR data correspond to an average of 36 d/yr of upwelling, in perfect match with the ROMS-ERA-I simulation, whereas simulation CR5 only has 18 d/yr and CR7 26 d/yr.
Fig. 7 Evolution of SST near Cape Carvoeiro (coast, top lines) and at an offshore location 300 m to the west: ROMS results (black lines) and AVHRR data (red lines).
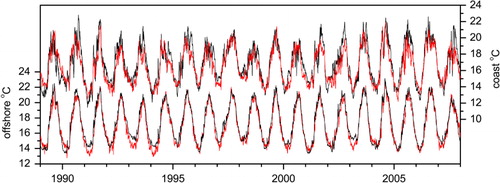
Fig. 8 Histograms of the daily SST anomaly near Cape Carvoeiro (SST nearshore – SST 300 km offhore): ROMS results (red) and AVHRR data (black). Curve CR7 corresponds to a ROMS simulation where the coastal atmospheric data were pre-processed following Kara et al. (Citation2007), CR5 uses the same methodology but only for the thermodynamic variables.
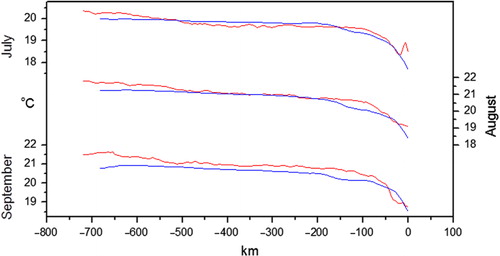
The upwelling process is more clearly visible in , showing the multiannual monthly mean of SST in a zonal line along the Cape Carvoeiro parallel, with a good representation of the upwelling front in the summer months, extending up to about 200 km from the coast.
Fig. 9 Zonal distribution of the daily mean SST along the Cape Carvoeiro parallel, obtained from the ROMS simulation with ERA-Interim forcing (blue) and from AVHRR Optimum Interpolated satellite data (red).
3.3. Trends in simulated upwelling frequency
The trends in the mean summer (JJA) wind presented in suggest that some of the inter-annual variability in the coastal SST is due to a trend in upwelling. While the changes in wind are more relevant in the JJA period, its oceanic impact is delayed, being more relevant in July–August–September (JAS) (Fiuza et al., Citation1982; Nykjaer and Van Camp, Citation1994). In the JAS period, upwelling explains the mean cooler coastal waters. When upwelling is active, the coastal SST cooling anomaly is stronger than the mean state by more than 2°C and its impact extends to some tens of km offshore ().
shows the evolution of the upwelling frequency at Capes Finisterre and St. Vincent, computed as the number of late-summer days (JAS) when coastal waters are cooler by more than 2°C than the corresponding offshore waters 300 km to the west, where upwelling has little impact. The results, taken from the two ROMS simulations and from the satellite data, are grouped by decades (except for the latter period of satellite data with only 9 yrs), and for each decade a boxplot represents the corresponding distribution of upwelling days. At each location (near shore and offshore) SST corresponds to a spatial average of 30 grid points (10 along the coast, 3 across). Strong inter-annual variability is evident in all distributions with the number of upwelling days varying from 0 to more than 80 d (in a season with 92 d).
Fig. 10 Intra-decadal distribution of the mean number of upwelling days during the late summer months (JAS) near Finisterre and St. Vincent, as given by ROMS+ERA-40 (black boxes), ROMS+ERA-Interim (blue) and AVHRR (red). Upwelling days are defined as days with a near-coast SST 2°C colder than 300-km offshore. Boxes show 25, 50 and 75 percentiles; the mean value is represented by the small square.
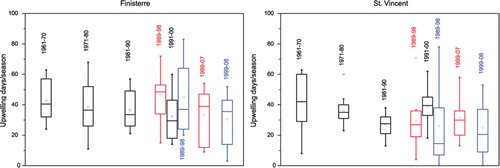
In the ERA-40 forced run (black boxplots), the mean number of upwelling days is almost constant at Finisterre between the 1960s and the 1990s, although the mean and median show a slow decadal decrease, whereas at St. Vincent the mean decreased from the 1960s to the 1980s and recovered in the 1990s. In the most recent decades, where significant changes in the mean wind are indicated in , satellite data (red boxplots) show evidence of decreased upwelling frequency at Finisterre, with a reduction of the mean and a skewing of the distribution towards its lower end. Evolution of the upwelling inter-annual distribution in the ROMS+ERA-Interim simulation (blue boxplots) is in the same sense. At St. Vincent, where trends in satellite retrieved wind were not statistical significant, trends in the number of upwelling days from satellite SST data are less clear, but indicate an increase in the mean and median and a slight skewing towards higher values, while ROMS+ERA-Interim shows an almost constant mean with a reduction in inter-annual variability, and an increase in the median. In the decade 1989–98 one finds significant differences between these statistics computed from satellite data and the ROMS+ERA-Interim simulation, especially at St. Vincent, which is probably associated with the overestimation of inter-annual variability in the south coast (). One should keep in mind, though, that the satellite data have been filtered and includes significant interpolation to account for cloud contaminated observations, implying an underestimation of local SST variability. It should also be remembered that the AVHRR frequently exhibit higher SST values than the observed ones, over Eastern Boundary Upwelling Systems (Dufois et al., Citation2012).
The opposing trends in the meridional wind intensity along the western Iberian coast () are consistent with a decrease of the upwelling index in the north sector and a slight increase in the south sector (), and corroborate results of previous studies, indicating a decreasing of upwelling during the last decades at the northern western Iberian coast (e.g. Bode et al., Citation2009) and increasing of upwelling at its southern limit (Santos et al., Citation2005; Relvas et al., Citation2009). Furthermore, the ROMS+ERA-Interim results also indicate that the changes in coastal SST are related with upwelling, since they are accompanied by consistent changes in the sea surface height and in the horizontal currents (not shown). This means that those SST changes cannot be explained by radiative or atmospheric heat flux changes alone.
3.4. Trends in mean coastal SST
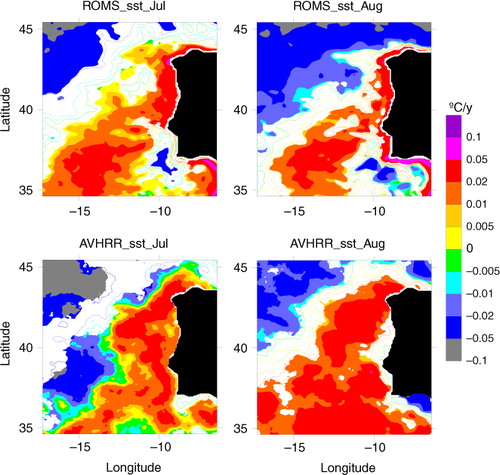
Changes in the frequency and intensity of upwelling may impact on the mean SST, especially in summer months where upwelling occurs in a significant fraction of the season. In observations, these changes will be superimposed on underlying climate trends, appearing as a perturbation of the global warming signal. In the ROMS+ERA-Interim simulations, the global warming trend will be present in the atmospheric data fed to ROMS, but not in the oceanic boundary conditions, which in the present case always follow the same climatological annual cycle. shows the distribution of the trends (in °C/yr) in both the AVHRR satellite data and in the ROMS+ERA-Interim simulation covering the same period. Trends are computed for the July and August summer months, using the corresponding daily data in a perpetual same month mode (perpetual July and August), and its statistical significance is computed following the Mann–Kendall method. In both the satellite and ROMS data there is no evidence of reduced coastal warming at Finisterre, a place where SST trends near the coast are close to the regional maximum, which is consistent with the negative upwelling trends at that location. In the southern limit off the west coast, near St. Vincent, both satellite and ROMS results indicate a region of reduced warming or even cooling. The broad agreement in the regional SST trends indicates that ERA-Interim captures very well the trends in 2 m air temperature and that local SST is mostly controlled by atmosphere-ocean interaction, a process that is well represented by ROMS. There are, however, substantial differences between satellite data and simulated SST. Cooling offshore St. Vincent is clear in the ROMS simulations, whereas it is only suggested near the south coast in the AVHRR data, with trends which are not statistically significant at the 95% level.
Fig. 11 Monthly SST trends in the period 1989–2007 computed from: (top row) ROMS+ERA-Interim simulation, (bottom row) AVHRR data. Colour fill is only applied in regions where trends are significant at the 95% level.
4. Conclusions
The evolution of coastal upwelling in the major upwelling ecosystems is an open problem. Understanding that process is highly relevant, especially considering its interaction with changes due to global warming. As the resolution of climate change scenarios approaches that needed to represent coastal processes, at the level of 10 km or less, it is essential to be able to simulate these atmosphere–ocean interaction processes, leading to realistic coastal currents and ocean thermodynamics.
The Iberian coast, in the northern limit of the Canary current system, is currently characterised by upwelling, more frequent in the summer period. Here, the prevailing atmospheric conditions experience large inter-annual variability leading to corresponding variability in upwelling. A representation of these highly transient features is a difficult task, considering the lack of realistic ocean boundary conditions and the small scale nature of many of the processes. However, the results shown in the present study indicate that many of those processes are captured by the ROMS model and are due to atmospheric forcing well represented by the ERA-Interim reanalysis.
Recent evolution of summer upwelling off the western coast of Iberia indicates a decrease in upwelling frequency at the northern limit, where the mean SST has been increasing at the fastest regional pace, and by a less significant increase in the south, where mean observed SST shows evidence of mitigated warming. Both results confirm previous independent observational findings in the NW (Bode et al., Citation2009) and in the SW (Relvas et al., Citation2009). These results, however, do not contradict Bakun (Citation1990), where an intensification of the main upwelling systems is found in response to global warming, but indicate that regional features in those systems may respond in different directions, imposing extra complexity. While it is not possible to rule out that recent trends in Iberian upwelling are a feature of multidecadal variability, a recent modelling study has found a significant increase in coastal upwelling off western Iberia in a global warming scenario (Miranda et al., Citation2012), suggesting that recent trends may also be associated with climate change.
Low frequency variability of North Atlantic weather at the inter annual to decadal scales are a matter of great interest, considering in particular its relevance for long range forecasting and for early detection of climate change signals. Some of that variability is captured by indices such as the NAO, which, however, are mostly associated with winter weather, whereas Iberian upwelling is a summer process. Because of that it is not clear how to clarify the relative importance of decadal variability and trends driven by climate change. Further research is clearly needed in that direction.
Results from ROMS simulations also showed a need for further research concerning the evolution of the broader upwelling system, including the permanent core at the African coast and its interaction with Mediterranean waters flowing into the Atlantic through the Strait of Gibraltar. Simulations of a more extended domain at higher resolution were not computationally possible, but will be doable in the near future. This may solve some mismatch between model and observations found in the southern coast. Other discrepancies in a very narrow coastal band may be due to insufficient resolution of the atmospheric data. However, a simple creeping approach, proposed by Kara et al. (Citation2007), with the objective of avoiding the use of continental atmospheric data to compute coastal atmospheric variables, was found to have negative impact on the results with a worst representation of the upwelling process. These sensitivity tests suggests a needed of fully coupled model simulations, which may be done with the new Coupled Ocean-Atmosphere-Wave-Sediment Transport model coupling ROMS with the atmospheric model Weather Research and Forecasting (Warner et al., Citation2010). These ideas are the subject of on-going research and will be included in future work.
5. Acknowledgements
The authors wish to thank Nuno Serra for support and helpful discussions. The AVHRR satellite data were retrieved from Gruppo de Oceanogafia da satellite, Consiglio Nazionale delle Ricerche (gos.ifa.rm.cnr.it). This study was supported by the Portuguese Foundation for Science and Technology (FCT) under grants SFRH/BD/32049/2006, PTDC/AAC-CLI/109030/2008 and PEST-OE/CTE/LA0019/2011.
Related Research Data
References
- Alvarez I , Gomez-Gesteira M , deCastro M , Dias J. M . Spatio-temporal evolution of upwelling regime along the western coast of the Iberian Peninsula. J. Geophys. Res. 2008; 113: 07020.
- Alvarez-Salgado X. A , Roson G , Perez F. F , Pazos Y . Hydrographic variability off the Rias Baixas (NW, Spain) during the upwelling season. J. Geophys. Res. 1993; 98: 14447–14455.
- Ambar I , Dias J , Barale V , Gade M . Remote sensing of coastal upwelling in the North-Eastern Atlantic Ocean. Remote Sensing of the European Seas. 2008; Springer-Netherlands. 141–152.
- Aristegui J , Barton E. D , Alvarez-Salgado X. A , Santos A. M. P , Figueiras F. G , co-authors . Sub-regional ecosystem variability in the Canary Current upwelling. Prog. Oceanogr. 2009; 83(1–4): 33–48. ISSN 0079-6611.
- Bakun A . Global climate change and intensification of coastal ocean upwelling. Science. 1990; 247: 198–201. 247/4939/198.
- Bakun A , Nelson C. S . The seasonal cycle of wind stress curl in sub-tropical eastern boundary current regions. J. Phys. Oceanogr. 1991; 21: 1815–1834.
- Barton E. D , Huyer A , Smith R. L . Temporal variation observed in the hydrographic regime near Cabo Carveiro in the Northwest African upwelling region, February to April 1974. Deep. Sea. Res. 1977; 24: 7–23.
- Blanke B , Roy C , Penven P , Speich S , McWilliams J , co-authors . Linking wind and upwelling interannual variability in a regional model of the southern Benguela. Geophys. Res. Lett. 2002; 29: 2188.
- Bode A , Alvarez-Ossorio M. T , Cabanas J. M , Miranda A. M , Varela A . Recent trends in plankton and upwelling intensity off Galicia (NW Spain). Prog. Oceanogr. 2009; 83: 342–350.
- Capet X. J , Marchesiello P , McWilliams J. C . Upwelling response to coastal wind profiles. Geophys. Res. Lett. 2004; 31: 13311.
- Chelton D. B , de Szoeke R. A , Schlax M. G , El Naggar K , Siwert N . Geographical variability of the first baroclinic Rossby radius of deformation. J. Phys. Oceanogr. 1998; 28: 433–460.
- Colas F , McWilliams J. C , Capet X , Kurian J . Heat balance and eddies in the Peru-Chile current system. Clim. Dyn. 2012; 39(1–2): 509–529.
- deCastro M , Gomez-Gesteira M , Lorenzo M. N , Alvarez I , Crespo A. J. C . Influence of atmospheric modes on coastal upwelling along the western coast of the Iberian Peninsula, 1985 to 2005. Clim. Res. 2008; 36: 169–179.
- Dee D. P , Uppala S. M , Simmons A. J , Berrisford P , Poli P , co-authors . The ERA-Interim reanalysis: configuration and performance of the data assimilation system. Q. J. Roy. Meteorol. Soc. 2011; 137: 553–597.
- Demarcq H . Trends in primary production, sea surface temperature and wind in upwelling systems (1998–2007). Prog. Oceanogr. 2009; 83(1–4): 376–385.
- Dufois F , Penven P , Whittle C , Veitch J . On the warm nearshore bias in Pathfinder monthly SST products over eastern boundary upwelling systems. Ocean Model. 2012; 47: 113–118.
- Fairall C. W , Bradley E. F , Hare J. F , Grachev A. A , Edson J. B . Bulk parameterization of air-sea fluxes: updates and verification for the COARE algorithm. J. Clim. 2003; 16: 571–591.
- Fiuza A , Macedo A. M , Guerreiro M . Climatological space and time variation of the Portuguese coastal upwelling. Oceanol. Acta. 1982; 5: 31–40.
- Gomez-Gesteira M , Moreira C , Alvarez I , deCastro M . Ekman transport along the Galician coast (NW Spain) calculated from forecasted winds. J. Geophys. Res. 2006; 111: 10005.
- Haidvogel D. B , Beckmann A . Numerical Ocean Circulation Modeling. 1999; London: Imperial College Press.
- Kara A. B , Wallcraft A. J , Hurlburt H. E . A correction for land contamination of atmospheric variables near land-sea boundaries. J. Phys. Oceanogr. 2007; 37: 803–818.
- Locarnini R. A , Mishonov A. V , Antonov J. I , Boyer T. P , Garcia H. E , Levitus S . World Ocean Atlas 2005, Volume 1: Temperature.
- Marchesiello P , McWilliams J. C , Shchepetkin A . Open boundary conditions for long-term integration of regional oceanic models. Ocean Model. 2001; 3: 1–20.
- Marullo S , Nardelli B. B , Guarracino M , Santoleri R . Observing the Mediterranean Sea from space: 21 years of Pathfinder-AVHRR sea surface temperatures (1985 to 2005): re-analysis and validation. Ocean Sci. 2007; 3: 299–310.
- Mason E , Colas F , Molemaker J , Shchepetkin A. F , Troupin C , co-authors . Seasonal variability of the Canary Current: a numerical study. J. Geophys. Res. 2011; 116(C06001):
- Miranda P. M. A , Alves J , Serra N . Impact of climate change on Iberian upwelling: explicit ocean simulations forced by a regional atmospheric model. Clim. Dyn. 2012. in press.
- Narayan N , Paul A , Mulitza S , Schulz M . Trends in coastal upwelling intensity. Ocean Sci. 2010; 6: 815–823.
- Nykjaer L , VanCamp L . Seasonal and inter annual variability of coastal upwelling along northwest Africa and Portugal from 1981 to 1991. J. Geophys. Res. 1994; 99: 14197–14207.
- Oliveira P. B , Nolasco R , Dubert J , Moita T , Peliz A . Surface temperature, chlorophyll and advection patterns during a summer upwelling event off central Portugal. Continent. Shelf. Res. 2009; 29: 5–6, 759–774.
- Pauly D , Christensen V . Primary production required to sustain global fisheries. Nature. 1995; 374: 255–257.
- Peliz A , Marchesiello P , Dubert J , Almeida M. M , Roy C , co-authors . A study of crab larvae dispersal on the Western Iberian Shelf: physical processes. J. Mar. Syst. 2007; 68: 215–236.
- Peliz A , Rosa T , Santos A. M. P , Pissarra J . Fronts, jets, and counter flows in the Western Iberian upwelling system. J. Mar. Syst. 2002; 35(1–2): 61–77.
- Penven P , Debreu L , Marchesiello P , McWilliams J . Evaluation and application of the ROMS 1-way embedding procedure to the Central California Upwelling System. Ocean. Model. 2006; 12: 157–187.
- Penven P , Echevin J , Pasapera J , Colas F , Tam J . Average circulation, seasonal cycle, and mesoscale dynamics of the Peru current system: a modeling approach. J. Geophys. Res. 2005; 110(C10021):
- Penven P , Roy C , Lutjeharms J. R. E , de Verdiere A. C , Johnson A , co-authors . A regional hydrodynamic model of the Southern Benguela. S. Afr. J. Sci. 2001; 97: 472–476.
- Relvas P , Luis J , Santos A. M. P . Decadal changes in the canary system. Geophys. Res. Lett. 2009; 36: 22601.
- Santos A , Kazmin A , Peliz A . Decadal changes in the Canary upwelling system as revealed by satellite observations: their impact on productivity. J. Mar. Res. 2005; 63: 359–379.
- Santos A. M. P , Peliz A , Dubert J , Oliveira P. B , Angelico M. M , co-authors . Impact of a winter upwelling event on the distribution and transport of sardine eggs and larvae off western Iberia: a retention mechanism. Continent. Shelf. Res. 2004; 24: 149–165.
- Serra N , Ambar I , Boutov D . Surface expression of Mediterranean water dipoles and their contribution to the shelf/slope – open ocean exchange. Ocean. Sci. 2010; 6: 191–209.
- Shchepetkin A. F , McWilliams J. C . The regional oceanic modeling system (ROMS): a split-explicit, free-surface, topography – following – coordinate oceanic model. Ocean. Model. 2005; 9(4): 347–404.
- Shchepetkin A. F , McWilliams J. C , Ciarlet P. G , Temam R , Tribbia J . Computational kernel algorithms for fine-scale, multi-process, long-term oceanic simulations. Handbook of Numerical Analysis, Vol. XIV: Computational Methods for the Ocean and the Atmosphere. 2009; Elsevier-New York. 121–183.
- Smith W. H. F , Sandwell D. T . Global sea floor topography from satellite altimetry and ship depth soundings. Science. 1997; 277(5334): 1956–1962.
- Snyder M. A , Sloan L. C , Diffenbaugh N. S , Bell J. L . Future climate change and upwelling in the California Current. Geophys. Res. Lett. 2003; 30: 1823.
- Sousa F , Bricaud A . Satellite-derived phytoplankton structures in the Portuguese upwelling area. J. Geophys. Res. 1992; 97: 11343–11356.
- Uppala S. M , Kållberg P. W , Simmons A. J , Andrae U , da Costa Bechtold V , co-authors . The ERA-40 re-analysis. Q. J. Roy. Meteorol. Soc. 2005; 131: 2961–3012.
- Wang M , Overland J. E , Bond N. A . Climate projections for selected large marine ecosystems. J. Mar. Syst. 2010; 79: 258–266.
- Warner J. C , Armstrong B , He R , Zambon J. B . Development of a Coupled Ocean-Atmosphere-Wave-Sediment Transport (COAWST) modeling system. Ocean. Model. 2010; 35(3): 230–244.
- Warner J. C , Sherwood C. R , Arango H. G , Signell R. P . Performance of four turbulence closure methods implemented using a generic length scale method. Ocean. Model. 2005; 8: 81–113.
- Wooster W. S , Bakun A , McClain D. R . The seasonal upwelling cycle along the eastern boundary of the north Atlantic. J. Mar. Res. 1976; 34: 131–141.