Abstract
Strong northeasterly wind events are infrequent over Baffin Island, but are potentially hazardous for aviation and the local community of Iqaluit (the capital of Nunavut, Canada). Three strong northeasterly wind events in this region are examined in this study, using the Canadian Global Environmental Multiscale-Limited Area Model (GEM-LAM) with a horizontal grid spacing of 2.5 km; in-situ observations; and reanalysis data. The skill of the GEM-LAM in simulating these events is examined. With the exception of one event, the GEM-LAM was successful at predicting the large-scale flow in terms of the circulation pattern, timing of the synoptic set-up and the low-level flow over the Hall Peninsula. The onset and cessation of strong winds and timing of major wind shifts was typically well handled by the model to within ~3 h, but with a tendency to underestimate the peak wind speed. The skill of the surface wind forecasts at Iqaluit is critically dependent on the predicted timing and location of the hydraulic jump and the grid point selected to represent Iqaluit. Examination of the observed and modelled data suggest that the strong northeasterly wind events have several features in common: (1) strong gradient-driven flow across the Hall Peninsula, (2) mean-state critical layer (or reverse shear) over the Hall Peninsula, (3) a low-level inversion, typically above the maximum barrier height immediately upstream of the Hall Peninsula, (4) subcritical flow, typically present upstream of the Hall Peninsula and (5) a hydraulic jump in the vicinity of Frobisher Bay. The modelled atmospheric conditions upwind of the Hall Peninsula immediately prior to the formation of the hydraulic jump (and acceleration of winds over the lee slope) are largely consistent with the prediction of propagating hydraulic jumps presented in the literature.
1. Introduction
Strong downslope winds arising from cross-barrier flow have been studied extensively in the literature using observations and idealised modelling studies (e.g. Smith, Citation1979; Durran, Citation1991; Baines, Citation1995; Gyüre and Jánosi, Citation2003). As a result, numerous theoretical and conceptual frameworks have been proposed to describe and predict the flow resulting from cross-barrier flow for a variety of atmospheric conditions and types of terrain (e.g. Long, Citation1954; Klemp and Lilly, Citation1975; Clark and Peltier, Citation1984; Smith, Citation1985; Durran, Citation1986; Sheridan and Vosper, Citation2006; Jiang et al., Citation2007). It has, however, only recently become possible to resolve mountain waves in operational numerical weather prediction models.
Recently, studies have been undertaken to determine the utility of using high-resolution numerical weather prediction models to study and forecast strong downslope wind events (e.g. Gohm and Mayr, Citation2005; Jiang and Doyle, Citation2008; Reinecke and Durran, Citation2009; Deacu et al., Citation2010). Reinecke and Durran (Citation2009) simulated conditions for two strong downslope wind events observed during the Terrain-Induced Rotor Experiment (T-REX) and noted the difficulties of predicting downslope winds more than 12 h in advance, mostly on account of sensitivity to the initial conditions. Deacu et al. (Citation2010) performed a numerical study of a November 2006 windstorm event at Iqaluit using the Global Environmental Multiscale-Limited Area Model (GEM-LAM). Their focus was to investigate the physical mechanisms responsible for the formation (and interaction) of channelled northwesterly low-level winds and northeasterly downslope winds over Frobisher Bay. Deacu et al. (Citation2010) noted that forecasting northeasterly wind events is challenging, especially given the scarcity of observations over Baffin Island, Canada. They found that while the model may adequately describe the large-scale and mesoscale flow, performance at the local scale may still be poor.
In this study, we are interested in investigating mechanisms responsible for the formation of strong downslope (northeasterly) winds at a high latitude site (Iqaluit) on Baffin Island, Canada, using the GEM-LAM. Such windstorms at Iqaluit are a serious concern to the community (Hanesiak et al. Citation2010). For example, an incredibly strong northeasterly event in February 2007 was associated with wind gusts up to 150 km h−1 that caused extensive damage in Iqaluit.
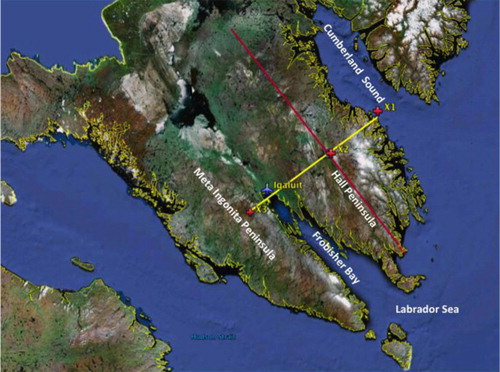
Baffin Island is the largest island of the Canadian Archipelago and is located in the eastern Canadian Arctic, north of Quebec across the Hudson Strait, and west of Greenland across the Davis Strait. The Arctic Cordillera runs along the eastern shores of the island and, as such, there is potential for significant orographic interaction across the peaks of the three peninsulas that comprise the south-eastern mass of the island (). Baffin Island is located to the northwest of the Labrador Sea, and hence, the northern edges of the major North Atlantic storm tracks can lead to synoptic situations with strong flow across the island's southern peninsulas. Baffin Island is sparsely settled, so there is a paucity of in situ data. However, Iqaluit (the capital of Nunavut and the largest city in the eastern Canadian Arctic) is located at the head of Frobisher Bay and is ideally situated to provide valuable in-situ surface and sounding data. The terrain along transect X1–X3 through Iqaluit () rises rapidly from Cumberland Sound to an altitude of almost 800 m; thereafter, the terrain is characterised by an undulating plateau for about 80 km before the terrain declines from about 680 m to sea level again near Iqaluit. This terrain configuration is unlike mountain barriers typically studied in strong lee slope wind events. Also, the flow regime is complicated by the presence of the Meta Incognita Peninsula (rising to almost 670 m near X3) some 40 km west of Iqaluit.
Fig. 1 Study area over Baffin Island. The location of Iqaluit is indicated by the aircraft symbol. The locations X1, X2 and X3 are discussed in the text. The cross-sections in Section 5 are along the yellow transect (X1–X3). The pressure gradients at 1 km ASL in are calculated along the red transect along the Hall Peninsula.
Analysis of wind data from the weather station at Iqaluit reveals that northwesterly and southeasterly winds are by far the most common winds. Specifically, Nawri and Stewart (Citation2006) determined that northwesterly and southeasterly surface winds collectively accounted for 80% of all strong surface wind (i.e. >10 m s−1 or 20 kn) observations. Deacu et al. (Citation2010) note that northwesterly high wind events (i.e. >15 m s−1 or ~30 kn) have the highest frequency of occurrence, at 2%, compared to only 0.3% for northeasterly winds. In addition, Nadeau (Citation2007) found that strong wind events were most likely to occur between October and April, with strong northwesterly wind events dominating.
Although northeasterly high wind events at Iqaluit do not occur frequently, they are still a notable concern to the community and aviation. Hanesiak et al. (Citation2010) noted that northeasterly events can have a significant, even destructive, impact on the community. In addition, northeasterly high wind events are orientated roughly perpendicular to the runways at the airport. Further, as we will show, the northeasterly high wind events are frequently accompanied by a hydraulic jump in the vicinity of Iqaluit, increasing the potential for significant turbulence and wind shifts which are of concern for aviation (Hudson et al., Citation2001). Furthermore, for wind speeds exceeding 30 kn, the likelihood of reduced visibility from blowing snow increases significantly (Gordon et al., Citation2010), thereby further increasing the impact of the strong wind events.
The scientific literature has, until now, focused almost exclusively on strong northwesterly and southeasterly wind events over the study area, with little attention being paid to northeasterly events. In this paper, we discuss the results of simulations of three northeasterly high wind events at Iqaluit between 2007 and 2008.
With the above discussion in mind, the goals of this paper are three-fold:
Describe the large-scale flow in which strong northeasterly wind events occur at Iqaluit.
Determine the utility of the GEM-LAM to provide forecast guidance in advance of strong northeasterly wind events at Iqaluit.
Use the in-situ data and GEM-LAM data to improve our understanding of the physical processes and mechanisms that lead to strong northeasterly wind events at Iqaluit, and provide guidelines to forecasters.
2. GEM-LAM configuration and observations
2.1. Model configuration
For this study, the Environment Canada GEM model has been used with 2.5-km horizontal grid spacing (Erfani et al., Citation2006). This configuration is referred to as the GEM-LAM. The model was run over a 450×450 horizontal grid centred over Baffin Island. There are 58 vertical terrain following eta levels from the surface to 10 mb. The model configuration is the same used by Deacu et al. (Citation2010), where further details can be found. Initial and boundary conditions were provided by the hourly output of the GEM regional model (Mailhot et al. Citation2006), which in turn derives its initial conditions from the global forecasting system of the Canadian Meteorological Centre (CMC). More details about the GEM-LAM can be found in Erfani et al. (Citation2006). The model was run for 24-h periods that captured the development and cessation of each event. Key variables considered were horizontal winds, vertical velocity, potential temperature and mean sea-level pressure.
2.2. In-situ observations
We validated the GEM-LAM using hourly 10-m wind speed (including gusts) and direction observed at the Iqaluit airport and 12-hourly sounding data released from the same location. Vertical profiles of potential temperature (θ), wind speed and direction were generated for all available sounding times. The model data were averaged over nine grid points surrounding Iqaluit, but data for individual grid points are also displayed. Given the focus on low-level flow, profiles and cross-sections are limited to 500 mb. For the February 2007 case, there is a sounding available only for 12 UTC on 4 February, as later measurements were impossible given the extreme wind speeds. However, for the remaining three cases, there are soundings available at three synoptic times corresponding to the beginning, middle and end of each event.
Certain caveats need to be kept in mind concerning the radiosonde data. First, sondes were released every 12 h and may not have captured the rapid changes that are possible under such dynamic conditions. Second, we did not allow for sonde drift when validating the model, and profiles may have been affected by the presence of a hydraulic jump. However, given that we also considered model profiles at surrounding grid points, and that the low-level wind maxima for all three case studies were below 1500 m above ground level, sonde drift is not expected to be a significant issue. Future studies would benefit from continuous wind and temperature profiles generated by a Doppler lidar and radiometer, respectively.
2.3. Analysis and reanalysis data
In light of the scarcity of in-situ data over Baffin Island, we also used data from the North American Regional Reanalysis (NARR; Mesinger et al., Citation2006), and the 6-hourly analysis fields for the GEM-LAM (00-h fields initialised from 6-h forecasts from the GEM regional model). The NARR data were used to generate composites of the large-scale flow and set up for a larger set of strong northeasterly events (see Section 6.3). To obtain an idea of how well the model-predicted fields captured the large-scale set up for each event, 6-hourly analysis fields were used to identify notable differences between the GEM-LAM and the analyses (Section 3).
3. Synoptic overview
3.1. 4 February 2007
This was by far the strongest and longest-lived northeasterly high wind event in recent years, with sustained winds reaching hurricane force (64 kn). The combination of a slow-moving depression moving northwards along the Labrador coast and an Arctic high over northern Baffin Island produced an exceptionally strong pressure gradient force orientated roughly along the axis of the Hall Peninsula. We focus on the sequence of events between 12 UTC on 4 February and 12 UTC on 5 February, when the strongest winds were observed. The strongest 10-m winds were observed between 22 UTC and 01 UTC (). At this time, the low (<960 mb) was located just offshore midway along the Labrador coast, with the high located over northern Baffin Island (>1020 mb). The maximum pressure gradient (at 1 km ASL) along the Hall Peninsula between 18 UTC and 00 UTC was ~3.8 mb per 100 km ().
Table 1 Summary of properties of key wind parameters for the northeasterly wind events at Iqaluit discussed in the paper
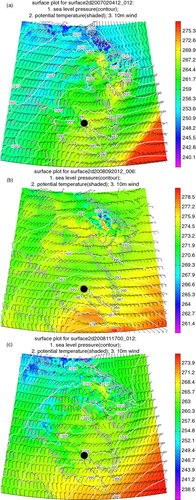
The predicted 2-m potential temperature, sea-level pressure and wind barbs at 00 UTC are plotted in a. Warming in the lee of the Hall Peninsula extends across Frobisher Bay, consistent with adiabatic warming in association with the downslope flow. The strongest surface winds are forecast to occur off Baffin Island. Colder air is associated with an Arctic high to the north, with higher θ values southeast of Baffin Island. The GEM-LAM simulation of the large-scale setup for this event was fairly good, although comparison with the analysis 850-mb fields (not shown) at 6-hourly intervals indicates that the GEM-LAM was too slow in moving the low off the Labrador coast (by about 50 km), as well as its curvature to the west.
3.2. 20 September 2008
This northeasterly high wind event was associated with the rapid passage of a deep low (<980 mb) that originated over Hudson Bay and moved across northern Quebec and Ungava Bay before passing over the Labrador Sea south of Baffin Island. The low caused a tight pressure gradient force aligned along the Hall Peninsula between approximately 18 UTC and 06 UTC, when the pressure gradient was 3.2 mb per 100 km. The strongest northeasterly winds (~30 kn with gusts near 40 kn) were observed from 19 UTC until 00 UTC (). At this time, the centre of the low was located south of Frobisher Bay over the Labrador Sea. After 02 UTC, the winds moderated and shifted to north-northwesterly as the low tracked further to the east.
Comparison between the forecast and analysis 850-mb fields (not shown) indicate that the model placed the low south of Baffin Island too far to the east; from 00 UTC onwards it was forecast to be 200 km too far east. Consequently, the 850-mb heights over southern Baffin Island were too high, especially in the north. This probably resulted in the north-south pressure gradient (and cross-barrier wind speed) being overestimated (see Section 4.2). The surface variables for the September case are plotted in b. Adiabatic surface warming is observed in the downslope flow on the western slopes of the Hall Peninsula, with the flow remaining northeasterly across Frobisher Bay.
Fig. 2 The predicted 2-m potential temperature, sea-level pressure, and 10-m wind barbs near the time of maximum observed winds for a) 4 February 2007; b) 20 September 2008; and c) 17 November 2008. Location of Iqaluit is shown by a black dot.
3.3. 17 November 2008
On this occasion, a deep low (<970 mb) developed along the Labrador/Quebec border and moved northwards; between 15 UTC and 18 UTC the low veered northeastwards and moved over the Labrador Sea. The low then continued to slowly move to the northeast while maintaining its intensity, and was located southeast of Frobisher Bay from 18 UTC to 21 UTC. At Iqaluit winds increased steadily from 06 UTC, with the strongest northeasterly winds being observed from 11 UTC until 16 UTC (sustained winds 35–45 kn, gusts up to 50 kn), when the forecast pressure gradient along the Hall Peninsula was almost 3.0 mb per 100 km ().
c shows the surface variables for 12 UTC on 17 November. Unlike the other events, there is little evidence of warming on the lee slopes of the Hall Peninsula despite the relatively strong cross-barrier flow. Also, there is evidence of a shallow northerly to northwesterly flow over the western portions of Frobisher Bay. After 12 UTC, the northwesterly flow is predicted to spread eastwards across the bay. This is a similar situation to that observed for the 7 November event in 2006 (Deacu et al., Citation2010).
The GEM-LAM had some trouble simulating large-scale forcing for this event, placing the low about 100 km too far to the east, especially from 18 UTC until 00 UTC. Consequently, 850-mb heights over the study region are consistently too high, particularly in the Frobisher Bay region, and this in turn resulted in the model underestimating the pressure gradient over southern Baffin Island, and, therefore, the wind speeds at Iqaluit (see Section 4.2).
To summarise, the GEM-LAM was relatively successful at predicting the large-scale flow in terms of the circulation patterns, timing and the low-level flow over the Hall Peninsula. Also evident is that a wide variety of storm configurations can give rise to strong northeasterly winds in the Iqaluit region. What they all have in common is that the large-scale flow is such that a strong north-south pressure gradient is produced over southern Baffin Island. This suggests that the synoptic flow primarily drives these events, while mesoscale processes (i.e. interactions with topography) enhance the overall magnitude and impact of the events.
4. Model output validation
4.1. Sounding validation at Iqaluit
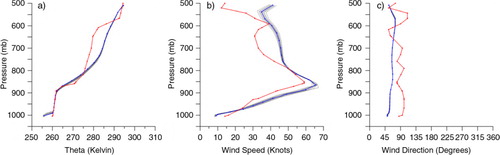
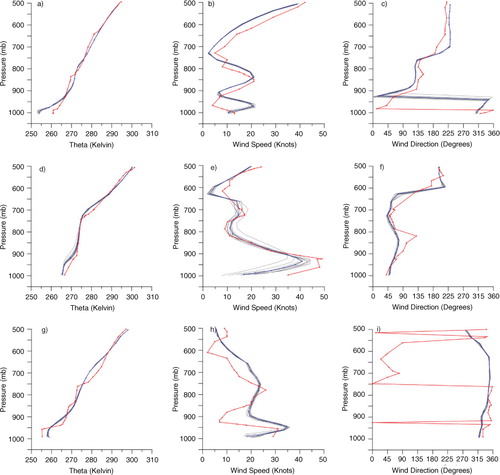
The potential temperature (θ) over Iqaluit at 12 UTC 4 February 2007 is plotted in a. The model and observations are in fairly good agreement below 800 mb, although θ at the lowest model level is colder than observed. The model θ is also higher between 800 mb and 600 mb, as is the modelled wind speed. Both the model and sounding show an inversion between 850 mb and 900 mb, and an associated easterly wind maximum near 60 kn (b and c). The modelled wind maximum is about 5 kn stronger than observed, while the wind speeds immediately above the surface are about 5 kn weaker than observed. Both modelled and observed wind directions are in broad agreement. The modelled and observed profiles show reverse wind shear between 850 mb and ~650 mb (b), although the rate of decrease is greater in the observed profile. The presence of reverse vertical wind speed shear or directional wind shear (from cross barrier at low levels to along barrier higher in the atmosphere) above a mountain barrier is known to create a so-called critical level (e.g. Kim and Mahrt, Citation1992).
Fig. 3 Comparison of modelled versus observed vertical profiles at Iqaluit for 12 UTC on 4 February 2007. Left panel is the potential temperature (κ), middle panel is the wind speed, and right panel is the wind direction. Red traces represent the observed sounding data, blue traces the mean of the predicted data for the nine GEM-LAM grid points surrounding Iqaluit airport, and the grey traces the data for the individual nine data points. Only data below 500 mb are shown.
Comparison between the soundings and model for the September case is shown in . The simulated profile at 12 UTC on 20 September has a similar structure to the observations through the lower troposphere, although the inversion present near 850 mb is better defined in the observed sounding (a). At 12 UTC, the model shows a wind speed maximum of almost 30 kn near 875 mb that is not present in the observed profile (b). The observed wind direction is similar to the model column direction with easterly winds in the low levels veering to southerly near 500 mb (c). At 00 UTC (d–f) the modelled and observed θ profiles match fairly well in the lower troposphere, but the model misses the weak inversion present near 950 mb. At this time, the wind direction has turned easterly below 700 mb, and a 48-kt wind maximum is evident in the observed sounding near 925 mb, with a 38-kt wind maximum predicted near 875 mb. Winds near 45 kn were forecast at some of the grid points near Iqaluit. Above 900 mb there is good agreement between the modelled and observed wind speeds.
Fig. 4 Comparison of modelled versus observed vertical profiles at Iqaluit for the 20 September 2008 event. Top panel is for 12 UTC 20 September, middle panel for 00 UTC 21 September and bottom panel is for 12 UTC 21 September.
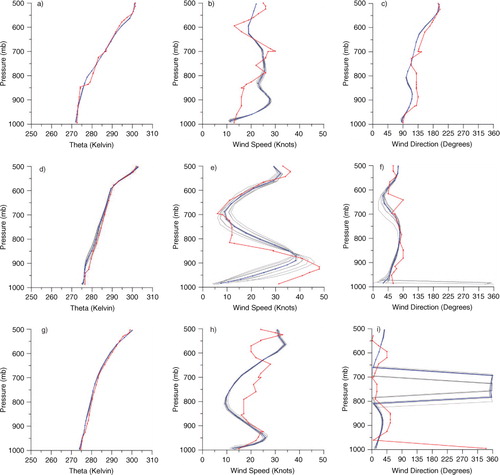
At 12 UTC (g–i), there is excellent agreement between the forecast and observed θ profiles. The model and observations both show the low-level wind maximum weakening to about 25 kn near 950 mb. The modelled winds between 850 mb and 650 mb are too weak. The observed near-surface winds have switched to northwesterly, with a northeasterly wind maximum above that. The model, however, does not show the strongly sheared flow in the low levels.
shows the comparison between the available sounding data and model data for the November 2008 event. At 00 UTC 17 November (a–c), the balloon shows a very shallow layer of northwesterly winds while the model shows a deeper layer of northwesterly wind and a wind maximum associated with this layer below 925 mb – this may explain why the modelled θ was lower than observed below 950 mb. The balloon shows a second wind speed maximum at 850 mb, while the model has a maximum just above this level with a comparable magnitude of 20 kn. At 12 UTC, the model and observations are similar throughout the lower troposphere (d–f). At this time, temperatures in the lower troposphere have warmed and there is a northeasterly wind maximum of 49 kn at 975 mb; the modelled wind maximum is weaker at 40–45 kn. Wind speeds are typically too low below the low-level wind maximum, but are in good agreement above that. Both the modelled and observed winds are primarily easterly to northeasterly below 700 mb, veering to southwesterly by 500 mb – indicating the presence of a critical layer near 650 mb. Finally, the comparison at 00 UTC (g–i) shows that, below the inversion, temperatures have cooled and the wind maximum is now weaker and from the northwest. The modelled flow is northwesterly throughout the column, while the sonde data show a north-northwesterly flow below 750 mb, and northeasterly above that.
Fig. 5 Comparison of modelled versus observed vertical profiles at Iqaluit for the 17 November 2008 event. Top panel is for 00 UTC 17 November, middle panel for 12 UTC 17 November and bottom panel is for 00 UTC 18 November.
4.2. Validation of surface wind speed and direction
The wind speed plot for the February 2007 case shows an observed wind maximum of 64 kn at 00 UTC; however, the model predicted a much lower peak of about 34 kn at 01 UTC (a). The model was also too slow in predicting the rapid increase in wind speed. There is a fair amount of spread in the wind speeds at grid points near Iqaluit, with the highest speed predicted to be near 45 kn at 01 UTC. This spread is associated with the model predicting a shift in wind direction from northerly to northeasterly. The observations show a secondary wind speed maximum of 41 kn at 05 UTC, and the model does a better job of capturing this secondary wind speed maximum, with forecast wind speeds approaching 50 kn between 04 UTC and 05 UTC.
Fig. 6 Comparison of modelled and observed hourly 10-m wind speeds at Iqaluit for the 4 February 2007 event. Top panel is for wind speed and bottom panel is for wind direction. Red traces represent the observed data, blue traces the mean of the predicted data for nine GEM-LAM grid points surrounding Iqaluit airport, and grey traces the data for the individual nine data points. Green dots represent observed wind gusts. 360 has been subtracted from wind directions between 180 and 360 degrees.
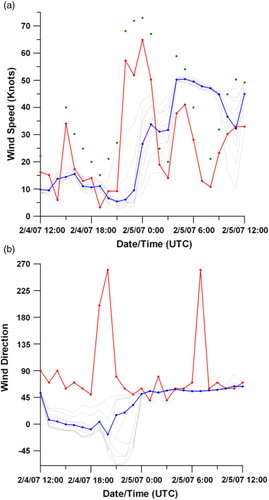
The observed wind directions on 4 February 2007 (b) were mostly east-northeasterly with temporary fluctuations to westerly at 19 UTC and 07 UTC. The modelled winds showed some fluctuation from northeasterly to northwesterly at some grid points during the first 12 h of the simulation, as indicated by the large scatter in the grey traces, especially from 18 UTC to 00 UTC. After that, the forecast winds were in excellent agreement, with the modelled and observed winds blowing steadily from the northeast.
Shifting the modelled wind traces about 4 h earlier produces a much better match, suggesting that there was an issue with timing. As will be discussed in Section 5.1, the above discrepancies in the timing and magnitude of the wind speed are attributable to the predicted position of the hydraulic jump in the vicinity of Frobisher Bay. Comparison of forecast versus model analysis winds speeds along transect X1–X3 at 00 UTC (not shown) indicates that the predicted winds at 850 mb at that time across the peninsula were 5–20 kn too low southwest of X2, and 15–20 kn too low between X1 and X2. This is consistent with the predicted 10-m winds at Iqaluit being up to 25 kn too weak at the time when the first peak winds were observed.
The September event (a) was associated with a maximum observed wind speed of 30 kn at 19 UTC. Both the model and observations showed a marked decrease in the wind speed after their respective peaks, although the model predicted this to occur 2–3 h sooner than was observed. This decrease in wind speed was associated with a shift in wind direction from northeasterly to north-northwesterly (b). Despite small discrepancies between the magnitudes of the observed and modelled wind speeds, the overall evolution of the wind speed on this day was handled well by the model. This is consistent with the comparison of forecast versus model analysis winds speeds along transect X1–X3 at 18 UTC (close to the time of strongest winds), which shows that that the predicted winds at 850 mb at that time across the peninsula were typically only about 5 kn too high. Likewise at 00 UTC, the predicted winds along the transect were typically 5–10 kn too high.
Fig. 7 Comparison of modelled and observed hourly 10-m wind speeds at Iqaluit for the 20 September 2008 event.
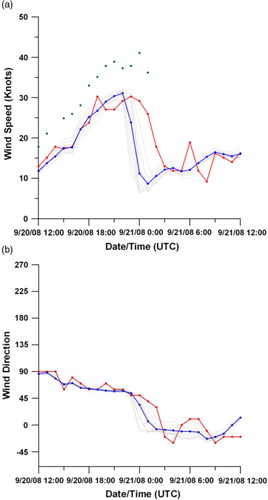
The observed and forecast surface wind directions for the September event (b) show winds backing steadily to northeasterly by 00 UTC, after which the modelled and observed winds shifted to north-northwesterly. This shift from the northeast coincides with the observed drop in wind speed at 00 UTC (a). Despite the various grid points showing a wind shift at slightly different times, there was excellent agreement between the modelled and observed evolution in wind direction for this case.
For the November event shown in a, the observed wind speed increased steadily after 06 UTC, with winds plateauing near 35 kn from 11 UTC until 14 UTC, and reaching a maximum of ~40 kn (gusts over 50 kn) at 15 UTC. The increase in wind speed after 06 UTC coincided with a shift in winds from northwesterly to northeasterly (b). The modelled winds reached a maximum of only 20 kn at 11 UTC, and stayed below the observed surface wind speeds for the remainder of the simulation. There is markedly more spread evident at the nine grid points surrounding Iqaluit from 06 UTC until 18 UTC.
Fig. 8 Comparison of modelled and observed hourly 10-m wind speeds at Iqaluit for the 17 November 2008 event.
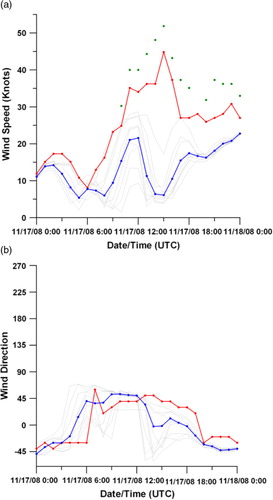
The sounding released at 12 UTC on 17 November (just before the peak wind speed) shows a low-level wind maximum near 950 mb, which is consistent with the gusts near 50 kn. The modelled low-level winds were, however, about 10 kn lower than observed at 40 kn. A possible reason for this is that a mechanism was not present in the model simulation to transport energy from the low-level wind maximum downwards towards the surface. That is, the descending (upwind) arm of the hydraulic jump was not moved far enough across Frobisher Bay, although this does seem to have happened at some of the grid points near Iqaluit.
The forecast and analysed winds speeds along the transect at 06 UTC (not shown) are in close agreement (within 10 kn) – consistent with the forecast winds at Iqaluit at this time being in good agreement with observations. At 12 UTC (close to time of strongest winds at Iqaluit), the predicted 850-mb winds across the Peninsula were within 10 kn. By 18 UTC, the forecast winds were typically 10 kn too weak east of X2, but up to 20 kn too low near X1. This is consistent with the model underestimating the wind speeds at Iqaluit from 12 UTC until 18 UTC.
The surface observations for the November case (b) show northwesterly winds up to 06 UTC, shifting to the northeast quadrant until 19 UTC, before backing to the northwest. The wind shift to the northeast corresponds to the observed wind speed increase (a) discussed above. The modelled wind directions shift from the northwest to the northeast and back to the northwest; however, the timing of each shift is different depending on the position of the grid point. The model shifts the wind to the north sooner than observed – this is associated with a decrease in wind speed, with winds again increasing from the northwest after 18 UTC.
5. Cross-sections
– show the cross-sections between X1 and X3 for each event near the time of maximum observed surface winds. We discuss the evolution of the flow, vertical velocity and θ fields, vertical profiles at key locations and Froude (Fr) number at X1 and X2. In doing so, we hope to gain insight to the processes at work during strong northeasterly wind events. Likewise, we wish to determine whether or not the simulated response of the atmosphere above the lee slopes of the Hall Peninsula during cross-barrier flow events is consistent with the theory.
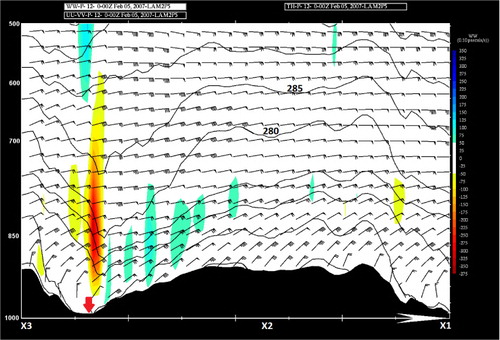
Fig. 9 Vertical cross-section between points X1 (right-hand side) and X3 (left-hand side; see ) for 00 UTC on 5 February 2007. Potential temperature is contoured, winds barbs are in knots, and vertical velocity (Pa s−1) is shaded (warm hues ascent; cool hues descent). Red arrow indicates the approximate location of Iqaluit.
The Fr numbers for modelled soundings were calculated using the method of Gohm et al. (Citation2008). Here H is defined as the depth of the impinging upstream flow between sea level and the centre height of the inversion (Z). The depth of the inversion layer is ΔZ. We used the method of Kahl (Citation1990) for identifying the base and top of inversion layers. U is defined as the mean wind speed averaged over H, Δθ the difference in potential temperature through ΔZ, and the mean potential temperature through depth H. These variables are used to calculate the reduced gravitational acceleration,
and in turn Froude number,
. The critical mountain height was also calculated, which is the minimum barrier height required for the occurrence of critical flow at the crest (Gohm et al., Citation2008). If the mountain height is greater than the critical height, conditions are favourable for the transition from subcritical to supercritical flow as the air passes over the mountain (Gohm et al., Citation2008), with an associated acceleration above the lee slope. The key variables are presented in and .
Table 2 Parameters derived from forecast profiles at points X1 and X2 around the time a hydraulic jump (or strong wave) was predicted to develop over the lee slope
5.1. 4 February 2007
From 18 UTC through 21 UTC, a low-level wind maximum develops and advances down the lee slope of the Hall Peninsula, with speeds of 70–75 kn located about 50–60 mb above the surface. A hydraulic jump develops near Frobisher Bay around 20 UTC. A mean-state critical layer is evident over the lee slope near 700 mb at 20 UTC, immediately prior to formation of the jump.
From 22 UTC until 03 UTC, the strong hydraulic jump remains nearly stationary on the eastern shore of Frobisher Bay. shows the cross-section along at 00 UTC, with strong easterly to northeasterly flow across the Hall Peninsula at all levels below 500 mb. A hydraulic jump is evidenced by the strong vertical velocity couplet on the eastern shore of Frobisher Bay, and the sharp dip in isentropes over the lee slope rising rapidly over Frobisher Bay. Only weak waves are present over the upslope peaks near X1 and over the plateau.
By 03 UTC, the low-level wind maximum increased to over 80 kn. Low-level winds over Frobisher Bay turned to northeasterly from about 01 UTC. The impact of the hydraulic jump on the wind field is evident up to about 600 mb before 00 UTC, extending to near 500 mb by 03 UTC; a self-induced critical layer also develops above the hydraulic jump.
Between 03 UTC and 06 UTC, the hydraulic jump migrates across Frobisher Bay and pushes up against the eastern slopes of the Meta Incognita Peninsula. From 07 UTC until 11 UTC, the hydraulic jump migrates eastwards back across Frobisher Bay. The strongest near-surface winds over eastern Frobisher Bay are predicted between 05 UTC and 07 UTC, which is close to the time the model forecast the maximum winds at Iqaluit. Low θ air is present over Frobisher Bay until 20 UTC, but is flushed out when the flow becomes northeasterly from about 02 UTC onwards. The Fr number at X1 was less than 0.80 from 12 UTC until 00 UTC (). At X2 the Fr number was near 0.80 from 12 UTC until 21 UTC, increasing to 1.2 at 00 UTC. This indicates that the transition from subcritical to supercritical flow occurred near 00 UTC. The base of the inversion at X1 at 20 UTC is located near 1160 m, with a peak wind of 57 kn. The barrier height is greater than the critical height until 06 UTC.
5.2. 20 September 2008
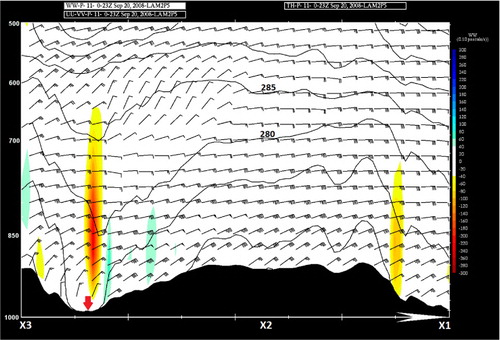
From 16 UTC to 20 UTC, a strong east-northeasterly (~50 kt) wind maximum develops approximately 50 mb above the lee slope (). West of X2, winds near 680 mb decrease from 19 UTC onwards – indicating the presence of a mean-state critical layer. Near the same time, a strong velocity couplet develops on upwind of Frobisher Bay, indicating the presence of a hydraulic jump.
shows that at 23 UTC, close to the time when the modelled and observed wind maxima were observed at Iqaluit, the east-northeasterly wind maximum (~50 kn) was located about 60 mb above the lee slope. A vertical velocity couplet over Frobisher Bay is at peak strength, with the isentropes dipping sharply over the lee slope, before rising steeply in association with the jump. Strong descent is predicted over Frobisher Bay from 19 UTC to 23 UTC, coinciding with the time when the hydraulic jump was at its strongest and deepest (up to ~600 mb). After 23 UTC, although the northeasterly low-level wind maximum is still present, the hydraulic jump weakens. This is associated with a weakening and backing of winds at Iqaluit and over Frobisher Bay. After 01 UTC the northeasterly low-level wind maximum weakens slightly, and the velocity couplet near Frobisher Bay weakens further. The couplet is present on the leeward slope of the Hall Peninsula at 04 UTC, but the ascending arm no longer reaches the surface. The flow over Frobisher Bay becomes north-northwesterly at 10–20 kn at this time.
Fig. 10 Vertical cross-section between points X1 (right-hand side) and X3 (left-hand side) for 23 UTC on 20 September 2008.
The Fr number at X1 was near 2.0 around the time the jump was forecast to develop over the lee slope. The Fr number at X2 was 1.2 just prior to formation of the jump (). A transient stable layer was predicted at X1 near 21 UTC with a base near 830 m; no clear inversions were present in the 3-hourly data. At X2 an inversion was predicted only at 15 UTC, with stable layers at 18 UTC, 00 UTC and 12 UTC. The predicted peak low-level wind at 09 UTC was 36 kn. The barrier height was greater than the critical height for all times when Fr numbers could be calculated.
5.3. 17 November 2008
A mean-state critical layer is present for most of the period above the Hall Peninsula. The critical layer is located between 700 mb and 580 mb between 04 UTC and 15 UTC. A northeasterly wind maximum (45 kn) develops 50–60 mb above the lee slopes of the Hall Peninsula between 09 UTC and 16 UTC and reaches its peak strength near 13 UTC. The formation of the low-level wind maximum is followed by the development of a hydraulic jump around 09 UTC, which peaks near 12 UTC. This coincides with the timing of the peak northeasterly surface wind speeds at Iqaluit. Signs of the jump affecting the flow above the lee slope are evident up to 680 mb. The jump dissipates around 18 UTC.
The cross-section at the time of the strongest observed winds at Iqaluit (15 UTC) is shown in . A north-northeasterly low-level wind maximum (~40 kn) is evident, with a vertical velocity couplet and sharply undulating isentropes in the lee of the Hall Peninsula reflecting the hydraulic jump. Also evident is the mean-state critical layer near 680 mb. At this time, the predicted winds were too low, possibly because the jump was located upslope of Iqaluit. The maximum predicted winds were expected at 12 UTC when the jump was located closer to Iqaluit.
Fig. 11 Vertical cross-section between points X1 (right-hand side) and X3 (left-hand side) for 15 UTC on 17 November 2008.
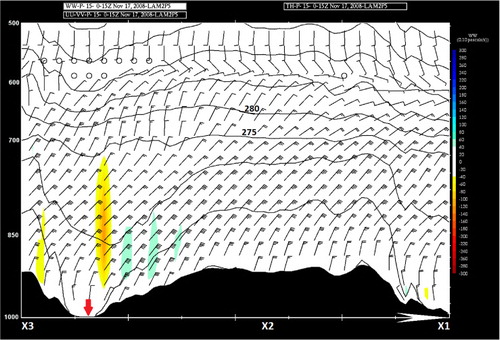
Other than a brief period of northeasterly flow along the eastern shore of Frobisher Bay from 10 UTC to 12 UTC, the near-surface flow over the bay is predominantly northwesterly to northerly. Flow above that and below mean-state critical layer is east-northeasterly to east-southeasterly. Low θ air is present near surface over Frobisher Bay before 06 UTC and after 09 UTC. Between these times, the low θ air was flushed out by a northeasterly flow. At the time of the modelled hydraulic jump, the Fr number at X1 was near 0.8, and 1.0 at X2 (). The barrier height was greater than the critical height for all times for which the Fr number was calculated.
6. Discussion
6.1. Comparison with the 7 November 2006 event
Deacu et al. (Citation2010) studied the transition from northeasterly flow to strong northwesterly flow at Iqaluit on 7 November 2006. The strongest sustained northeasterly surface winds were 15 kn from 11 UTC until 16 UTC, becoming northwesterly at 30 kn after 18 UTC. The predicted critical layer over the Hall Peninsula was between 650 mb and 550 mb. A hydraulic jump was predicted over the eastern shore of Frobisher Bay from 19 UTC through 22 UTC. The strongest downslope winds (~30 kn) were predicted from 21 UTC to 00 UTC. The Fr number at X1 near the time of the predicted hydraulic jump was 2.5. Deacu et al. (Citation2010) suggested that the hydraulic jump was initiated by the less dense downslope northeasterly flow encountering a denser northwesterly flow over the bay, which had an impact similar to that of a topographic barrier.
Unlike Deacu et al. (Citation2010), we find that for the cases studied here, Froude numbers upstream of the Hall Peninsula around the time of the simulated hydraulic jump are typically less than 1.0, suggesting subcritical flow (e.g. Durran, Citation1991). The presence of subcritical flow upstream does, however, not guarantee the formation of a hydraulic jump. Additionally, the transition to super-critical flow does not necessarily occur over the higher upstream ridge near X1 or X2, but rather at the point when the plateau starts to descend down to Frobisher Bay as evidenced by the sharp decline of the isentropes in the cross-sections. Our analysis suggests that the formation of the hydraulic jump for the 17 November 2008 case may have been initiated in a similar manner to that of 7 November 2006, with the downslope northeasterly flow encountering denser northwesterly flow above the western portions of Frobisher Bay. In all three strong northeasterly high wind events, a mean-state critical layer was evident above the Hall Peninsula near the time at which a hydraulic jump (or strong lee wave) formed.
6.2. Low-level acceleration of winds
Of note in the cross-sections is the acceleration of the low-level winds as they traversed the Hall Peninsula. The acceleration over the lee slope calculated for the cases in this study was 30–60%, with a mean acceleration of about 40% (). In contrast, Mobbs et al. (Citation2005) calculated an acceleration of low-level flow over a mountain barrier in the Falkland Islands of over 100%.
Table 3 Summary of the impact of cross-barrier flow on modelled low-level winds near the time when the maximum northeasterly winds were forecast at Iqaluit and when maximum winds were predicted over the lee slope
Possible reasons for the lower accelerations observed in our study are the table-top nature of the Hall Peninsula and the fact that the slope of the Hall Peninsula upwind of Iqaluit is not as steep as that of the mountains in the Falklands. Additionally, the GEM-LAM tends to underestimate low-level winds, which could be due to the model's configuration. Sensitivity tests conducted by Deacu et al. (Citation2010) found that using a different surface drag scheme (i.e. Beljaars et al., Citation2004) produced more realistic (and higher) surface wind speeds. Increasing the vertical resolution in the low levels and changing the mixing length further increased wind speeds.
6.3. Composites for strong wind events
shows the NARR fields for 13 strong northeasterly (or easterly) wind events at Iqaluit between late 2005 and early 2012 (between 1 September and 30 April) that had winds of 30 kn lasting at least 3 h. All 13 events were associated with a deep low (typically 960–990 mb) just south or west of southern Baffin Island, reflected in the mean sea-level pressure map (a). The lows followed one of two preferred tracks – they either moved eastwards from Hudson Bay to south of Baffin Island over the Labrador Sea, or northwards in the vicinity of the Labrador coast before either curving to the west (more common) or east. Oftentimes there was an Arctic high-pressure cell present over northern Baffin Island and the Davis Straight. The result was a very tight north-south pressure gradient on the northern flank of the low, with the strongest gradient over southern Baffin Island. The reason the gradient is not directed along the Hall Peninsula is because the composites included easterly events. This strong pressure gradient suggests that the wind events are primarily pressure-gradient driven.
Fig. 12 NARR composite fields for 13 strong northeasterly (or easterly) wind events at Iqaluit between late 2005 and early 2012 (i.e. 1 September and 30 April) with winds of ≥ 30 kn for ≥ 3 h. (a) Top panel mean sea-level pressure (Pa), (b) middle panel 850-mb vertical velocity (Pa s−1) and (c) bottom panel 900-mb wind speed (m s−1) and direction. Iqaluit is shown by a black dot.
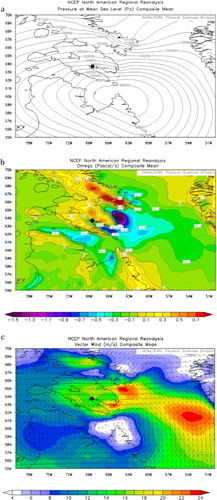
The 850-mb vertical velocity composite is shown in b. Strong ascent along the upwind slopes of the Hall Peninsula in association with the strong northeasterly upslope flow is evident. Subsidence occurred over the lee slopes of the Hall Peninsula, with weak ascent over portions of Frobisher Bay. Ascent also occurred on the upwind slopes of the Meta Incognita Peninsula. The composite of 900-mb winds (c) shows strong cross-barrier flow (~35 kn) over southern Baffin Island. The composite map shows the strongest northeasterly winds at 900 mb over the far southern portions of the Hall Peninsula, with evidence of tip jets off the Hall and Cumberland peninsulas. Mean winds at 900 mb above Iqaluit were near 30 kn, which is consistent with the observed wind speeds there. The aforementioned conditions associated with the 13 high wind events are consistent with those observed during the three cases investigated earlier.
Another noteworthy observation from inspecting the hourly weather data at Iqaluit between late 2005 and early 2012 is the fact that most high wind events are relatively short-lived (i.e. 3–10 h). The February 2007 event was the exception both in term of strength and duration, lasting about 30 h. Also, most high wind events occurred within the period of September through November. This suggests that the timing of such events may be related to the increase in baroclinic activity in the fall and the position of the preferred storm track during that time.
6.4. Forecast criteria and guidelines
While no single synoptic situation and atmospheric structure adequately describes the evolution of events for all the cases considered, the following features are consistent for cases when strong northeasterly winds were observed at Iqaluit in association with a hydraulic jump:
The passage of a deep low south of Baffin Island in concert with an Arctic high to the north generates a strong pressure gradient (typically 2–4 mb per 100 km) that is more or less aligned along the axis of the Hall Peninsula.
There is strong cross-barrier flow (50° to 80°), with winds near the upstream ridge height (750–800 m ASL) typically at least 35 kn.
A mean-state critical layer (or reverse shear layer) is present over the Hall Peninsula between 650 mb and 700 mb.
A low-level inversion is typically present between 800 m ASL and 1100 m ASL (i.e. above the maximum barrier height) immediately upstream of the Hall Peninsula.
Froude numbers upstream of the Hall Peninsula around the time of the predicted formation of a hydraulic jump are typically less than 1.0, suggesting subcritical flow.
The barrier height is greater than the critical mountain height, facilitating the acceleration of the downslope flow.
A wind maximum develops about 50 mb above the downwind slope of the Hall Peninsula, the strength of which is typically 45–50 kn.
The flow above the lee slope at 850 mb is predicted to accelerate by approximately 30–60% compared to the upstream flow.
A non-stationary hydraulic jump is predicted in the vicinity of Iqaluit; the strength and persistence of the jump vary from case to case.
7. Conclusions
GEM-LAM, in-situ observations and reanalysis data were used to study three strong northeasterly wind events over the southern Baffin Island region of Canada, with a focus on Iqaluit, the capital of Nunavut. We have shown that a variety of synoptic configurations can give rise to strong northeasterly wind events at Iqaluit; however, they all have certain features in common. First, the large-scale flow produces a strong north-south pressure gradient over southern Baffin Island. The topography and upwind subcritical cross-barrier flow, together with stable stratification and presence of a mean-state critical level may generate waves. Consequently, instead of Iqaluit being sheltered in the lee of the Hall Peninsula, it can experience strong winds under these conditions. It appears that wind energy from the wind maximum over the lee slope of the Hall Peninsula is transported downwards towards the surface (from the low-level wind maximum) as air descends, before rising rapidly in the ascending portion of the hydraulic jump. The specifics of this process are beyond the scope of this paper and will be the subject of future research.
With the exception of the 17 November 2008 case, the GEM-LAM was successful at predicting the large-scale flow in terms of the circulation pattern, timing of the large-scale pattern and the low-level flow over the Hall Peninsula in the 00- to 24-h forecast window. The onset and cessation of strong winds and timing of major wind shifts at Iqaluit were typically well handled by the GEM-LAM (i.e. predicted within 3 h of observed), but the model tended to underestimate the peak wind speed. The skill of the surface wind forecasts at Iqaluit is critically dependent on the timing and location of the hydraulic jump as predicted by the model. Unfortunately, it is difficult to determine in advance whether or not the model will accurately predict the timing and location of the jump. An ensemble prediction system may provide some guidance in this regard.
Several factors, which may (or may not) be operating at the same time, appear to be responsible for the acceleration of the low level flow over the Hall Peninsula and formation of the hydraulic jump, namely: (1) the transition from subcritical to supercritical flow above the lee slope, (2) the interaction of a downslope flow (or wave) with the cooler (and denser) northwesterly flow over the bay, and (3) the downward reflection of wind energy in vertically propagating mountain waves by a mean-state critical layer. With regards to (3), numerical simulations by Durran (Citation1991) indicated that the reflection of vertically propagating waves by a critical layer was not a major player in the generation of strong downslope winds. Also, simulations by Klemp and Durran (Citation1987) suggested that the development of strong downslope winds was not inhibited by the absence of a critical layer. The simulated flow for the cases presented here is consistent with the hydrostatic wave theory, in which the acceleration of wind over a mountain barrier occurs over the lee slope, followed by a hydraulic jump (e.g. Durran, Citation1991). The modelled atmospheric conditions upwind of the Hall Peninsula immediately prior to the formation of the jump are largely consistent with the prediction of propagating hydraulic jumps with Froude numbers near 1. We note that the calculation of the Froude number for a single upstream sounding may not adequately reflect the real-world processes in this region of complex topography and strong low-level stability for the current configuration of the GEM-LAM. Our findings are not consistent with the flow regime diagram of Sheridan and Vosper (Citation2006). This may be because the mountain barrier in the Falklands is much narrower and steeper than is that of the Hall Peninsula.
The criteria identified in previous studies for strong downslope winds and hydraulic jumps are typically evident in this study; however, no single synoptic situation and atmospheric structure adequately describes the evolution of events for all of the cases considered here. Nevertheless, the proposed guidelines should be useful in alerting forecasters to the risk of strong northeasterly wind events and the possibility of hydraulic jumps near Iqaluit. We recommend that the guidelines should be further tested using an independent data set.
8. Acknowledgements
This research and the Storm Studies in the Arctic network were primarily funded through a network grant from the Canadian Foundation for Climate and Atmospheric Sciences. The authors also acknowledge the financial and equipment infrastructure support from the Natural Sciences and Engineering Research Council, Canada Foundation for Innovation and the Northern Studies Training Program. The authors wish to thank the many collaborators who provided significant contributions: from Environment Canada – Meteorological Research Division, Climate Research Division, Hydrometeorological and Arctic Lab, Prairie and Arctic Storm Prediction Centre.
Related Research Data
References
- Baines P. G . Topographic Effects in Stratified Flow. 1995; Cambridge University Press, Cambridge, 482.
- Beljaars A. C. M , Brown A. R , Wood N . A new parametrization of turbulent orographic form drag. Q. J. Roy. Meteorol. Soc. 2004; 130: 1327–1347.
- Clark T. L , Peltier W. R . Critical level reflection and the resonant growth of nonlinear mountain waves. J. Atmos. Sci. 1984; 41: 3122–3134.
- Deacu D , Zadra A , Hanesiak J . Simulating wind channelling over Frobisher Bay and its interaction with downslope winds during the 7–8 November 2006 wind event. Atmos. Ocean. 2010; 48: 101–121.
- Durran D. R . Another look at downslope windstorms. Part I: on the development of supercritical flow in an infinitely deep, continuously stratified fluid. J. Atmos. Sci. 1986; 43: 2527–2543.
- Durran D. R . Mountain waves and downslope winds. Atmos. Process. Over. Complex. Terrain. Meteorol. Monogr. 1991; 43(45): 59–81.
- Erfani A , Mailhot J , Methot A , Gravel S , Desgagne M , co-authors . The 2.5 km horizontal resolution limited area version of the Global Environmental Multiscale model over Southern Ontario and Quebec. In: Abstracts of 15th International Great Lakes Operational Meteorology Workshop, 25–27 October 2006. 2006; ON, Canada: Niagara Falls.
- Gohm A , Mayr G. J . Numerical and observational case-study of a deep Adriatic bora. Q. J. Roy. Meteorol. Soc. 2005; 131: 1363–1392.
- Gohm A , Mayr G. J , Fix A , Giez A . On the onset of bora and the formation of rotors and jumps near a mountain gap. Q. J. Roy. Meteorol. Soc. 2008; 134: 21–46.
- Gordon M , Biswas S , Taylor P. A , Hanesiak J , Albarran-Melzer M , co-authors . Measurements of drifting and blowing snow at Iqaluit, Nunavut, Canada during the STAR Project. Atmos. Ocean. 2010; 48: 81–100.
- Gyüre B , Jánosi I. M . Stratified flow over asymmetric and double bell-shaped obstacles. Dyn. Atmos. Ocean. 2003; 37: 155–170.
- Hanesiak J , Stewart R , Taylor P , Moore K , Barber D , co-authors . Storm studies in the Arctic (STAR). Bull. Am. Meteorol. Soc. 2010; 91: 47–68.
- Hudson E , Aihoshi D , Gaines T , Simard G , Mullock J . The Weather of Nunavut and the Arctic. 2001; Navcanada Report, Government of Canada, Ottawa, Ontario, 246.
- Jiang Q , Doyle J. D . Diurnal variation of downslope winds in Owens Valley during the Sierra Rotor Experiment. Mon. Wea. Rev. 2008; 136: 3760–3780.
- Jiang Q , Doyle J. D , Wang S , Smith R. B . On boundary layer separation in the lee of mesoscale topography. J. Atmos. Sci. 2007; 64: 401–420.
- Kahl J. D . Characteristics of the low-level temperature inversion along the Alaskan Arctic coast. Int. J. Climatol. 1990; 10: 537–548.
- Kim J , Mahrt L . Momentum transport by gravity waves. J. Atmos. Sci. 1992; 49: 735–748.
- Klemp J. B , Durran D. R . Numerical modelling of bora winds. Meteorol. Atmos. Phys. 1987; 36: 215–227.
- Klemp J. B , Lilly D. K . The dynamics of wave induced downslope windstorms. J. Atmos. Sci. 1975; 32: 320–339.
- Long R. R . Some aspects of the flow of stratified fluids II, experiments with a two fluid system. Tellus. 1954; 6: 97–115.
- Mailhot J , Belair S , Lefaivre L , Bilodeau B , Desgagne M , co-authors . The 15-km version of the Canadian Regional Forecast System. Atmos. Ocean. 2006; 44: 133–149.
- Mesinger F , DiMego G , Kalnay E , MItchell K , Shafran P. C , co-authors . North American regional reanalysis. Bull. Amer. Meteor. Soc. 2006; 87: 343–360.
- Mobbs S. D , Vosper S. B , Sheridan P. F , Cardoso R , Burton R. R , co-authors . Observations of downslope winds and rotors in the Falkland Islands. Q. J. Roy. Meteorol. Soc. 2005; 131: 329–351.
- Nadeau D . Impacts of Synoptic Atmospheric Circulations and Topographic Conditions on Sustained Strong Surface Winds Over Southern Nunavut. 2007; Master's Thesis. McGill University, Montreal, Quebec.
- Nawri N , Stewart R. E . Climatological features of orographic low-level jets over Frobisher Bay. Atmos. Ocean. 2006; 44: 397–413.
- Reinecke P. A , Durran D. R . Initial-condition sensitivities and the predictability of downslope winds. J. Atmos. Sci. 2009; 66: 3401–3418.
- Sheridan P. F , Vosper S. B . A flow regime diagram for forecasting lee waves, rotors and downslope winds. Meteorol. Appl. 2006; 13: 179–195.
- Smith R. B . The influence of mountains on the atmosphere. Adv. Geophys. 1979; 21: 87–230.
- Smith R. B . On severe downslope winds. J. Atmos. Sci. 1985; 42: 2597–2603.