Abstract
A low-level wind maximum is often found over the oceans near many coasts around the world. These Coastal Low-Level Jets (CLLJs) play an important role in the coastal weather and have significant impacts on regional climate and ecology as well as on a number of human activities. The presence of CLLJs is related to various local circumstances such as land-sea temperature contrasts, upwelling, coastal terrain, orientation of the coast, and so on, but also to the large-scale atmospheric dynamics. This makes studies of CLLJs not only interesting but also challenging. In this study, based on ERA-Interim reanalysis data, the global distribution, spatio-temporal structure and the seasonal variability of CLLJs are documented. Seasonal data from 1980 to 2011 are used to identify areas where CLLJs are frequently found in the lowest 2 km, following criteria based on the vertical profiles of wind speed and temperature. The results are analysed to highlight the fundamental aspects and distinctive features of the CLLJs across the globe, including their occurrence rate, jet height, maximum wind speed and horizontal extent. Global maps of CLLJs are constructed for the summer and winter seasons. The west coasts of North America, the Iberian Peninsula, north-western Africa and the south-eastern coast of the Arabian Peninsula make up the Northern Hemispheric CLLJ regions, while the west coasts of South America, Australia, and southern Africa comprise the South Hemispheric equivalents. The existence and characteristics of CLLJs along the southern coast of Oman and the western coast of the Iberian Peninsula regions are also discussed, not fully envisaged before in the context of CLLJs. The highest occurrence of CLLJs is found during the summer in both hemispheres, and the coast of Oman has the globally highest CLLJ frequency, with also the highest maximum wind speeds. The most commonly found CLLJ has a maximum wind speed between 9 and 15 m s−1, and occurs at heights between 500 and 700 m a.s.l.
1. Introduction
A low-level jet (LLJ) is a mesoscale-flow phenomenon that is characterised by a sharp maximum in the wind-speed profile within the lowest few kilometres of the troposphere. LLJs have a relatively small vertical extent, often only a few hundred metres, but their horizontal extent can exceed hundreds of kilometres. LLJs have been observed over many continents, with some notable studies over North America (Bonner, Citation1968; Parish et al., Citation1988), South America (Virji, Citation1981, Citation1982; Marengo et al., Citation2004), Africa (Findlater, Citation1969, Citation1972; Hart, Citation1977; Ardanuy, Citation1979), Australia (Wilson, Citation1975; Brook, Citation1985; Garratt, Citation1985; Keenan et al., Citation1989), Asia (Findlater, Citation1969; Chen and Yu, Citation1988) and Antarctica (Schwerdtfeger, Citation1975; Parish, Citation1983, Citation1992).
Although the basic criterion to define an LLJ relies on examining the vertical profile of the horizontal wind for the wind maxima, LLJs can also be categorised based on their spatial location, horizontal and vertical structure, time of occurrence and mechanism of formation. The concept of the nocturnal LLJ as an inertial oscillation in the boundary layer, triggered by a rapid reduction in the surface stress, was established by Blackadar (Citation1957). This type of jet is typically initiated near sunset and has a maximum wind speed determined by the inertial frequency of the location, as governed by the Coriolis parameter. The most renowned of these jets is perhaps the US Great Plains LLJ (Blackadar, Citation1957; Hoecker, Citation1963; Bonner, Citation1968; McNider and Pielke, Citation1981; Parish et al., Citation1988; Whiteman et al., Citation1997), which has a distinct nocturnal component, but is also greatly affected by the slope of the terrain east of the Rocky Mountains. It is highly ageostrophic, with maximum wind speeds reached shortly after midnight. The barrier jet (Schwerdtfeger, Citation1979; Parish, Citation1982; Li and Chen, Citation1998) is another example of an LLJ; here the wind is in a direction parallel to the barrier and is near-geostrophic. Another type of LLJs are the ones found offshore in coastal regions (Zemba and Friehe, Citation1987; Doyle and Warner, Citation1991; Douglas, Citation1995; Burk and Thompson, Citation1996; Holt, Citation1996; Parish, Citation2000). These are generally termed Coastal Low-Level Jets (CLLJs) and are the focus of this article.
Coastal jets are primarily a consequence of the thermal contrast between land and ocean; the resulting coast-parallel winds are the geostrophically adjusted response to the thermal gradient associated with Coriolis deflection (Parish, Citation2000). This phenomenon also has a diurnal cycle (e.g. Beardsley et al., Citation1987), but in contrast to the nocturnal LLJ it has a mid-afternoon wind-speed maximum, subsequent to the maximum inland heating. Viewed as a geostrophic adjustment process, one expects the jet to be located within a Rossby radius of deformation λ R from the coast. Here λ R =NH/f, with H the depth of the marine atmospheric boundary layer (MABL), N the Brunt–Väisälä frequency across the MABL capping inversion and f the Coriolis parameter. The coastal topography and its orientation at some places results in local enhancements of the flow (Winant et al., Citation1988; Burk and Thompson, Citation1996; Tjernström and Grisogono, Citation2000), but in case of blocking terrain, the flow is semi-geostrophic when it is blocked by the topographic barrier. An important feedback once a jet has formed arises from the secondary vertical circulation around the jet, which causes the marine boundary-layer capping inversion to slope downwards towards the coast; this generates a thermal-wind response in the vertical that further enhances the jet (e.g. Beardsley et al., Citation1987). The most studied CLLJ is along the coast of California (e.g. Beardsley et al., Citation1987; Parish, Citation2000). It has a pronounced wind maximum as low as within the lowest few hundred metres close to the coast, and its core lies at the sloping top of the marine boundary layer, where a distinct temperature inversion is known to exist (Burk and Thompson, Citation1996). The sharp capping inversion is a consequence of the combined effects of the subsidence from the sub-tropical high-pressure region acting from above and turbulent mixing acting from below. Large-scale flow parallel to the coast, north–south coastal mountains, and the presence of an inversion are some prominent characteristics of the California CLLJ.
Studies have shown that coastal jets can play a significant role in the regional climate of coastal regions, including fog, high wind speeds, precipitation, and cloudy conditions. Although the oceans are the biggest source of atmospheric moisture, barren and dry environments are often bounded by the sea in the sub-tropics. One notable example is the Atacama Desert inland of the Chilean LLJ, the Southern Hemisphere analogue of the California jet (Garreaud and Muñoz, Citation2005). This jet enhances coastal upwelling and contributes towards an arid climate. The upwelling enhanced by the CLLJ along the coast of Atacama cools the surface water, suppresses the moisture-absorbing capacity of onshore winds and creates a persistent inversion, thereby trapping moisture within the MABL. A very steep coastal topography further prevents any advection of moisture deep in-land.
The present knowledge about CLLJs is mostly based on field campaigns, essentially carried out during the summer season (e.g. Rogers et al., Citation1998; Rahn and Garreaud, Citation2010) as well as modelling and theoretical studies (e.g. Burk and Thompson, Citation1996; Muñoz and Garreaud, Citation2005). While CLLJs have been observed, described and modelled in a variety of studies, a global climatology of coastal jets has not yet been presented, despite their importance for regional coastal climates. Moreover, although coastal jets offshore California and Chile-Peru have been relatively well studied (particularly the former), this is not the case with coastal jets in many other areas, where few or no dedicated studies have been pursued. The goal of this investigation is to present a global climatology of CLLJs based on the European Centre for Medium-Range Weather Forecasts (ECMWF) ERA-Interim reanalysis (Dee et al., Citation2011).
This article is structured as follows: in Section 2, the analysis methodology and ERA-Interim reanalysis data are briefly described. Section 3 presents an overview of the global CLLJ climatology and its variability, along with a sensitivity analysis of the CLLJ identification algorithm. In Section 4, results are presented for different regions, and Section 5 comprises an inter-comparison between the CLLJ regions, whereafter the study is concluded by some comments along with suggestions for further research in Section 6.
2. Data and methodology of analysis
In the literature, many different criteria have been suggested for identifying LLJs, with the most prominent one found in a seminal study by Bonner (Citation1968). Here, Bonner classified LLJs into three overlapping groups based on the magnitude of the wind speed at the jet maximum, and furthermore required a falloff in the wind speed above this level. Subsequently, there have been numerous studies based on either this criterion or on variants of it, identifying LLJs solely on the basis of wind-speed profiles (e.g. Mitchell et al., Citation1995; Arritt et al., Citation1997).
As mentioned above, one well-studied example of a coastal jet is the one along the coast of California; we therefore use this as a benchmark for a typical CLLJ. But in order to produce an objective global CLLJ climatology, the criteria must be defined in a distinct way that positively and unambiguously identifies the CLLJs, however, is capable of sorting out other types of low-level wind maxima. We therefore define a criteria based on the wind-speed maximum in the vertical as well as a distinct shape of the absolute-temperature profile, in contrast to the potential-temperature profile considered in earlier studies. For reasons to be discussed later, the potential-temperature inversion does not uniquely identify the presence of CLLJs at all locations.
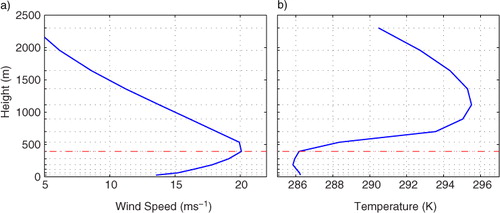
As an example of a typical CLLJ, shows vertical profiles of wind speed and temperature offshore (39°N–125°W) the coast of California for a typical summer event (10 July 2006) taken from ERA-Interim. The wind speed increases with height until it reaches a maximum of 20 m s−1 at 395 m followed by a decrease of speed above the maximum (a). This constitutes the characteristic wind-speed profile used to identify the CLLJs in this study. The accompanying temperature profile (b) shows a distinct inversion at or around the level of the jet maximum, which is used as a supplementary criterion for positively identifying the presence of a CLLJ.
Fig. 1 Vertical profiles of (a) wind speed and (b) temperature for a CLLJ along California at 39°N–125°W using Era-Interim data. Red line indicates the level of wind maxima while grid lines represent vertical grid spacing corresponding to Era-Interim model vertical levels.
To map the global occurrences of CLLJs, the following criteria for wind speed and temperature have been translated into an algorithm:
The jet maximum is found within the lowest 2 km.
The wind speed at the jet maximum is at least 20% higher than at the surface (i.e. the lowest model level in our study);
The wind speed above the jet maximum decreases to below 80% of that at the surface (i.e. a 20% fall off) within 5 km above the maximum;
The temperature at the jet maximum is lower than that at two model levels above (inversion detection); and
The maximum temperature does not occur at the surface (rejection of surface-based inversion).
The algorithm systematically scans the global data and identifies the CLLJ locations and occurrences based on the vertical profiles of wind and temperature. The purpose of the algorithm is to provide a quantitative technique for objectively identifying CLLJs, which is applicable to any gridded data set of reasonable spatio-temporal resolution. The use of relative threshold values for wind speed at the jet maximum with the subsequent fall off helps to provide a consistency in the detection mechanism. It ensures that the identification of CLLJs is always based on a distinct jet-like profile, no matter how strong or weak the wind speed is. It also helps to prevent the occurrence of false positives due to sudden changes in the wind speed, since the profile is based on a relative wind-speed criterion. When the algorithm has identified a CLLJ profile, information about the jet location, its height, speed and direction are recorded for each date and time.
In what follows, we apply the CLLJ criteria to the global ERA-Interim reanalysis data set. Fields of temperature and wind speed at 1°×1° horizontal resolution and 60 vertical model levels (13 levels below 2 km) are used in the analysis. The horizontal wind speed is calculated from the u and v wind components using . The lowest model level is at around 25 m and the temporal resolution is 6 hours, with daily outputs at 00, 06, 12 and 18 UTC. The analysis is undertaken for 31 yr of data from 1980 to 2011 for the boreal and austral summer seasons, namely June, July, August (JJA) and December, January, February (DJF), respectively.
Reanalysis is a powerful tool for studying atmospheric processes and climate by virtue of providing global and temporal coverage of dynamically consistent data that are an optimal mix of model output and observations. The use of reanalysis data for climatological studies and for regions where observational data are sparse has become a common approach. However, it should be noted that these data have their own limitations. Chelton et al., (Citation2006) showed that the ECMWF global numerical weather prediction model underestimates the spatial variability of the wind fields on scales smaller than 1000 km in comparison with the QuikSCAT observations. Similarly, Kent et al., (Citation2012) suggest that coastal winds from ERA-Interim are lower than those from QuikSCAT although the ERA-Interim assimilates the QuikSCAT observations. Chelton et al., (Citation2006), however, argue that this information is underutilised by the global models. These inaccuracies in the reanalysis data can be significant along land-sea boundaries and can be a consequence of spillover of land-data winds into the oceanic region due to the coarse resolution of global models. Therefore, typically lower wind speeds from land-points contaminate the winds over the near-coast ocean (Kara et al., Citation2008). Coarse resolution also affects the slope of the marine inversion towards the coast and thereby reduces the wind speed. Such possible underestimation of the wind speeds should to be taken into account when interpreting the global CLLJ statistics from reanalysis; note, however, that most of these effects act to reduce the strengths of the CLLJ and seldom the opposite.
3. Global climatology of CLLJs
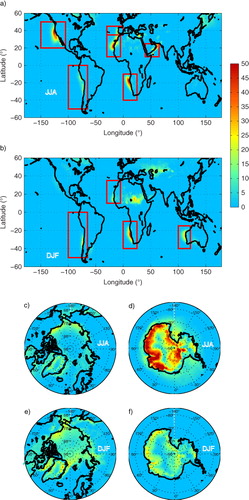
After subjecting the ERA-Interim reanalysis data to the detection algorithm, global maps of climatological CLLJ occurrences (in percentages) for the JJA and DJF seasons are obtained (). The maps depict that the percentage of the number of times CLLJs are positively identified out of the total data points analysed for each grid-point. It is observed that CLLJs are spread across the globe with varying frequencies and spatial locations during both seasons.
Fig. 2 Global maps of CLLJ frequency of occurrence (%) with regions of interest enclosed in red for (a) JJA global, (b) DJF global, (c) JJA north of 60°N, (d) JJA south of 60°S, (e) DJF north of 60°N, (f) DJF south of 60°S.
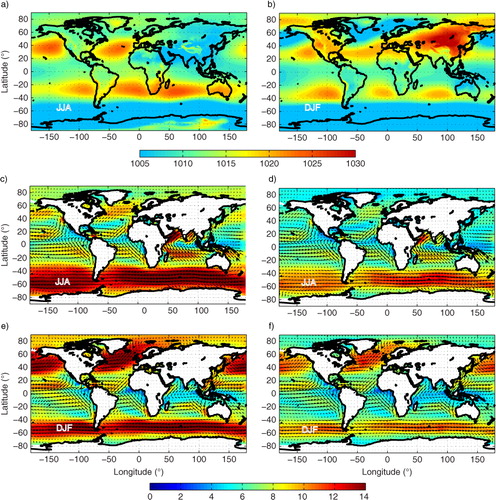
CLLJs are a consequence of land-sea thermal contrasts. In summer, thermal low-pressure systems develop over land due to intense heating, while the high heat capacity of the oceans, cold equator-ward boundary ocean currents and upwelling tend to keep the sea-surface temperature (SST) considerably cooler. This results in a sharp temperature and pressure contrast, which in turn induces pronounced baroclinic effects along the coast. The resulting pressure gradient preconditions the formation of the CLLJs, and is seen in the climatological mean sea-level pressure (MSLP) fields for JJA and DJF (a and b). Strong sub-tropical high-pressure systems can be seen offshore the western coasts of all continents. The large-scale wind pattern associated with these sub-tropical high-pressure systems (c–f) in both hemispheres gives rise to coast-parallel winds in the sub-tropical latitudes. These highs are more prevalent during the summer season (a and b), particularly in the Northern Hemisphere. In the Southern Hemisphere the three high-pressure systems have a less pronounced seasonality. Furthermore, five of the CLLJ regions in (a) and (b) coincide with cold equator-ward ocean boundary currents, located on the eastern side of the sub-tropical gyres: the California and the Canary currents in the Northern Hemisphere, and the Peru, Benguela and Western-Australia currents in the Southern Hemisphere. In the case of the Arabian Sea, low pressure over continental Asia and high pressure over the Indian Ocean in summer give rise to geostrophically balanced coast-parallel southwesterly airflow (Findlater, Citation1969). A comparison between the MSLP and wind-speed fields () and the CLLJ hotspots in provides a large-scale picture of the likely areas of CLLJ occurrence, and hence explains the findings in .
Fig. 3 Globally averaged ERA-Interim mean sea-level pressure (MSLP) for (a) JJA season (b) DJF season, and wind speed for (c and d) JJA at 400 m a.s.l. and at the lowest model level, (e and f) DJF at 400 m a.s.l. and at the lowest model level. The data are from the period 1980–2011.
Coastal upwelling usually occurs in relation to the cold ocean currents and very often, the large-scale flow pattern that favours the formation of a CLLJ also fosters the coastal upwelling. Consequently, there are upwelling zones on the west coasts of all continents, that is Africa, Australia, North and South America. In case of the southeastern coast of the Arabian Peninsula, the warm and moist southwesterly monsoon winds (Findlater, Citation1969) induce upwelling along the coast of Oman. In turn, the upwelling brings cold waters to the surface, decreases the SSTs and cools the marine boundary layer, which increases the thermal gradient across the coast. The stronger temperature gradient results in stronger CLLJs, stronger winds, which facilitates more upwelling, that is a classical example of a positive feedback.
When applying the CLLJ criteria, LLJs are also found in some areas other than the coastal regions enclosed by the boxes in (a) and (b). Many occurrences are also recorded in the polar regions (i.e. north of 60°N and south of 60°S), shown separately in (c–f). The majority of the jets in these regions is found over land, especially Greenland and the Antarctic continent, and are katabatic winds, being more frequent during the winter season (d and e). These occurrences show up in this plot since the strong katabatic flows cause vertical mixing near the surface, thereby forming an elevated inversion with a shallow mixed layer below, a situation which bypasses the surface-inversion criterion discussed above. Although interesting by themselves, we will not consider these features further in this study. There are also LLJs over the ocean in the polar regions, mainly along the sea-ice border; it may be argued that the ice-edge serves as a kind of dynamic coastline. Although the classification criteria are met, we do not regard these as CLLJs, and hence they will not be further discussed here.
Also, in (b), a region with considerable LLJ intensity can be seen around 15°N–20°E in Chad, Africa. This is the Bodélé LLJ (Washington and Todd, Citation2005; Todd et al., Citation2008) occurring during boreal winter and considered to be accelerated by the topographic channelling of north-easterlies between the Tibesti mountains and the Ennedi massif of Chad. The Bodélé is located within the hyper-arid Sahara where the LLJ exhibits a strong diurnal cycle, which most likely is related to the inertial-oscillation mechanism proposed by Blackadar (Citation1957). The mean temperature profiles from the regional climate model simulations over the Bodélé region depict a pronounced nocturnal inversion of ~9 K (Todd et al., Citation2008). However, intense surface heating accompanied by turbulent mixing suppresses the temperature inversion during the day and by the middle of the day the temperature is characterised by an almost dry-adiabatic lapse rate. Because of this inversion in temperature and associated LLJ winds, this region is classified as a CLLJ location in (b) since it satisfies the CLLJ criteria, although with a relatively low occurrence frequency due to strong diurnal variations. As it is evident that this is not a CLLJ location, it is not considered for further detailed analysis.
The coastal areas where CLLJs have significant occurrences coincide, with some exceptions, with the areas of coastal-jet expectancy mentioned by Winant et al., (Citation1988). These areas, encompassing regions of individual CLLJ occurrences are shown in (a) and (b), enclosed in boxes. Continental America comprises two regions with CLLJ occurrences: one along the west coast of the United States of America (USA), mostly in California, and a second one along the South-American west coast, from Peru to Chile. These two areas will henceforth be denoted as the North-American coastal jet (NACJ) and SACJ, the North/South-American coastal jet (SACJ), respectively. While the seasonality of the NACJ is noticeable, with the jet only present in JJA, the SACJ is prevalent during both seasons, although more predominant during the austral summer.
Europe and Africa also comprise regions with CLLJ occurrences, in Europe along the west coast of the Iberian Peninsula, whereas the west coasts of Morocco/Mauretania, Namibia and South Africa, constitute the African CLLJ regions. The North Atlantic sub-basin CLLJ is separated into two areas by the Gulf of Cadiz. These two regions will be treated separately and will henceforth be denoted as the IPCJ (Iberian-Peninsula coastal jet), and as the NAFCJ (North-African coastal jet), whereas the southern-African area will be denoted as SAFCJ (Southern-African coastal jet). The IPCJ and the NAFCJ occurrences exhibit a strong seasonality, similar to the NACJ. The NAFCJ is still present in DJF, that is the Northern Hemisphere winter, although shifted equator-ward. The SAFCJ is, of all the coastal jets identified in (a) and (b), the most prevalent, and is almost equally present in JJA and DJF, although exhibiting a significant north–south shift between seasons.
CLLJs are also found in Asia and Australia (a and b). One is located along the southeastern coast of the Arabian Peninsula at Oman, the APCJ (Arabian Peninsula coastal jet) and the other along the west coast of Australia, the AUCJ (Australian coastal jet). The APCJ is unique in the sense that it does not occur along a western coast.
3.1. Sensitivity of the algorithm
Although it has been demonstrated that the CLLJ detection criteria defined in Section 2 successfully captures and maps the global occurrences of CLLJ events, some questions might arise about the accuracy of the algorithm: have some regions been left undetected, and what effect has the choice to use absolute temperature (instead of potential temperature) in the identification criteria? These issues can be addressed by selecting a region with jet-like phenomena and subjecting it to the classification algorithm described in Section 2. For this purpose, we examine the Caribbean region (a) which is known to have a LLJ (Amador, Citation1998; Amador and Magaña, Citation1999; Amador et al., Citation2000). However, this feature is not considered a CLLJ, since it is controlled by the SST forcing as opposed to thermal land-sea contrasts. Due to its occurrence over the ocean and its close proximity to the coast, it nevertheless serves as a reasonable region for testing the CLLJ detection algorithm.
Fig. 4 (a) Mean wind speed at 400 m a.s.l. for a summer event (July 2006), and (b) vertical profiles of wind speed, temperature and potential temperature at 13°N–74°W. The vertical height scales in and subsequent figures correspond to the Era-Interim model height levels.
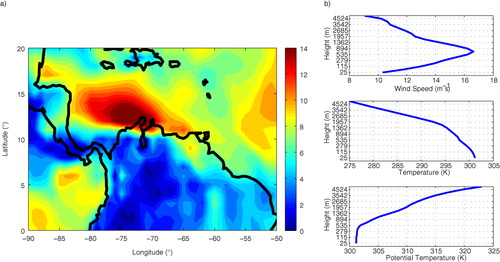
From (a), an area of strong marine winds can be seen around the Caribbean region, centred roughly at 13°N–74°W at 400 m a.s.l. Vertical profiles of wind speed, temperature and potential temperature typical for this region are shown in (b). It is seen that the wind speed exhibits the distinct jet-like profile discussed earlier here and in many previous studies (e.g. Stensrud, Citation1996), but the temperature profile, however, shows a vertically decreasing temperature. This is not the characteristic temperature profile discussed in Section 2, which has a distinct inversion at or near the nose of the jet. However, the potential-temperature profile shows increasing stability, that is an inversion below the nose of the jet, but since it is not used as an identification criterion, it is disregarded. This explains why the Caribbean region is not visible in the CLLJ occurrence map (a and b) despite having jet-like winds and being in proximity to the coast.
Similarly, shows a snapshot (at an arbitrarily chosen time) of ERA-Interim wind speeds at a number of locations over the South Atlantic between the South American and southern African coasts. A continuous band of strong winds, at a height of 400 m a.s.l., is found from the west coast of South Africa to the east coast of Brazil. From a horizontal perspective, points A, B, C and D in exhibit high wind speeds and are located mostly along the coasts. By examining the vertical profiles (b–e), it is evident that all the points also show a jet-like wind-speed profile. However, only point D (along the coast of Namibia) has the distinct temperature profile of a CLLJ (e), whereas points A and C (along the Brazilian coast), as well as point B offshore, do not manifest the characteristic temperature profile and hence do not qualify for a CLLJ classification, despite having a pronounced jet-like vertical wind profile. This is evident in (a) and (b), where the presence of a CLLJ is only detected along the Namibian coast.
Fig. 5 (a) Wind speed at 400 m a.s.l. for a southern hemispheric summer event (5 January 2005), and vertical profiles of wind speed, temperature and potential temperature for (b) point-A (c) point-B (d) point-C and (e) point-D.
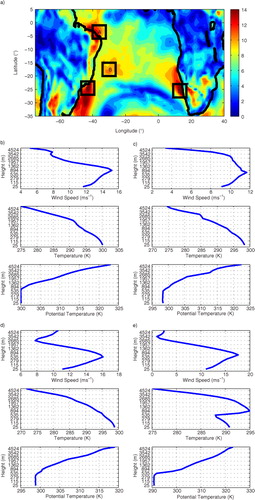
It should also be noted that the potential-temperature profile for each of these points (b–e) has layers of increasing stability around the nose of the jet, although only point D is classified as a CLLJ (). Therefore, using potential temperature as a distinct criterion may positively identify CLLJs as in the case of point D, but can also lead to false positives, that is points A, B and C. Along the same pattern numerous other locations (not shown) were tested, but all with the same outcome, thus confirming the accuracy of the CLLJ detection criteria and providing the basis for not using potential-temperature profiles as a detection criterion.
4. Regional CLLJ statistics
Whereas (a) and (b) give a general overview of the CLLJ frequency of occurrence and distribution around the globe, a detailed examination of each regional coastal jet now follows (–). Statistics of the wind speed at the nose of the jet, its height and prevalent wind direction are presented and discussed for each region. Furthermore, across-coast cross-sections through the regions of maximum jet frequency are presented. While the vertical features are calculated for each grid-point at each time step, the cross-sections present the seasonally averaged wind speeds for the whole period of study. The locations of the cross-sections are chosen such that these transect the regions with maximum surface winds, perpendicular to the dominating wind direction, with close proximity to the CLLJ maximum of occurrence in each region in (a) and (b).
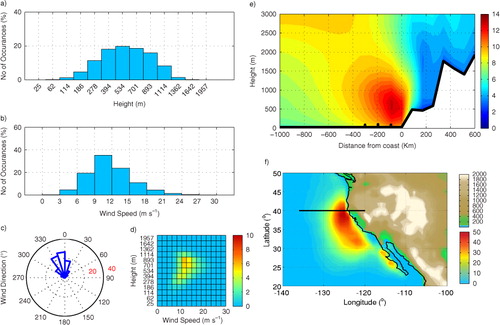
Fig. 6 CLLJ statistics for NACJ for JJA, (a) jet-height histogram (%), (b) jet wind-speed histogram (%), (c) jet wind direction (%), (d) jet height-wind histogram (%), (e) east-west cross-section at 40°N (wind speed in m s−1), with black dots for λ R and (f) frequency of occurrence (%), with topography (metres). Black line marks the cross-section.
First, we discuss the CLLJs that occur only during boreal summer or winter, and subsequently the regions with CLLJ occurrences during both seasons.
4.1. The North-American coastal jet
shows the jet characteristics of the NACJ for the JJA season. Around 75% of the total occurrences during the period of the study took place at heights between ~400 and ~900 m and nearly 15% from ~900 m to a little above 1000 m (a). The wind speed at the nose of the jet is between 9 and 15 m s−1 for almost 60% of the total occurrences, while nearly 20% show lower wind speeds, between 6 and 9 m s−1 (b). It is evident that the heights of the jet maxima are skewed towards the upper end, clearly visible in the height-wind histogram (d), where a major portion of the winds are located at heights greater than 600 m. Nearly, all of the winds are northerly (c), which in this region roughly corresponds to the coast-parallel flow shown in numerous previous studies. It also corroborates the fact that the US west coast is a CLLJ region, here positively identified by the detection algorithm. It should be noted that the wind-direction plots for the NACJ (c) and the subsequent regions have been calculated by using the wind directions for all the jets found in each region.
An east–west cross-section of the seasonally averaged wind speeds is shown in (e). Here, the core of the jet is at ~700 m, and the region with strongest winds (>14 m s−1) is found within 100 km from the shore. Farther offshore the jet is weaker and the height of the jet maximum increases. The jet has a considerable vertical extent and there is virtually no onshore intrusion, which can be explained by the presence of a steep coastal-mountain range (f), which acts as a barrier for the onshore extent of the jet. The three black indicators in represent the Rossby radius λ R, with the middle being the mean λ R for the whole period of study while the other two are ±2 standard deviations from the mean. The mean λ R is around 200 km and the jet core lies within this range and starts to decay further offshore.
4.2. The Iberian-Peninsula coastal jet
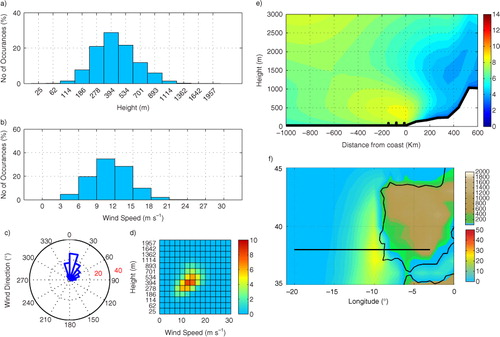
The west coast of the Iberian Peninsula is another region with CLLJs occurring only during JJA (a), which is related to the presence of the Azores High in the North Atlantic during this period (a). This semi-permanent high-pressure system, along with the thermal low-pressure inland of the Iberian Peninsula during the boreal summer gives rise to the coast-parallel flow (c and d) and consequently the CLLJ. Statistics for the JJA IPCJ are shown in . The height histogram (a) shows that the CLLJs in this region are mostly found within the lowest 500 m, with roughly 75% of the occurrences between 300 and 500 m a.s.l. This jet is relatively low in altitude; the wind speed is, however, not on the low side since nearly 65% of the occurrences take place at wind speeds between 9 and 15 m s−1 while 20% at lower winds between 6 and 9 m s−1. In the height-wind histogram (d), the highest wind speeds are confined between the 400 and 500 m levels. The winds are mostly northerly to north-easterly, specifically more-or-less parallel to the coast, which is a characteristic for most of the Northern Hemisphere CLLJs (c). An east–west cross-section is shown in (e) and it is evident that this is in general a weak CLLJ in terms of average wind speed, and its frequency of occurrence is low (f). The height of the jet core is around 500 m, its horizontal extent is nearly 140 km, and the jet becomes weaker farther offshore, consistent with the maximum Rossby radius λ R being around 150 km. The coastal topography (f) is low for the first 400 km inland, but since the jet is weak, there is no significant inland intrusion of the jet.
Fig. 7 CLLJ statistics for IPCJ for JJA, (a) jet-height histogram (%), (b) jet wind-speed histogram (%), (c) jet wind direction (%), (d) jet height-wind histogram (%), (e) east-west cross-section at 38°N (wind speed in m s−1), with black dots for λ R and (f) frequency of occurrence (%), with topography (metres). Black line marks the cross-section.
4.3. The Arabian-Peninsula coastal jet
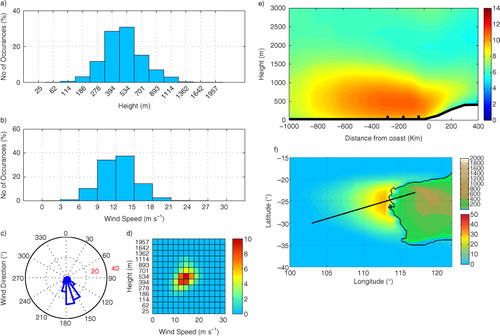
CLLJ statistics for the APCJ, which only occurs during JJA, are depicted in . This region differs geographically from the others, since this CLLJ is not along a west coast. The coast here is oriented south-west to the north-east, and hence the coast-parallel flow is south-westerly, away from the equator (c). The coast-parallel flow along the Arabian coast is a consequence of the southern-hemispheric southeasterly trade winds moving northwards to the low pressure over Asian landmass, which gives rise to a Coriolis-force-induced southwesterly flow. Nearly 60% of the CLLJ occurrences take place between roughly 400 and 500 m a.s.l, while 15% are at higher heights, roughly 700 m (a). This region has the globally highest wind speeds at the jet nose, with 80% of the winds between 9 and 21 m s−1 (b). From the height-wind histogram (d) it is seen that the highest wind speeds are found at levels between 400 and 500 m a.s.l.
Fig. 8 CLLJ statistics for APCJ for JJA, (a) jet-height histogram (%), (b) jet wind-speed histogram (%), (c) jet wind direction (%), (d) jet height-wind histogram (%), (e) cross-section perpendicular to the direction of wind (wind speed in m s−1), with black dots for λ R and (f) frequency of occurrence (%), with topography (metres). Black line marks the cross-section.
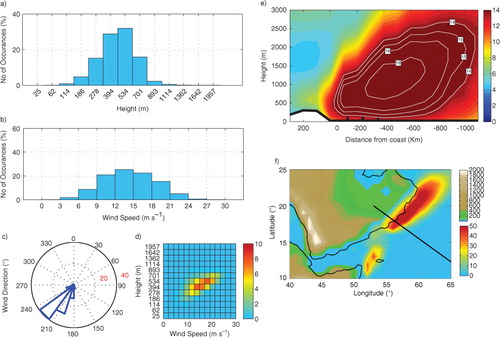
From the cross-section (e), it is evident that this is not only the strongest CLLJ among those investigated, but also that it has a different structure. The large jet core is dominated by winds in excess of 15 m s−1 with a horizontal extent well over 1000 km. The jet does not decay even beyond the maximum Rossby radius λ R of 356 km, most probably due to the interaction with the large-scale flow. The winds extend far offshore and impact a large area over the ocean, overlapping with the Findlater jet and the corresponding Indian-Monsoon system (Findlater, Citation1969). The coast of Oman is among the most intense upwelling regions of the world, with SSTs 5°C or more below the ambient offshore temperature and branches of cold water extending into the Arabian Sea (Elliot and Savidge, Citation1990; Manghnani et al., Citation1998). Strong channelling of the flow parallel to the coast and upwelling gives rise to the East Arabian Current (Shi et al., Citation2000). The upwelling cools the marine boundary layer, thus increasing the thermal gradient across the coast, resulting in stronger winds, which further reinforces the upwelling. Another interesting aspect of this CLLJ is the orientation of the coastal topography (f), which is steeper upstream (to the southwest) and decreases along the flow (to the northeast), where the large-scale flow is mostly parallel to the topography. However, the coastal topography in the Somali region is also an important factor in steering the flow towards the Arabian coast, hereby giving rise to southwesterly flow (Findlater, Citation1969).
4.4. The Australian coastal jet
The CLLJ along the west coast of Australia is only found during the austral summer (b). The combination of the high-pressure system in the south Indian Ocean (the Mascarene high), and the thermal low over the Australian land mass during the austral summer (b), drives the large-scale atmospheric circulation, and is responsible for the coast-parallel flow off the west coast of Australia. Conversely the disappearance of this pressure difference during winter (a) explains the absence of CLLJs during this season. From , it is seen that the CLLJ features in this region are quite distinct, both in terms of the wind speed and height. From the height-wind histogram (a), nearly 75% of the CLLJ occurrences have maximum wind speeds of 9–15 m s−1 at heights between 400 and 700 m, as also seen in the height-wind histogram (d). The wind-direction rose plot (c) shows southerly to south south-easterly winds parallel to the coast during nearly 70% of the time.
Fig. 9 CLLJ statistics for AUCJ for DJF, (a) jet-height histogram (%), (b) jet wind-speed histogram (%), (c) jet wind direction (%), (d) jet-height-wind histogram (%), (e) cross-section perpendicular to the wind direction (wind speed in m s−1), with black dots for λ R and (f) frequency of occurrence (%), with topography (metres). Black line marks the cross-section.
The coastal topography is not very elevated (f) and there is a considerable amount of inland intrusion of the jet, as seen in the cross-section (e). The mean height of the jet core is around 500 m, while the horizontal extent is about 400 km with decreasing winds farther offshore. The horizontal spread of the jet surpasses the maximum Rossby radius λ R of around 270 km and this can be explained by the absence of a topographic barrier to restrict the in-land intrusion. The location of the anticyclone farther west the ocean, away from continental Australia (b), can be attributed to the broad horizontal extent of the winds even beyond the maximum λ R.
4.5. The South-American coastal jet
We now direct our attention towards the statistics of the CLLJs present during summer as well as winter. The subtropical west coast of South America is under the influence of the southeast-Pacific anticyclone (the South Pacific High) during the entire year, resulting in predominantly southerly winds (). Consequently, the west coast of South America has CLLJ occurrences during both JJA and DJF (a and b). However, the CLLJs differ in terms of geographical location as well as frequency of occurrence for the two seasons. This is attributed to the strong DJF pressure gradient due to the presence of a thermal low over continental South America compared to weaker pressure gradient during JJA. In summer, the CLLJ is primarily concentrated towards the south and is more frequent relative to its winter counterpart, which is more horizontally spread out along the coast and is less frequent. It can be noted that during winter the horizontal spread of the CLLJ is prominent in two regions, one between 10° and 20°S and other between 20° and 30°S. However, in the former region the CLLJ is scattered. Detailed analyses of vertical profiles (not shown) reveal that it barely meets the CLLJ criteria and hence it may possibly not be classified as a CLLJ. Consequently, only the area between 20° and 30°S will be treated as a CLLJ region here.
shows the CLLJ statistics for the two seasons, highlighting wind-speed, jet-height, and wind-direction characteristics. The wind direction is southerly for the winter jet (e) as compared to south south-westerly for that in summer (g), that is parallel to the coast considering the coastal orientation in (k) and (l). The jet-height patterns for both the summer and winter CLLJs are fairly similar. However, compared to CLLJs in other regions, the jet-height distribution differs; a significant CLLJ frequency is seen at relatively higher altitudes, reaching up to roughly 1400 m a.s.l. The wind speed at the nose of the jet is higher in summer, with around 75% of occurrences between 9 and 18 m s−1, compared to 70% between 9 and 15 m s−1 during winter. The best perspective can perhaps be gained from the height-wind histograms (f, h). During JJA, the highest wind speeds are found at higher altitudes compared to the DJF counterpart, where the higher wind speeds occur at lower altitudes.
Fig. 10 CLLJ statistics for JJA (left) and DJF (right) for the SACJ, (a and b) jet-height histogram (%), (c and d) jet wind-speed histogram (%), (e and g) jet wind direction (%), (f and h) jet height-wind histogram (%), (i and j) east-west cross-section at 30°S and 34°S (wind speed in m s−1), with black dots for λ R and (k and l) frequency of occurrence (%) with topography (metres). Black line marks the cross-section.
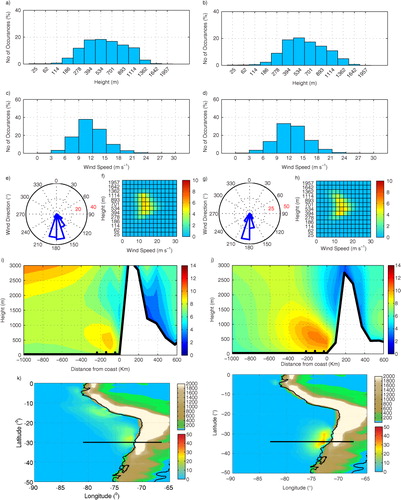
The coastal cross-section for the austral winter CLLJ is shown in (i). This is a relatively weak jet in terms of the percentage of occurrences (k) and dominant wind speed (c), which is also evident in the cross-section plot, where the averaged wind speed is around 9 m s−1 in the jet region. There is no onshore extent of the jet, since a significant topographic barrier is located along the coast (k). The mean Rossby radius λ R of around 150 km is in good agreement with the core of the jet, which loses strength beyond this distance from the coast and has decayed completely 350 km offshore. (j) shows the summer-season cross-section and, unlike winter, this is strong in terms of the mean seasonal wind speed, with winds of around 11 m s−1 at the core with a mean height of around 400 m a.s.l. The horizontal extent of the jet core is roughly 200 km offshore, with a steep coastal topography preventing any inland intrusion of the jet. It is also obvious here, that the summer CLLJ is located 4 further south as compared to the winter equivalent, which can be related to the position of the South-Pacific High (a and b) during summer and winter, cf. the discussion above. Muñoz and Garreaud (Citation2005), Garreaud and Muñoz (Citation2005) and Jiang et al. (Citation2010) have documented the existence and dynamics of the Chilean CLLJ by using mesoscale modelling for particular CLLJ episodes.
4.6. The North-African coastal jet
(a) and (b) depicts the summer and winter CLLJs for the NAFCJ with varying frequencies and geographical locations centred around 23°N for JJA and 16°N for DJF. The boreal summer CLLJ is more frequent and more horizontally spread along the coast as compared to the one during winter, which is less frequent and concentrated mainly to the south. Again, this is linked to the large-scale pressure pattern, where the semi-permanent Azores high during summer dominates the pressure gradient and hence yields northerly flow along the coast (a). During winter, however, the strength of this pressure gradient is considerably weaker (b) and therefore weaker low-level flow gives rise to a lower CLLJ frequency (b). As the summer CLLJ is mostly found over the northern section of the coast which is oriented north-east, the dominant wind direction is therefore north-easterly, parallel to the coast (e). During summer, the CLLJ is found at a higher altitude with nearly 80% of the occurrences within 400–700 m height range, compared to the winter conditions when it is found between 300 and 500 m a.s.l. The summer wind-speed pattern is also quite distinct with about 75% of the occurrences within 9 and 15 m s−1 and a further increase to 15 and 18 m s−1 for nearly 15% of the occurrences. The wind speeds during winter are weaker, with nearly 75% of the occurrences between 6 and 12 m s−1 , followed by 20% between 12 and 15 m s−1. This is also reflected in the wind-direction rose plot (e and g) where winds are seen to be less uniformly spread between north and east during winter compared to the mostly uniform north north-easterly winds in summer. The height-wind histograms in (f) and (h) (summer and winter, respectively) provide a conclusive overview, where the summer CLLJ has high wind speeds located at higher altitudes relative to winter equivalent which is found at lower heights with lower wind speeds.
Fig. 11 CLLJ statistics for JJA (left) and DJF (right) for the NAFCJ, (a and b) jet-height histogram (%), (c and d) jet wind-speed histogram (%), (e and g) jet wind direction (%), (f and h) jet height-wind histogram (%), (i and j) cross-section perpendicular to wind direction (wind speed in m s−1), with black dots for λ R and (k and l) frequency of occurrence (%) with topography (metres). Black line marks the cross-section.
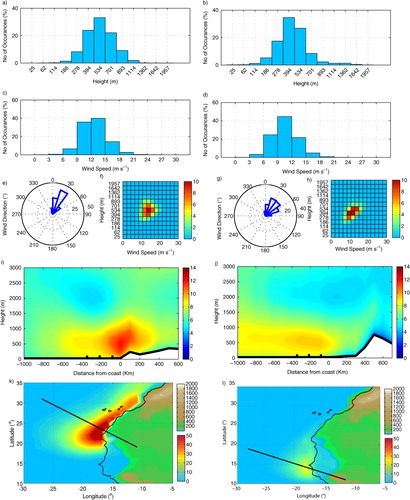
The cross-section for JJA (i) shows that the core of the jet is at an altitude of 500–600 m and gradually decreases in strength for about 400 km offshore. One interesting feature of the NAFCJ is the onshore extent of the CLLJ, which is also around 400 km. This onshore intrusion of the jet can be related to the shallow coastal topography (k) ranging between 200 and 400 m a.s.l. Its primary effect of this low topography is that it spreads the CLLJ horizontally along the coastline since there is no barrier to block the jet. Similarly, (j) shows the cross-section for the winter season, here the jet is weaker and shallower, and since it is located further south, the coastal terrain is nearly flat here. This absence of a topographical barrier is responsible for the horizontal spread and the consequent inland intrusion of the CLLJ.
4.7. The Southern-African coastal jet
The Namibian west coast is another region where CLLJs occur during summer as well as winter. The presence of the semi-permanent St. Helena High in the South Atlantic provides the large-scale conditions conducive to the development of a CLLJ (). However, unlike the regions previously examined, the CLLJ along the southern African coast (k and l) has a high frequency of occurrence during both seasons; this coast also has a very steep topography. Height histograms (a and b) show that the CLLJs during the austral winter take place across a wide band of heights between 200 and 1000 m, with a large number of occurrences between 400 and 500 m (which account for nearly 45% the total occurrences), whereas CLLJs during summer season are located somewhat higher, with nearly of 80% occurrences concentrated between 400 and 900 m. The wind-speed pattern (c and d) is also similar, during winter around 40% of occurrences are at lower wind speeds between 9 and 12 m s−1 whereas 20% are for somewhat higher wind speeds, that is between 12 and 15 s−1. During DJF, the wind speeds are between 9 and 15 m s−1 for nearly 65% of the time, and between 15 and 18 m s−1 for another 15% of the occurrences. The wind-direction plots (e and g) reveal that the winds are mostly south south-easterly, consonant with a CLLJ in the Southern Hemisphere. The summer counterpart is found at a relatively high altitude, and is a high-wind-speed CLLJ compared to the one during winter (f and h). Nicholson (Citation2010) has documented the existence of a summer CLLJ along the Benguela coast.
Fig. 12 CLLJ statistics for JJA (left) and DJF (right) for SAFCJ, (a and b) jet-height histogram (%), (c and d) jet wind-speed histogram (%), (e and g) jet wind direction (%), (f and h) jet height-wind histogram (%), (i and j) cross-section perpendicular to the wind direction (wind speed in m s−1) with black dots for λ R, (k and l) frequency of occurrence (%) with topography (metres), black line marks the cross-section.
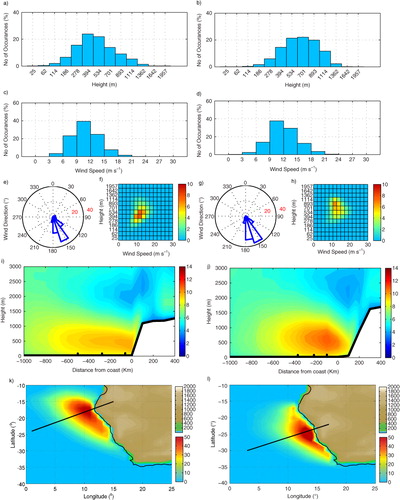
The cross-section for the austral winter CLLJ (i) shows a relatively shallow jet with its core at a height of around 400–500 m that extends about 100 km offshore. The jet decreases further in strength until around 600 km offshore. The mean Rossby radius λ R of about 300 km indicates the horizontal extent of the CLLJ.
The vertical extent of the jet is larger in summer and the mean height of the core is around 500 m, with wind speeds ranging from 12 to 14 m s−1 within a 100 km zone from the shore (j). The offshore extent of the jet is around 300 km, where the winds decrease to around 10 m s−1. An interesting aspect here is the varying steepness of the topography. The first 100 km inland, the topography is very shallow, whereafter the height increases steeply to around 1500 m. This change in topography is clearly reflected in the horizontal extent of the jet, which extends inland for the first 100 km with a wind maximum found at the coast. Farther inland the steep mountain barrier serves as an obstruction for the jet winds. The mean Rossby radius λ R of the CLLJ is around 240 km, indicating a stronger stability than found in many of the other regions discussed here.
5. Summary of global CLLJ occurrences
It is clear that the CLLJs in different regions vary as regards wind speed, altitude, and wind direction, and that even in the same region variations are found between seasons. presents a seasonal comparison between the CLLJ occurrences in all the regions, depicting the maximum percentage of occurrences for each season. The APCJ has the highest number of occurrences globally, with nearly 75% during the boreal summer. In other words, during this period there are roughly 23 d of CLLJs per month on average. However, the APCJ is totally absent in the winter season. Similarly, the region with the second highest frequency of CLLJ events is the southern-African coast. Contrary to the APCJ, it has CLLJ events during both seasons, with more than 50% occurrences for each season, which is unique among all the global CLLJs. As the southern African coast is in the Southern Hemisphere, nearly 63% of the CLLJ events take place during DJF, while nearly 52% occur during JJA. Another region with CLLJs during both seasons is the northwestern-African coast; while it is dominated by the CLLJs during the Northern Hemisphere summer with an occurrence rate of around 60%, it also has a considerable CLLJ frequency during winter with around 25% occurrences. It is the only region in the Northern Hemisphere to have a notable CLLJ presence during winter. The South-American coast is the third such region with CLLJs during both seasons. It is dominated by coastal-jet events during summer, which accounts for around 35% of occurrences, while 22% events take place during winter.
Fig. 13 Seasonal percentage CLLJ occurrences (maximum) for each region.
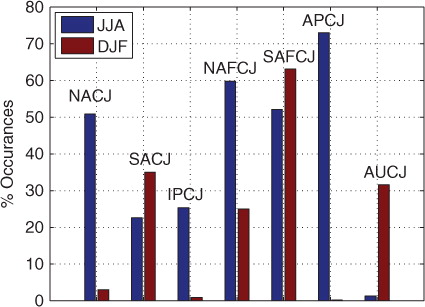
Other regions have CLLJs only during one season. The west coast of North America is such an area with more than 50% of jet occurrences during summer, while only having around 3% during winter. Similarly, the Iberian-Peninsula coast is also dominated by the summer-season coastal jet with an event rate of nearly 25%. The west coast of Australia is the only region in the Southern Hemisphere which does not have CLLJs during both seasons; rather it is dominated by summer-season CLLJs with an occurrence rate of around 33%. shows a summary of the overall comparative analysis of the maximum frequency of occurrence, mean wind speed and mean height of the CLLJs in all regions. The averages in this table have been determined using all the data points associated with a jet in each region.
Table 1. Summary of the regional CLLJ characteristics
6. Conclusions
CLLJs are an important mesoscale phenomenon of regional coastal climates around the world, and this study has documented their global distribution and seasonal variability. Seasonal ERA-Interim reanalysis data (JJA and DJF from 1980–2011) were used to map the global climatological frequency of CLLJs. In spite of the relatively coarse resolution of the reanalysis (1°×1°), in the sense that we were mostly interested in regional features, a global reanalysis is still the most coherent data set to pursue such a project, permitting an inter-comparison between different areas where CLLJs are found.
To map the global occurrence of CLLJs, a set of identification criteria were defined based on the vertical profiles of wind speed and temperature. For a positive identification of a CLLJ the wind-speed profile was required to have a maximum at a certain level, not too far above the surface (in our case below 2 km a.s.l.), followed by a decrease in wind speed aloft. This wind-speed-profile criterion was supplemented by requiring a distinct vertical temperature profile, which had to have an inversion at or around the level of the wind-speed maximum. It is furthermore worth emphasising the novel approach taken in this study of using the absolute temperature (instead of potential temperature) as a CLLJ identification criterion, as shown in Section 3.1, making it possible to eliminate spurious (although CLLJ-like) occurrences.
To provide objective maps of global CLLJ activity, the identification criteria were converted into an algorithm which was applied to the reanalysis data for the period of study. This allowed the identification of a number of areas where CLLJs are prone to occur during JJA and DJF. These areas, with the exception of the IPCJ, which was added as a coastal-jet region, coincide with the areas of expected CLLJ occurrence mentioned by Winant et al. (Citation1988; their Fig. 14). For the reasons mentioned in section 3, the coastal-wind phenomenon in the Caribbean Sea was ruled out and not considered as a CLLJ. A total of seven major regions were identified with frequent CLLJ occurrences. These are the west coasts of North and South America, the Iberian Peninsula, northeastern and southern Africa, Australia as well as the southern coast of Oman. Among these regions, four (the coasts of North America, the Iberian Peninsula, Oman, and Australia) had CLLJ activity only during their summers, whereas the remaining three regions (the coasts of South America as well as those of northeastern and southern Africa) had CLLJ activity during both seasons, although with variable frequencies of occurrence.
CLLJs are always more frequent during summer, since the temperature gradients and consequently the pressure gradients are strongest during this period. The large-scale conditions propitious for the development of coastal jets necessitate a persistent large-scale equator-ward flow (except for the Arabian Peninsula) oriented parallel to the coast. This is provided by a semi-permanent sub-tropical high-pressure system along with an inland thermal-low system. The locations that have CLLJs during both seasons are also those where these large-scale flow conditions are more similar across the seasons. In the case of the jet along the Arabian Peninsula, the responsible large-scale flow feature is the strong summer monsoon, the absence of which explains the absence of this jet in winter. Cold ocean currents are another favourable large-scale feature, as these equator-ward currents usually originate at high latitudes, are orientated along the west coasts of continents, and keep the ocean much cooler than land. The cold ocean water also provides a feedback, since a CLLJ often forces upwelling of even colder water along the coast which then serves to reinforce the CLLJ.
CLLJ statistics consisting of the jet height, location, wind speed and wind direction as well as cross-coast vertical sections were analysed. CLLJs along each region have a different vertical structure and horizontal span. Even the CLLJs occurring during both seasons within each region were shown to be structurally distinct, with variable strength and geographical position. The coast of Oman along the Arabian Sea exhibited the strongest CLLJ activity, with nearly 75% of total occurrences during the period of study. The presence of a CLLJ along the coast of Oman was relatively unknown and most studies have focused on the Somali Jet as being the prevalent low-level wind phenomenon along the Arabian-Sea coastal areas. Another prominent region with high CLLJ activity is the west coast of Southern Africa, with a more than 50% occurrence rate for both summer and winter. The west coast of the Iberian Peninsula also emerged as a CLLJ region, although relatively weak in terms of frequency of occurrence.
Many CLLJ regions have a substantial coastal orography that blocks inland penetration of the jet core. However, CLLJs also occur at some locations lacking this feature; in these cases the jet core often resides on top of the coastline and a considerable portion of the jet lies inland. The existence of a CLLJ therefore does not require significant blocking terrain; however, the presence of such a feature tends to strengthen the jet.
The CLLJ off the southeastern coast of Oman is, as seen from our findings and in spite of its high seasonality, the strongest in terms of wind speed at the jet core (with mean wind speeds in excess of 16 m s−1). It should be noted that the CLLJs in our study may be underestimated in strength. This arises from a possible under-forecasting of the wind speeds in ERA-Interim, most likely as a consequence of its coarse horizontal resolution. This is a factor that needs to be taken into account also when interpreting the statistics from the other regions. Another factor is the enhanced vertical momentum mixing applied in the model used for ERA-Interim. This typically results in too deep planetary boundary layer and a less sharp nose of the jet, as discussed by Cuxart et al. (Citation2006) and Svensson and Holtslag (Citation2009). Higher resolution model studies of the identified regions are called for to provide a more thorough and complete view of the climatology of each jet. Additionally, since CLLJs are a considerable part of the regional coastal climate, a study of the impact of global warming on the jets would be interesting. The subtropical semi-permanent high-pressure systems exert a major control of the location and seasonality of CLLJs, and since climate projections indicate a pole-ward migration of these systems (Bengtsson et al., Citation2006, Citation2009), the CLLJ characteristics could also be subject to change as well.
7. Acknowledgements
Raza Ranjha gratefully acknowledges support from the Higher Education Commission of Pakistan. The ERA-Interim data was obtained from the ECMWF data server. The authors are grateful to Dick Dee and Anton Beljaars at the ECMWF for help interpreting the ERA-Interim results. The authors are also thankful to the two anonymous reviewers for their constructive comments and suggestions and are further grateful to Peter Lundberg for valuable comments on a previous version of the article.
Related Research Data
References
- Amador J. A . A climatic feature of the tropical Americas: the trade wind easterly jet. Top. Meteorol. Oceanogr. 1998; 5(2): 1–13.
- Amador J. A , Magaña V. O . Dynamics of the low level jet over the Caribbean Sea. Preprints, Third Conference on Hurricanes and Tropical Meteorology. 1999; 868–869. Dallas, TX, AMS.
- Amador J. A , Magaña V. O , Pérez J. B . The low level jet and convective activity in the Caribbean. Proceedings of the 24th Conference on Hurricanes and Tropical Meteorology. 2000; 114–115. Ft. Lauderdale, FL, AMS.
- Ardanuy P . On the observed diurnal oscillation of the Somali jet. Mon. Weather Rev. 1979; 107: 1694–1700.
- Arritt R. W , Rink T. D , Segal M , Todey D. P , Clark C. A , co-authors . The Great Plains low-level jet during the warm season of 1993. Mon. Weather Rev. 1997; 125: 2176–2192.
- Beardsley R. C , Dorman C. E , Friehe C. A , Rosenfield L. K , Wyant C. D . Local atmospheric forcing during the Coastal Ocean Dynamics Experiment 1: a description of the marine boundary layer and atmospheric conditions over a northern California upwelling region. J. Geophys. Res. 1987; 92: 1467–1488.
- Bengtsson L , Hodges K , Keenlyside N . Will extra-tropical storms intensify in a warmer climate?. J. Clim. 2009; 22: 2276–2301.
- Bengtsson L , Hodges K , Roeckner E . Storm tracks and climate change. J. Clim. 2006; 19: 3518–3543.
- Blackadar A. K . Boundary layer wind maxima and their significance for the growth of nocturnal inversions. Bull. Am. Meteorol. Soc. 1957; 38: 283–290.
- Bonner W. D . Climatology of low-level jet. Mon. Weather. Rev. 1968; 96: 833–850.
- Brook R. R . The Koorin nocturnal low-level jet. Bound-Layer Meteorol. 1985; 32: 133–154.
- Burk S. D , Thompson W. T . The summertime low-level jet and marine boundary layer structure along the California coast. Mon. Weather. Rev. 1996; 124: 668–686.
- Chelton D. B , Freilich M. H , Sienkiewicz J. M , Von Ahn J. M . On the use of QuikSCAT scatterometer measurements of surface winds for marine weather prediction. Mon. Weather. Rev. 2006; 134: 2055–2071.
- Chen G. T.-J , Yu C.-C . Study of low-level jet and extremely heavy rainfall over northern Taiwan in the mei-yu season. Mon. Weather. Rev. 1988; 116: 884–891.
- Cuxart J , Holtslag A. A. M , Beare R. J , Bazile E , Beljaars A , co-authors . Single-column model intercomparison for a stably stratified atmospheric boundary layer. Bound.-Layer Meteorol. 2006; 118: 273–303.
- Dee D. P , Uppala S. M , Simmons A. J , Berrisford P , Poli P , co-authors . The ERA-Interim reanalysis: configuration and performance of the data assimilation system. Q. J. Roy. Meteorol. Soc. 2011; 137: 553–597.
- Douglas M. W . The summertime low-level jet over the Gulf of California. Mon. Weather. Rev. 1995; 123: 2334–2347.
- Doyle J. D , Warner T. T . A Carolina coastal low-level jet during GALE IOP 2. Mon. Weather. Rev. 1991; 119: 2414–2428.
- Elliot A. J , Savidge G . Some features of upwelling of Oman. J. Mar. Res. 1990; 48: 319–333.
- Findlater J . A major low-level air current near the Indian Ocean during the northern summer. Q. J. Roy. Meteorol. Soc. 1969; 95: 362–380.
- Findlater J . Aerial explorations of the low-level cross-equatorial current over eastern Africa. Q. J. Roy. Meteorol. Soc. 1972; 98: 274–289.
- Garratt J. R . The inland boundary layer at low latitudes. Bound. Layer Meteorol. 1985; 32: 307–327.
- Garreaud R. D , Muñoz R. C . The low-level jet off the west coast of subtropical South America: structure and variability. Mon. Weather. Rev. 2005; 133: 2246–2261.
- Hart J. E . On the theory of the east African low level jet stream. Pure Appl. Geophys. 1977; 115: 1263–1282.
- Hoecker W. H . Three southerly low-level jet systems delineated by the Weather Bureau special pibal network in 1961. Mon. Weather. Rev. 1963; 91: 573–582.
- Holt T. R . Mesoscale forcing of a boundary layer jet along the California coast. J. Geophys. Res. 1996; 101: 4235–4254.
- Jiang Q , Wang S , O'Neill L . Some insights into the characteristics and dynamics of the Chilean Low-Level Coastal Jet. Mon. Weather. Rev. 2010; 138: 3185–3206.
- Kara A. B , Wallcraft A. J , Barron C. N , Hurlburt H. E , Bourassa M. A . Accuracy of 10 m wind speeds from satellites and NWP products near land-sea boundaries. J. Geophys. Res. 2008; 113: C10020.
- Keenan T. D , McBride J , Holland G , Davidson N , Gunn B . Diurnal variations during the Australian Monsoon Experiment (AMEX) Phase II. Mon. Weather. Rev. 1989; 117: 2535–2553.
- Kent E. C , Fangohr S , Berry D. I . A comparative assessment of monthly mean wind speed products over the global ocean. Int. J. Clim. 2012
- Li J , Chen Y. L . Barrier jets during TAMEX. Mon. Weather. Rev. 1998; 126: 959–971.
- Manghnani V , Morrison J. M , Hopkins T. S , Böhm E . Advection of upwelled waters in the form of plumes off Oman during the Southwest. Monsoon. Deep-Sea Res. 1998; 45: 2027–2052.
- Marengo J. A , Soares W. R , Saulo C , Nicolini M . Climatology of the low level jet east of the Andes as derived from the NCEP–NCAR reanalyses: characteristics and temporal variability. J. Clim. 2004; 17: 2261–2280.
- McNider R. T , Pielke R. A . Diurnal boundary-layer development over sloping terrain. J. Atmos. Sci. 1981; 38: 2198–2212.
- Mitchell M. J , Arritt R. W , Labas K . A climatology of the warm season Great Plains low-level jet using wind profiler observations. Weather Forecast. 1995; 10: 576–591.
- Muñoz R. C , Garreaud R. D . Dynamics of the low-level jet off the West Coast of subtropical South America. Mon. Weather. Rev. 2005; 133: 3661–3677.
- Nicholson S. E . A low-level jet along the Benguela coast, an integral part of the Benguela current ecosystem. Clim. Change. 2010; 99: 613–624.
- Parish T. R . Barrier winds along the Sierra Nevada Mountains. J. Appl. Meteorol. 1982; 21: 925–930.
- Parish T. R . The influence of the Antarctic Peninsula on the windfield over the western Weddell Sea. J. Geophys. Res. 1983; 88: 2684–2692.
- Parish T. R . On the role of Antarctic katabatic winds in forcing large-scale tropospheric motions. J. Atmos. Sci. 1992; 49: 1374–1385.
- Parish T. R . Forcing of the summertime low-level jet along the California coast. J. Appl. Meteorol. 2000; 39: 2421–2433.
- Parish T. R , Rodi A. R , Clark R. D . A case study of the summertime Great Plains low-level jet. Mon. Weather. Rev. 1988; 116: 94–105.
- Rahn D. A , Garreaud R . Marine boundary layer over the subtropical southeast Pacific during VOCALS-REx – Part 1: mean structure and diurnal cycle. Atmos. Chem. Phys. 2010; 10: 4491–4506.
- Rogers D. P , Dorman C. E , Edwards K. A , Brooks I. M , Melville W. K , co-authors . Highlights of coastal waves 1996. Bull. Am. Meteorol. Soc. 1998; 79: 1307–1326.
- Schwerdtfeger W . The effect of the Antarctic Peninsula on the temperature regime of the Weddell Sea. Mon. Weather. Rev. 1975; 103: 45–51.
- Schwerdtfeger W . Meteorological aspects of the drift of ice from the Weddell Sea toward the middle-latitude westerlies. J. Geophys. Res. 1979; 84: 6321–6327.
- Shi W , Morrison J. M , Böhm E , Manghnani V . The Oman upwelling zone during 1993, 1994 and 1995. Deep-Sea. Res. Pt-II. 2000; 47: 1227–1247.
- Stensrud D. J . Importance of low level jets to climate: a review. J. Clim. 1996; 9: 1698–1711.
- Svensson G , Holtslag A. A. M . Analysis of model results for the turning of the wind and the related momentum fluxes and depth of the stable boundary layer. Bound. Layer Meteorol. 2009; 132: 261–277.
- Tjernström M , Grisogono B . Simulations of supercritical flow around points and capes in the coastal atmosphere. J. Atmos. Sci. 2000; 57: 108–135.
- Todd M. C , Washington R , Raghavan S , Lizcano G , Knippertz P . Regional model simulations of the Bodélé low-level jet of Northern Chad during the Bodélé Dust Experiment (BoDEx 2005). J. Clim. 2008; 21: 995–1012.
- Virji H . A preliminary study of summertime tropospheric circulation patterns over South America estimated from cloud winds. Mon. Weather. Rev. 1981; 109: 596–610.
- Virji H . An estimate of summertime tropospheric vorticity budget over South America. Mon. Weather. Rev. 1982; 110: 217–224.
- Washington R , Todd M. C . Atmospheric controls on mineral dust emission from the Bodélé Depression, Chad: the role of the low level jet. Geophys. Res. Lett. 2005; 32: L17701.
- Whiteman C. D , Bian X , Zhong S . Low-level jet climatology from enhanced rawinsonde observations at a site in the southern Great Plains. J. Appl. Meteorol. 1997; 36: 1363–1376.
- Wilson M. A . Atmospheric tidal motions over Australia below 20 kilometers. Mon. Weather. Rev. 1975; 103: 1110–1120.
- Winant C. D , Dorman C. E , Friehe C. A , Beardsley R. C . The marine layer off northern California: an example of supercritical channel flow. J. Atmos. Sci. 1988; 45: 3588–3605.
- Zemba J , Friehe C. A . The marine boundary layer jet in the coastal ocean dynamics experiment. J. Geophys. Res. 1987; 92: 1489–1496.