Abstract
The apparatus exploited in this work is composed of an optical cable linked to a portable FieldSpec UV/VNIR that records the spectral downwelling radiance in underwater environment, allowing us to calculate the shortwave attenuation coefficient in water. Results for three inland water bodies are presented under different atmospheric conditions (sun zenith angle and wind speed) and water composition (chlorophyll α concentration and turbidity). We show that the spectral downwelling zenith radiance profiles under high sun elevations present a positive slope in the upper layers due to relatively high scattering of direct sunlight compared to attenuation. For deeper layers, attenuation overcomes the scattering of sunlight leading to a constant negative logarithmic slope. For low sun elevations, a negative slope is observed in the entire water column since the scattering of direct sunlight is always lower than attenuation. Whenever a negative logarithmic constant slope is observed, the attenuation coefficient was computed. A relation was observed between attenuation coefficient in the photosynthetically active radiation (PAR) spectral region and water turbidity, for the three water bodies under study.
1. Introduction
The supply of solar energy into the upper layers of water masses is subject to fluctuations that affect several processes in the photic zone of these layers, including photosynthetic processes and subsequently the phytoplankton communities (Bukata et al., Citation1995; Wozniak et al., Citation2003). The sum of absorption and scattering processes is a measure of attenuation of the light beam through the water column. The spectral attenuation coefficient in the direction of light propagation (K) is by definition,1
where z is the depth, θ the sun zenith angle, φ the sun azimuth angle, λ the wavelength and L the radiance. The radiance distribution near the surface presents a complex structure that can be deduced theoretically from the equation of transfer for radiance from Preisendorfer (Citation1959),2
where α is the total attenuation coefficient and is the path function. The first term on the right gives the loss of radiance by attenuation, while the second term gives the gain of radiance by scattering into the direction of propagation from others paths (σ is the volume scattering function, θ′ and φ′ are the zenith and azimuth angles from all directions). Thus, the attenuation coefficient assumes the following format:
3
whereas in the upper layers the radiance distribution is dominated by the direct sunlight, for deeper layers the diffuse light dominates and the radiance distribution decreases with increasing depth at an exponential rate with a nearly-constant attenuation coefficient. Then, the radiance at depth z may be represented by Preisendorfer (Citation1959):4
Some instrumentation was developed to measure the underwater radiance distribution on lakes, fjords and oceans (Sasaki et al., Citation1958; Jerlov and Fukuda, Citation1960; Tyler, Citation1960; Lewis et al., Citation2011; Antoine et al., Citation2013). In this article, the authors present a new apparatus to operate in an underwater environment composed of an optical cable attached to a portable spectroradiometer. This device allows measurements in all types of waters, with the advantage of providing spectral measurements [from the visible to the near-infrared (NIR)]. The goal of the article is to perform measurements of downwelling zenith radiance in several water bodies in order to retrieve the attenuation coefficient typical of different water bodies with different water compositions.
The attenuation coefficients are relevant in the water surface layer energy budget, which is important for many applications, namely for the representation of lakes in numerical weather prediction models. In particular, results from Potes et al. (Citation2012) in Alqueva reservoir (southeast Portugal) show that the two-layer bulk lake model, FLake model (Mironov et al., Citation2010), currently coupled to some weather forecast models (see for example, Balsamo et al., Citation2012) is very sensitive to the attenuation coefficient. In particular, this coefficient is important in the computation of the water surface temperature, which is a key parameter in heat and moisture transfers between the reservoirs and the atmosphere.
The following section gives a description of the study sites, material and methods. Section 3 presents a discussion of the results obtained and Section 4 summarises the conclusions.
2. Study sites, materials and methods
2.1. Study sites
Four sites were explored in this work, one 5-m deep pool from the municipal swimming complex of Évora, representative of clean water and three different water bodies: Alqueva and Monte Novo reservoirs in southeast Portugal (a) and Thau lagoon in southeast France (b). The region of Alentejo is long known by the irregularity of its hydrological resources. Rainfall periods are irregular and the region faces periods of drought that may last more than one consecutive year. Thus, to ensure an essential water reservoir in Alentejo region, Alqueva dam was built, allowing for water storage and use, even during extensive drought periods. The Alqueva reservoir is located along 83 km of the main course of the Guadiana river and constitutes the largest artificial lake in the Iberian Peninsula (a). At the full storage level of 152 m, the reservoir has a total capacity of 4150 km3 and a surface area of 250 km2. Filling phase began in February 2002 and the reservoir is used for water storage and supply, irrigation and hydroelectric power generation. During the wet season, the water quality is controlled by inorganic contents with higher concentrations in the tributaries. In the dry season, the system is mainly controlled by the dissolved oxygen, pH and temperature (Serafim et al., Citation2006). According to Morais et al. (Citation2007), Alqueva reservoir was classified as eutrophic based on total phosphorus (>35 mg P m−3) and chlorophyll α (>5 µg L−1) concentrations.
Fig. 1 Location of (a) Alqueva and Monte Novo reservoirs and (b) Thau lagoon.
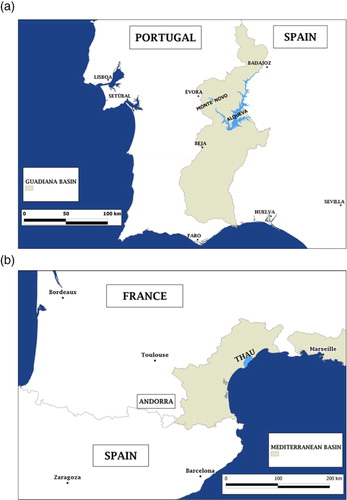
The Monte Novo reservoir is located on the main course of the Degebe River about 15 km from the city of Évora (a). It has a total capacity of 15 km3 and a surface area of 2.8 km2. Since it was finished in 1982, this reservoir supplies water to Évora, the largest city in the Alentejo region. However, it presents water quality problems due to excess nitrogen and phosphorus (Fonseca and Barriga, Citation2010).
The Thau lagoon is located near the Mediterranean Sea with a connection channel presenting salty water. It has 15 km of length and a surface area of 75 km2 (b). Due to its position as the interface between land and sea, the Thau lagoon is subject to watershed inputs that can threaten the quality of the different compartments of the ecosystem and lead to malfunctions.
The domestic waste and agricultural runoff are the two main sources of supply of nutrients (nitrogen and phosphorus) in the watershed. The annual nitrogen inputs are estimated between 198 and 300 tonnes and are mainly of agricultural origin (La Jeunesse, Citation2001). Phosphorus inputs to the lagoon are mainly of domestic origin (70%) and estimated to be between 40 and 50 tonnes per year since the 1980s. Sediment silted areas corresponding to tables of oysters culture are characterised by the maximum organic matter and total nitrogen. Regarding the water quality, nutrient inputs to the lake are highly correlated with the phases of flooding. Phosphate concentrations in the lagoon are minimal and close to concentrations of marine waters in winter and maximum in summer due to the sediment flux (Souchu et al., Citation1998).
2.2. Materials and methods
The apparatus exploited in this work is composed of a portable spectroradiometer, linked to an optical fibre bundle driven by a customised frame to protect the optical cable and to keep the tip pointing to the zenith direction in an underwater environment. The portable FieldSpec UV/VNIR Spectroradiometer from Analytical Spectral Devices Inc. (Boulder, CO) was used to record the spectral downwelling zenith radiance measured across the spectral range 325–1075 nm with a spectral resolution ranging from 1 to 3 nm for the UV and NIR spectral regions, respectively. The integration time varies from 17 ms to several minutes depending on the intensity of the incoming radiation. The optical cable was chosen to meet the optical features of the spectroradiometer. The light guide has a numerical aperture of 0.11 resulting in a field-of-view (FOV) of 22° and the core is made of quartz, aiming to carry out measurements in the UV spectral region as well. In order to maximise the signal reaching the spectrometer, the interspacing of the optical fibres in the bundle is minimised using fibres of two different diameters (0.22 and 0.11 mm). The frame was developed to guarantee the verticality and horizontality of the bare tip of the optical cable, which has to point upwards to the zenith in order to collect the downwelling zenith radiance at several levels below the water surface.
The first version of the frame was developed in 2011 and tested in the Thau lagoon in summer 2011, within the scope of THAUMEX measurement campaign. The THAUMEX experiment took place in summer 2011 with the main scientific objective to characterise simultaneously the thermal profile of the Thau lagoon, the penetration of sunlight in the water, the near-surface heat and mass fluxes and the atmospheric boundary layer. The measurements collected along with continuous observations already taken over the lagoon allow studying the coupling processes between the inland water and the atmosphere, particularly through the use and test of SURFEX, a surface modelling platform that can be coupled to atmospheric models (Salgado and Le Moigne, Citation2010).
In order to characterise the sunlight penetration in the lagoon, the tip of the optical cable was attached to a galvanised steel bar pointed to the zenith direction, which was released down in the water column, through an unprotected steel cable. Thus, the lack of protection exposed the cable to high twist angles resulting in serious damage on both tips after a couple of profiles. Nevertheless, the first profiles measured in the Thau lagoon were consistent and demonstrated the ability of the system.
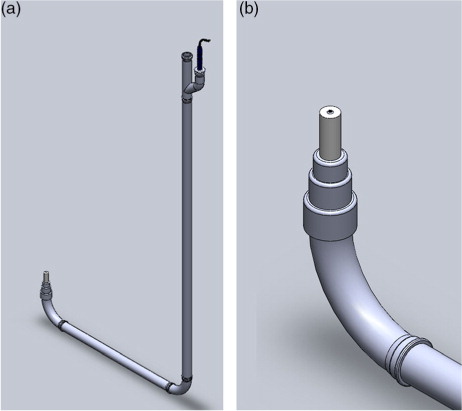
The second version of the frame was developed in 2012, to solve the problems identified in the first version, and tested in a 5-m deep pool (from the municipal swimming complex of Évora). After the test sessions, the apparatus was used to perform measurements in Alqueva and Monte Novo reservoirs in the summer of 2012. This second version resulted in a stronger frame with one Teflon polymer protecting the cable tip and three layers of polyvinyl chloride (PVC) tube protecting the cable from high twist angles with diameters of 16, 20 and 40 mm (a). Both frames were developed according to protocols (Mueller et al., Citation2003), with respect to nearby disturbances, in order to avoid ship and platform perturbations (shadows or reflections) on the radiant energy field. A distance of 85 cm was kept between the vertical section (the section handled manually up and down in the water column) and the bare tip of the optical cable (b).
Fig. 2 (a) Second version of the frame for underwater measurements of spectral downwelling zenith radiance and (b) the tip in detail.
summarises the atmospheric conditions (sun zenith angle and wind speed) and water contents in terms of turbidity and chlorophyll α, during the field campaigns. All of the campaigns were conducted under clear sky conditions. The length of the optical cable allows for measurements to a maximum depth of 3 m and the levels chosen for the profiles were: 0.01, 0.25, 0.50, 0.75, 1.00, 1.50, 2.00, 2.50 and 3.00 m. Before every profile measurement, the integration time of the spectroradiometer was optimised to ensure the best conditions of the lighting state. A dark current spectrum (which is an offset that varies with the temperature of the detector) was also taken before every profile in order to correct the signal from temperature oscillations. We chose a sample average of 10 spectra and three samples were taken per level. This choice was looking for equilibrium between a preferentially high number of spectra per level and a relative fast profile to keep similar atmospheric conditions.
Table 1. Field campaign details
In the next section, we present a discussion on the profiles of spectral downwelling zenith radiance and the corresponding spectral attenuation coefficients from the study sites described above.
3. Results and discussion
3.1. Pool measurements
The second version of the frame was tested in a 5-m deep swimming pool (). In , two profiles of downwelling zenith radiance are shown for two different sun zenith angles for the 22 June 2012 and 9 July 2012. Both cases presented low wind speed (). The pool presents clean water without suspended sediments or dissolved organic matter in all 5-m depths (). The profile of 9 July 2012 (a) was performed under a sun zenith angle of 42.9° () resulting in observations of light field composed by both solar direct and diffuse components from all directions entering in the FOV of the device. The profile of 22 June 2012 (b) was carried out under a sun zenith angle of 86.6° () ensuring that the light field is only composed of diffuse radiation.
Fig. 3 Underwater environment in a 5-m deep pool from the municipal swimming complex of Évora.
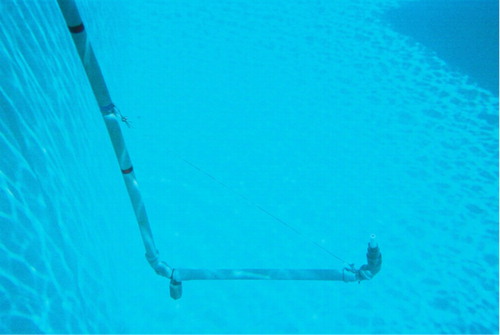
Fig. 4 Measurements of spectral downwelling zenith radiance at several levels deep in a 5-m pool with clean water for two different zenith angles: (a) 42.9° on 9 July 2012 and (b) 86.6° on 22 June 2012.
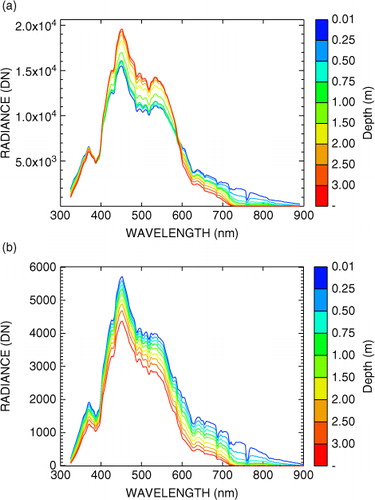
In the profile of 9 July 2012 (zenith angle of 42.9°), a peculiar behaviour is noticed between 400 and 600 nm, where the radiance increases from the subsurface (0.01 m) towards the maximum depth of 3 m, while out of this spectral range the expectable decrease of radiance was recorded. This particular intensification of radiance is associated with the direct component of the solar downwelling radiance that increases the signal through refraction on the water surface and scattering of radiation into the FOV cone. According to eq. (2), since the scattering (represented by the second term on the right) is higher than water attenuation (represented by the first term on the right), the radiance increases with depth. Out of this spectral region, the scattering of solar beam is always lower than the water attenuation leading to a decrease of radiance with depth. In the profile of 22 June 2012 (zenith angle of 86.6°), with only diffuse light, a decrease of radiance was recorded until 3 m depth for all wavelengths.
3.2. Portuguese reservoirs
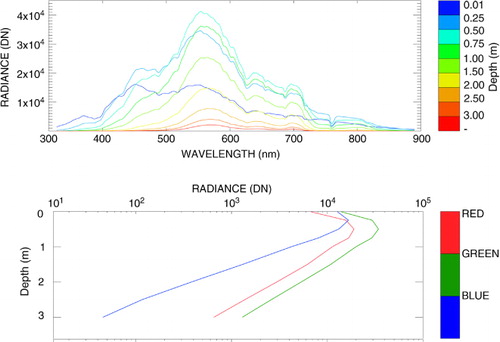
Measurements of downwelling zenith radiance were performed in Alqueva and Monte Novo reservoirs with the second version of the frame in the summer of 2012. shows a profile for Monte Novo reservoir on 12 July 2012. This case presents low sun zenith angles and high water turbidity (). In the lower panel of , the average radiance profiles for the blue (400–500 nm), green (500–600 nm) and red (600–700 nm) parts of the electromagnetic spectrum are presented. The radiance increases from the subsurface level (0.01 m) down to 0.50 and 0.25 m, in the green/red and blue part of the spectrum (see the lower panel), respectively, followed by a constant logarithmic slope downwards. Thus, two different behaviours are observed in the radiance profile for the 400–700 nm range. First, an increase of radiance up to the inflexion point (0.50 and 0.25 m) followed by a constant decrease (in the log-normal graph) afterwards is observed. Before the inflexion point, the scattering of the direct sunlight component is higher than attenuation [eq. (2)], while afterwards the attenuation overcomes the scattering. The water content in Monte Novo reservoir () presents moderately high turbidity (14.8 NTU) and the highest chlorophyll α concentration of all campaigns (50.3 µg L−1) increasing the water attenuation after the inflexion point.
Fig. 5 Measurements of spectral downwelling zenith radiance at several levels deep in Monte Novo reservoir on 12 July 2012, for a sun zenith angle of 26.6°. In the lower panel the average radiance profiles for the blue (400–500 nm), green (500–600 nm) and red (600–700 nm) parts of the spectrum.
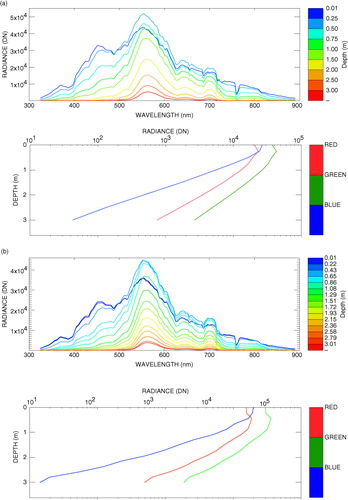
shows two profiles of downwelling zenith radiance performed at Alqueva reservoir with the second version of the frame on 31 August 2012 and 6 September 2012. Once again, in the lower panels of , the average radiance profiles for the blue (400–500 nm), green (500–600 nm) and red (600–700 nm) parts of the electromagnetic spectrum are presented. These two profiles present different wind speeds but very similar sun zenith angles and water contents (). These conditions allow studying the impact of the wind speed on the downwelling zenith radiance pattern. In both cases, an increase of radiance is visible from the subsurface level (0.01 m) down to 0.25 and 0.50 m for a wind velocity of 8.4 and 2.6 m s−1, respectively, followed by a constant decrease downwards for the green/red part of the spectrum (lower panels of ). For the remaining wavelengths, a decrease is noticed since the subsurface levels down to lower levels. According to Hieronymi and Macke (Citation2012), at growing wind speeds the maximum light fluctuations shift towards the surface, since for high wind speed cases the resulting steep capillary-gravity waves focus the light field closer to the surface than for low wind speed cases. Darecki et al. (Citation2011) present a system capable of measuring wave-induced fluctuations in the near-surface downwelling radiance and irradiance field. They show that the flashes can reach nearly 40-fold at a zenith angle of 30° at 532 nm. These flashes can only be recorded using a high sampling rate system of 1 kHz. In our case, it is impossible to record these flashes because of the lower sampling rate of the spectroradiometer used (58.8 Hz maximum) being only their effect visible in the integration time of the spectroradiometer used here.
Fig. 6 Measurements of spectral downwelling zenith radiance at several levels deep in Alqueva reservoir on (a) 31 August 2012 with a wind speed of 8.4 m s−1 and sun zenith angle of 37.8° and on (b) 6 September 2012 with a wind speed of 2.6 m s−1 and sun zenith angle of 41.5° (right panel). In the lower panels the average radiance profiles for the blue (400–500 nm), green (500–600 nm) and red (600–700 nm) parts of the spectrum.
3.3. Thau lagoon
The first version of the frame was used in Thau lagoon during the THAUMEX measurement campaigns in the summer of 2011. shows a profile of downwelling zenith radiance obtained at Thau lagoon on 21 August 2011 for a relatively high sun zenith angle and low turbidity (). The lower panel in shows the average radiance profiles for the blue (400–500 nm), green (500–600 nm) and red (600–700 nm) parts of the electromagnetic spectrum. For this case, the scattering is lower than attenuation for all of the profile [eq. (2)] resulting in a decrease of radiance with depth. A steeper decrease of radiance profile is noticed in the blue part of the spectrum compared to the green and red parts resulting in a higher attenuation coefficient in this region ().
Fig. 7 Measurement of spectral downwelling zenith radiance at several levels deep in Thau lagoon on 24 August 2011. In the lower panel the average radiance profiles for the blue (400–500 nm), green (500–600 nm) and red (600–700 nm) parts of the spectrum.
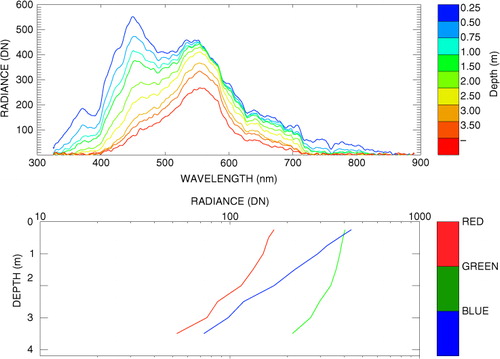
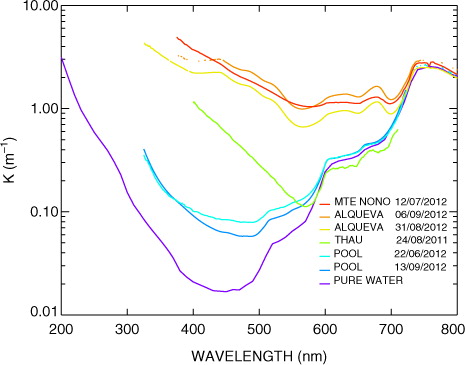
Fig. 8 Spectral attenuation coefficient for pure water obtained from Smith and Baker (Citation1981) and for five cases of the campaigns during the summers of 2011 and 2012, derived from eq. (5).
3.4. Spectral attenuation coefficient
The spectral downwelling radiance measurements collected in the sites described above were used to compute spectral attenuation coefficients of the water column (K). The coefficients were computed using the profile values from the point where the logarithmic slope becomes nearly constant. Equation (4) assumes the following format, where ζ is the point where it can be assumed that the constant negative slope starts:5
shows the plot of the spectral attenuation coefficient for pure water (obtained from Smith and Baker, Citation1981) and derived from eq. (5) for five of the campaigns carried out during the 2011 and 2012 summers. The following cases were used: 22 June 2012 and 13 September 2012 from the pool; 24 August 2011 from Thau; 12 July 2012 from Monte Novo and 31 August 2012 from Alqueva ().
As expected, the results show that the clear pool water presents the attenuation coefficient closest to pure water. Nevertheless, in the 400–500 nm range, the pool attenuation is around fourfold the pure water attenuation. The increase of water turbidity in the sites () leads to an increase of the water attenuation coefficient. For wavelengths greater than 590 nm, a similar attenuation coefficient is recorded for pure water, pool and Thau lagoon. For wavelengths greater than 710 nm, all spectra retain the same attenuation coefficient. Notice that the minimum attenuation coefficient is moving to higher wavelengths as the turbidity increases. The average attenuation coefficient for the range 400–700 nm was computed, K(θ,φ,PAR), which is frequently called photosynthetically active radiation (PAR) region. In , K(θ,φ,PAR) represents the PAR attenuation coefficient of the most significant profile obtained in the campaign, represents the average value of PAR attenuation coefficient obtained under the same conditions, σ represents the standard deviation of the attenuation coefficients for the number of profiles (N). This spectral region concentrates about half of the solar radiation, thus the radiance is able to penetrate deeper in PAR region than outside of it. Therefore, most of the water quality studies over lakes and lagoons focus on PAR region (Walmsley et al., Citation1980; Grobler et al., Citation1983; Roos and Pieterse, Citation1994; Oliver et al., Citation1999; Gallegos, Citation2001; Giblin et al., Citation2010; Potes et al., Citation2011). Over the years, several authors reported highly significant correlations between the attenuation coefficient and turbidity for water bodies in different regions as South Africa, Australia and United States (). The relationship obtained in this work is linear, similarly to four of the fits presented in . An exponential fit was also proposed with a high number of points (360) and a correlation coefficient of 0.82.
Table 2. PAR attenuation coefficients calculated using eq. (5) for the field campaigns
Table 3. Relationships between attenuation coefficient (K) and turbidity (T) for several authors and for this work
4. Conclusions
A new apparatus was developed to be coupled with a portable spectroradiometer, allowing for spectral radiation measurements in underwater environment and to obtain estimates of the light attenuation coefficient in water. It ensures spectral downwelling zenith radiance measurements with an FOV of 22°, in the range 325–1075 nm, with a moderately high spectral resolution of 1–3 nm from the visible to the NIR. From the previous section, it is clear that the underwater downwelling zenith radiance is responsive to sun zenith angle, wind speed and water content (namely turbidity and chlorophyll α concentration). It was shown that the upper water layers are more exposed to the penetration of direct zenith sunlight due to the refraction on the surface and to light scattering by water molecules and suspended solids. As explained by the equation of transfer for radiance [eq. (2) from Preisendorfer, Citation1959], whenever the attenuation by the water content is lower than scattering, the downwelling zenith radiance increases with depth. For deeper layers, the diffuse light plays a major role and the exponential decrease of radiance with depth was verified, allowing the calculation of the attenuation coefficient through the exponential law. Thus, the attenuation coefficient retrieved in this work is assumed to be the diffuse attenuation coefficient, which is a property of the medium independent of the illuminating light field (inherent optical property). The comparison of the PAR attenuation coefficient from the different field campaigns confirms that an increase in water turbidity leads to an increase in PAR attenuation coefficient. A linear relationship between attenuation coefficient and turbidity was found, which is similar to other relations reported in the literature. This coefficient is a key parameter for lake models, which is intended to be coupled to weather forecast models (Balsamo et al., Citation2012). A future aim of this work is to collect attenuation coefficient values of worldwide lakes, dams and reservoirs in order to develop a robust satellite-based algorithm to enlarge the attenuation coefficient network for the major lakes on Earth.
5. Acknowledgements
This work is financed through an FCT grant SFRH/BD/45577/2008 and through FEDER (Programa Operacional Factores de Competitividade – COMPETE) and National funding through FCT – Fundação para a Ciência e a Tecnologia in the framework of project FCOMP-01-0124-FEDER-009303 (PTDC/CTE-ATM/102142/2008). The authors acknowledge the funding provided by the Évora Geophysics Centre, Portugal, under the contract with FCT (the Portuguese Science and Technology Foundation), PEst-OE/CTE/UI0078/2011. The authors also thank Samuel Bárias for the technical drawing of the device and support in the field campaigns; Flávio Couto for support in the field campaigns; IFREMER (Institut Français de Recherche pour l'Exploitation de la mer) for providing the water turbidity values from Thau lagoon. They also thank the municipal swimming pool complex of Évora for kindly allowing access for underwater measurements.
References
- Antoine D , Morel A , Leymarie E , Houyou A , Gentili B , co-authors . Underwater radiance distributions measured with miniaturized multispectral radiance cameras. J. Atmos. Ocean. Tech. 2013; 30: 74–95.
- Balsamo G , Salgado R , Dutra E , Boussetta S , Stockdale T , co-authors . On the contribution of lakes in predicting near-surface temperature in a global weather forecasting model. Tellus. A. 2012; 64: 15829.
- Bukata R. P , Jerome J. H , Kondratyev A. S , Pozdnyakov D. V . Optical Properties and Remote Sensing of Inland and Coastal Waters. 1995; USA: Corporate Blvd., N.W., Boca Raton, Florida.
- Darecki M , Stramski D , Sokólski M . Measurements of high-frequency light fluctuations induced by the sea surface with an Underwater Porcupine Radiometer System. J. Geophys. Res. 2011; 116: C00H094.
- Fonseca R , Barriga F . Clay minerals in sediments of Portuguese reservoirs and their significance as weathering proxducts from over-eroded soils: a comparative study of the Maranhão, Monte Novo and Divor Reservoirs (South Portugal). Int. J. Earth Sci. (Geol Rundsch). 2010; 99: 1899–1916.
- Gallegos C. L . Calculating optical water quality targets to restore and protect submersed aquatic vegetation: overcoming problems in partitioning the diffuse attenuation coefficient for photosynthetically active radiation. Estuaries. 2001; 24(3): 381–397.
- Giblin S , Hoff K , Fischer J , Dukerschein T . Evaluation of Light Penetration on Navigation Pools 8 and 13 of the Upper Mississippi River. 2010; Reston, VA: U.S. Geological Survey. U.S. Geological Survey Long Term Resource Monitoring Program Technical Report 2010–T001.
- Grobler D. C , Toerien D. F , De Wet J. S . Changes in turbidity as a result of mineralization in the lower Vaal River. Water SA. 1983; 9(3): 110–116.
- Hieronymi M , Macke A . On the influence of wind and waves on underwater irradiance fluctuations. Ocean. Sci. 2012; 8: 455–471.
- Jerlov N. G , Fukuda M . Radiance distribution in the upper layers of the sea. Tellus. XII. 1960; 3: 348–355.
- La Jeunesse I . Etude intégrée dynamique du phosphore dans le système bassin versant – lagune de Thau (mer méditerranée, Hérault).
- Lewis, M. R., Wei, J., Van Dommelen, R. and Voss, K. J. 2011. Quantitative estimation of the underwater radiance distribution. J. Geophys. Res. 116, C00H06.
- Mironov, D. V., Heise, E., Kourzeneva, E., Ritter, B., Schneider, N. and co-authors. 2010. Implementation of the lake parameterisation scheme FLake into the numerical weather prediction model COSMO. Boreal Environ. Res. 15, 218–230.
- Morais M , Serafim A , Pinto P , Ilhéu A , Ruivo M , Gunkel G , Sobral M . Monitoring the water quality in Alqueva Reservoir, Guadiana River, southern Portugal. Reservoir and River Basin Management, Exchange of Experiences from Brazil, Portugal and Germany. 2007; Universitatsverlag der TU, Berlin. 96–112.
- Mueller J. L , Fargion G. S , McClain C. R . Ocean Optics Protocols for Satellite Ocean Color Sensor Validation, Revision 4, Volume III. 2003; Greenbelt: NASA Goddard Space Flight Center. NASA/TM-2003-211621/Rev4-Vol.III.
- Oliver R. L , Hart B. T , Olley J , Grace M , Rees C , co-authors . The Darling River: Algal Growth and the Cycling and Sources of Nutrients. 1999; CRS for freshwater ecology, CSIRO land and water. Murray Darling Basin Commission Project M386.
- Potes M , Costa M. J , Salgado R . Satellite remote sensing of water turbidity in Alqueva reservoir and implications on lake modeling. Hydrol. Earth Syst. Sci. 2012; 16: 1623–1633.
- Potes M , Costa M. J , Silva J. C. B , Silva A. M , Morais M . Remote sensing of water quality parameters over Alqueva reservoir in the south of Portugal. Int. J. Remote Sens. 2011; 32(12): 3373–3388.
- Preisendorfer R. W . Theoretical proof of the existence of characteristic diffuse light in natural waters. J. Mar. Res. 1959; 18: 1–9.
- Roos J. C , Pieterse J. H . Light, temperature and flow regimes of the Vaal River at Balkfontein, South Africa. Hydrobiologia. 1994; 277: 1–15.
- Salgado R , Le Moigne P . Coupling of the FLake model to the surfex externalized surface model. Boreal Environ. Res. 2010; 15: 231–244.
- Sasaki T , Watanabe S , Oshiba G , Okami N . Measurements of angular distribution of submarine daylight by means of a new instrument. J. Oceanogr. Soc. Jpn. 1958; 14(2): 47–52.
- Serafim A , Morais M , Guilherme P , Sarmento P , Ruivo M , co-authors . Spatial and temporal heterogeneity in the Alqueva reservoir, Guadiana river, Portugal. Limnetica. 2006; 25: 771–786.
- Smith R. C , Baker K. S . Optical properties of the clearest natural waters (200–800 nm). Appl. Optic. 1981; 20: 177–184.
- Souchu P , Gasc A , Collos Y . Biogeochemical aspects of bottom anoxia in a Mediterranean lagoon (Thau, France). Mar. Ecol. Prog. 1998; 164: 135–146.
- Tyler J. R . Radiance distribution as a function of depth in an underwater environment. Bull. Scripps Inst. Oceanogr. 1960; 7: 363–411.
- Walmsley R. D , Butty M , Van Der Piepen H , Grobler D. C . Light penetration and the interrelationships between optical parameters in a turbid subtropical impoundment. Hydrobiologia. 1980; 70: 145–157.
- Wozniak B , Dera J , Ficek D , Majchrowski R , Ostrowska M , co-authors . Modelling light and photosynthesis in the marine environment. Oceanologia. 2003; 45: 171–245.