
Abstract
The origin and persistence of high ice supersaturation is still not well understood. In this study, the impact of local dynamics as source for ice supersaturation inside cirrus clouds is investigated. Nucleation and growth of ice crystals inside potentially unstable layers in the tropopause region might lead to shallow convection inside (layered) cirrus clouds due to latent heat release. The intrinsic updraught inside convective cells constitutes a dominant but transient source for ice supersaturation. A realistic case of shallow cirrus convection is investigated using radiosonde data, meteorological analyses and large-eddy simulations of cirrus clouds. The simulations corroborate the existence of ice supersaturation inside cirrus clouds as a transient phenomenon. Ice supersaturation is frequent, but determined by the life cycle of convective cells in shallow cirrus convection. Cirrus clouds driven by shallow cirrus convection are mostly not in thermodynamic equilibrium; they are usually in a subsaturated or supersaturated state.
1. Introduction
Pure ice clouds, so-called cirrus clouds, in the tropopause region are still not well understood. Their net radiative impact on Earth's energy budget is uncertain; a net warming is often assumed (Chen et al., Citation2000) but not confirmed yet. Microphysical properties of cirrus clouds might lead to transitions between net cooling and warming (see e.g. Zhang et al., Citation1999; Fusina et al., Citation2007). Macrophysical cloud inhomogeneities additionally influence radiative transfer inside cirrus clouds. Beneath the uncertain radiative impact of cirrus clouds, their internal structure is also quite unknown and bears some unknown issues (Peter et al., Citation2006). During the last years, many in situ measurements (airborne or from balloon records) show high ice supersaturation inside cirrus clouds, that is, values of supersaturation ratio S i ≥1.2 (see, e.g. Krämer et al., Citation2009). Since ice formation takes place far away from thermodynamic equilibrium (i.e. at supersaturations S i ≥1.2, see, e.g., Koop et al., Citation2000; DeMott et al., Citation2003) cloud-free air masses can exist in the state of ice supersaturation for quite a long time. Many measurements in the tropopause region indicate these so-called ice-supersaturated regions (ISSRs, see, e.g. Gierens et al., Citation1999), which can reach quite large horizontal extensions from hundreds to thousands of kilometres (Gierens and Spichtinger, Citation2000). Ice supersaturation in clear air was found in many measurement campaigns using a variety of different measurement techniques (Jensen et al., Citation1998; Ovarlez et al., Citation2000; Vay et al., Citation2000; Haag et al., Citation2003; Krämer et al., Citation2009) as well as in satellite observations (Spichtinger et al., Citation2003b; Gierens et al., Citation2004; Gettelman et al., Citation2006). The frequency of occurrence of ice supersaturation inside cirrus clouds seems to be very high, since many measurement points can be found far from saturation (see, e.g. in Krämer et al., Citation2009). Thus, one tend to think that (high) ice supersaturation might also persist for a long time (see discussion in Peter et al., Citation2006). Persistent high ice supersaturation inside (thick) cirrus clouds seems to be in contrast to our current understanding.Footnote Ice crystals should act as strong sink for ice supersaturation, and without any additional forcing the cloud should relax to thermodynamic equilibrium (i.e. saturation) quite fast due to diffusional growth. For explaining the issue of high and (probably) persistent ice supersaturation inside cirrus clouds, many different mechanisms were proposed. Here, we summarise some of the most probable effects.
It is quite difficult to measure water vapour at low temperatures with high precision. Recent inter-comparisons of state-of-the-art in situ measurement techniques indicated errors in the range up to about 10% in the temperature regime with T>193 K; in the low temperature range (T<193 K), higher relative errors and also systematical biases can occur (see comparison in Fahey et al., Citation2014).
Pure water does not exist at temperatures T<233 K. However, for calculating water activity as a key quantity for nucleation rates (Koop et al., Citation2000) or for converting standard meteorological measurements (reported in relative humidity over liquid water), the saturation vapour pressure over liquid water is necessary. As Murphy and Koop (Citation2005) have pointed out in their review, many saturation pressure extrapolations have large errors. Even by using thermodynamical constrains for best estimates, relative errors in the range up to 10% might occur. Saturation vapour pressure over solid ice is much better constrained by measurements, and variations between different formulae are in the range of 2%.
Cubic ice as meta stable phase was assumed in lab and field measurements (Murphy, Citation2003; Murray et al., Citation2005; Shilling et al., Citation2006; Murray, Citation2008b). Since its saturation water vapour pressure is higher than the saturation pressure over hexagonal ice, hexagonal ice crystals will grow on the expense of cubic ice crystals. The transformation timescale (cubic → hexagonal ice) increases with decreasing temperature. At low temperatures, high ice supersaturation might arise from the dominance of cubic ice particles, which are actually in thermodynamic equilibrium with gas phase.
The mass accommodation coefficient for water vapour uptake of ice crystals is still uncertain. Measurements show a large variability in the range 0.004≤α≤1.06 (see Skrotzki et al., Citation2013, for a recent review). Very small values (α≪0.1) would lead to weaker diffusional growth and in turn to slower relaxation of humidity to thermodynamic equilibrium. On the other hand, strongly reduced growth would lead to tremendously high ice crystal number concentrations some orders of magnitude higher than observed (see, e.g. Kay and Wood, Citation2008).
Laboratory experiments show inhibition of homogeneous nucleation in aqueous solution droplets contaminated with a high amount of organic substances due to a size reduction (Kärcher and Koop, Citation2005). This effect could lead to reduction in ice crystal number concentrations and in turn to high ice supersaturation inside cirrus clouds due to reduced diffusional growth.
Laboratory experiments show transition to glassy states for several organic compounds (Murray, Citation2008a; Zobrist et al., Citation2008; Murray et al., Citation2010; Koop et al., Citation2011). Thus, homogeneous nucleation could be inhibited and higher ice supersaturation could occur.
Coating of solution droplets might also inhibit ice formation, thus leading to high ice supersaturation. Also, this feature was found in laboratory experiments (Bogdan and Molina, Citation2009).
Most of these suggested explanations are based on special and complex microphysical effects found in laboratory experiments. There is only slight evidence from in situ measurements on the representativity of these effects in real atmosphere. For instance, it is not clear how many organic compounds occur in the upper troposphere, if they are the ‘right’ ones and if their concentration is high enough for inhibiting ice formation. Almost all aerosol particles must be contaminated in order to suppress homogeneous nucleation (see discussion in Kärcher and Koop, Citation2005). Most of the listed effects are just important for the low temperature regime (T<200 K). However, in the warm regime (200≤T≤235 K) high ice supersaturation inside cirrus clouds occurs as well (Krämer et al., Citation2009). In most discussions, the impact of local dynamics is missing, but dynamics play a crucial role as can be seen clearly in relative humidity rates in a simple parcel approach. Relative humidity over ice is defined as follows1
with pressure p, temperature T, specific humidity or water vapour mixing ratio q, saturation pressure over ice p
ice
(T) and ratio of molar masses of water vapour and air , respectively. The total derivative of relative humidity over ice can be determined as follows:
2
3
Here, L
s
denotes latent heat of sublimation, c
p
is the specific heat capacity of dry air, R,R
v
are specific ideal gas constants for dry air and water vapour, respectively, with and g denotes gravity acceleration of Earth. Equation (3) is derived in the Appendix. We assume adiabatic processes, that is, no heat exchange with ambient air is possible; thus, vertical motions lead to expansion or compression and in turn to temperature changes of air. Equation (3) can be separated into a part driven by vertical motions (i.e. dynamics), a part governed by diffusional growth of existing ice crystals (
) and a part driven by mixing. For upward motions, the first term constitutes a source for supersaturation whereas in cloudy air ice mass acts as a sink for ice supersaturation (second term). If we only consider (constant) cooling and diffusional growth, neglecting all other processes, the system will relax to a quasi-equilibrium state at S
i
>1 (Korolev and Mazin, Citation2003).
The majority of measurements inside cirrus clouds indicates that these clouds are not in thermodynamic equilibrium (i.e. saturation) or even in a quasi-steady state; the internal variability of (bulk) microphysical properties (ice crystal number concentrations, ice water content) and of thermodynamic properties (temperature, pressure) is very high, leading to a ‘patchiness’ of cirrus clouds (see, e.g. Lee et al., Citation2004; Krämer et al., Citation2009). One main reason for this behaviour is the dynamic nature of the atmosphere.
Cirrus clouds are part of a multi-scale system characterised by a superposition of many different motions on different scales. The main driver for stratiform cirrus clouds in mid-latitudes is probably synoptic-scale dynamics, which triggers slow upward motions (e.g. Spichtinger et al., Citation2005a). Mesoscale dynamics (e.g. gravity waves) can be superimposed on large-scale dynamics. Important sources for tropospheric gravity waves are topography (Smith, Citation1979; Jensen et al., Citation1998; Joos et al., Citation2008, Citation2009), convection (Bretherton and Smolarkiewicz, Citation1989; Lane et al., Citation2001), baroclinic instabilities and frontal activities (Lane et al., Citation2004; Plougonven et al., Citation2005), geostrophic adjustment (Plougonven et al., Citation2003; Spichtinger et al., Citation2005b), spontaneous imbalance (O'Sullivan and Dunkerton, Citation1995) and wind shear (Rosenthal and Lindzen, Citation1983; Lott et al., Citation1992), respectively. Small-scale motions as turbulence could be additionally superimposed on large-scale and mesoscale dynamics. Turbulence is strongly connected to wave activity and breaking waves (McIntyre, Citation2008).
Partly, the impact of mesoscale dynamics in terms of ‘temperature fluctuations’ (see, e.g. Gary, Citation2006) was investigated by using Lagrangian box models (e.g. Haag and Kärcher, Citation2004; Hoyle et al., Citation2005; Kay et al., Citation2006, Citation2007; Gensch et al., Citation2008; Brabec et al., Citation2013; Cirisan et al., Citation2013) or single column models (e.g. Comstock et al., Citation2008; Cirisan et al., Citation2014), respectively. However, the question arises if such investigations are biased because variations are prescribed in a very rigorous way. Cloud processes have to react on the temperature changes without any possibility to rearrange the vertical updraughts spatially. Additional horizontal dimensions will change cloud evolution crucially. Spichtinger and Gierens (Citation2009a, Citation2009b, Citation2009c) could show that even weak small-scale dynamics can influence the formation and evolution of cirrus clouds in both directions. The amount of ice crystals produced in homogeneous freezing events might be enhanced by larger vertical velocities. Horizontally spread ice crystals could quench nucleation events. An important feature for these different effects is an organisation of temperature variations in interactions with environmental wind fields (see and in Spichtinger and Gierens, Citation2009b).
However, sources of these motions and their interactions with cirrus clouds in more than one spatial direction were only marginally investigated. The classical view of cloud dynamics with convective cell formation due to latent heat release (e.g. Houze, Citation1993; Lin, Citation2008) is generally missing, although there are some investigations into this directions (e.g. Marsham and Dobbie, Citation2005).
In this study, we focus on shallow convection in ice-supersaturated layers and cirrus clouds as a source for ice supersaturation inside cirrus clouds. The study follows the classical composition: In the next section, the model for investigating cirrus clouds and their interaction with mesoscale dynamics is described briefly. In Section 3, a real case of a potential unstable layer in the upper troposphere is presented; we show results from simulations corroborating ice supersaturation inside (thick) cirrus clouds. In Section 4, some additional effects possibly affecting the results are discussed. Finally, in Section 5 general findings are summarised and an outlook to further applications of this kind of investigations is given.
2. Model description
In the following, the cirrus cloud model is described briefly. For a detailed description of the dynamical model we refer to Smolarkiewicz and Margolin (Citation1997) or Prusa et al. (Citation2008); for a detailed description of the ice microphysics we refer to Spichtinger and Gierens (Citation2009a).
The anelastic, non-hydrostatic model Eulag (Prusa et al., Citation2008) is used in this study. For representing ice clouds, a two-moment bulk microphysics scheme is used as described by Spichtinger and Gierens, Citation2009a. This model version (Eulag+ice microphysics) was already used for investigations of the impact of dynamics and aerosols on the formation and evolution of cirrus clouds (Joos et al., Citation2009, Citation2014; Spichtinger and Gierens, Citation2009b, Citation2009c; Fusina and Spichtinger, Citation2010). The scheme includes the following processes: Ice crystal nucleation (homogeneous/heterogeneous), diffusional growth/sublimation and sedimentation. Arbitrary many classes of ice can be treated, discriminated by their formation mechanism (e.g. homogeneous freezing of aqueous solution droplets or heterogeneous nucleation on different aerosol types, see, e.g., Spichtinger and Gierens, Citation2009b, Citation2009c; Spichtinger and Cziczo, Citation2010). An ice class is represented by four variables, that is, ice crystal mass concentration, ice crystal number concentration, background aerosol mass concentration and background aerosol number concentration, respectively. The ice crystal mass is distributed according to a lognormal distribution with variable modal mass but fixed width (i.e. geometric standard deviation σ m =2.85). The background aerosol is connected to ice crystal nucleation in a one-to-one way, that is, washout of aerosols and release after crystal sublimation is possible. In this study, mostly one class of ice is used, representing homogeneous freezing of aqueous solution droplets. We assume that this mechanism constitutes the dominant nucleation process in the upper troposphere (e.g. Kärcher and Ström, Citation2003). Nucleation rates are parameterised according to Koop et al. (Citation2000), using water activity and temperature as key variables. Sulphuric acid is used as background aerosol; the ‘dry’ acid droplets are log-normally distributed with a modal radius of r d =25 nm and a geometric standard deviation of σ r =1.4. These parameters are used according to the findings in Spichtinger and Gierens (Citation2009a). The total background concentration of sulphuric acid droplets is n a =300 cm−3, as thought to be a typical value for upper tropospheric conditions (Minikin et al., Citation2003). Heterogeneous nucleation might modulate homogeneous nucleation, but in mid-latitudes ice nuclei (IN) concentrations are usually quite low, leading to small changes. For sensitivity studies (see discussion in Section 4) heterogeneous nucleation was used. We use a second ice class; heterogeneous ice formation was parameterised by a threshold condition. If RHi surpasses a threshold RHi het,thres =130%, all available IN (i.e. aerosol particles of the assigned ice class) are transformed to ice crystals. We prescribe a number concentration N IN =10L−1 (DeMott et al., Citation2003), typical for extra-tropical upper tropospheric conditions. Aggregation of ice crystals is not included in the scheme. For low temperature (T<235 K) it is assumed that this process is quite negligible (Kajikawa and Heymsfield, Citation1989).
3. Case study
A real meteorological case with a potentially unstable layer in the tropopause region is presented here. For this purpose we use high resolution radiosonde data (Spichtinger et al., Citation2003a) and meteorological analyses from the European Centre for Medium-Range Weather Forecasts (ECMWF). Ice supersaturation in the upper troposphere was measured in a routine radiosonde ascent at 06 UTC on 16 September 2000, over the Richard-Assmann-Observatory, Lindenberg, Germany.
3.1. Meteorological situation and measurements
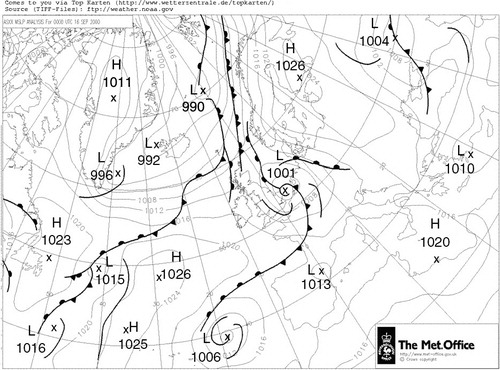
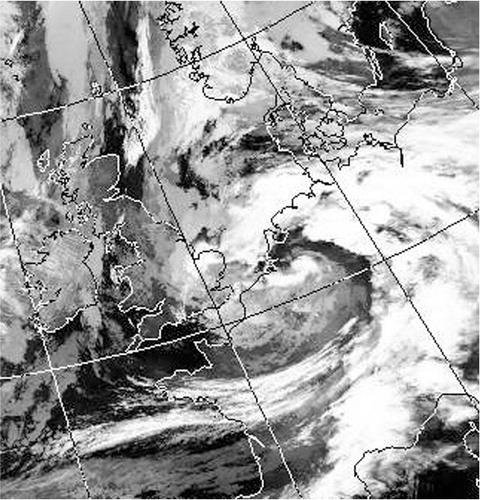
The meteorological situation over Central Europe is dominated by a small low pressure system (central pressure minimum p~1001 hPa over the Netherlands at 00UTC). Actually, a weak warm front extends from southern Denmark to about Czech Republic (see ). Lagrangian trajectory are calculated for investigations of large-scale motions in the upper troposphere. We use the Lagrangian Analysis Tool (LAGRANTO, see Wernli and Davies, Citation1997) driven by wind fields of the operational meteorological analyses obtained from ECMWF. The data are available on a horizontal Gaussian grid with increments of 0.25°, and 60 vertical levels with a typical vertical resolution of about Δp~30 hPa in the upper troposphere. The ‘starting’ region for backward trajectory calculations is an upper tropospheric region centred around Lindenberg (coordinates: 14.12°E/52.20°N): 13≤longitute≤15°E, 51.5≤latitude≤52.5°N, 225≤p≤350 hPa.
Fig. 1 Meteorological situation at 00 UTC, 16 September 2000 from Bracknell UK MetOffice Analysis for surface pressure including fronts. This analysis was kindly provided by UK Met Office under open Government Licence (see also http://www.nationalarchives.gov.uk/doc/open-government-licence/).
The flow is represented by the time evolution of air parcels along the trajectories as given in (vertical coordinate is pressure). The time interval for the backward calculations is 42 h. The large-scale flow is driven by the small low pressure system. At least during the last 12 h before the trajectories reach target region around Lindenberg the flow direction on different vertical model levels is almost identical; thus, the set of trajectories represents more a layer than single parcels. This can be seen clearly in the time evolution of temperature and pressure along the trajectories (). Indeed, the whole layer is lifted moderately during this time from 250≤p≤400 hPa at −12 h (≡15 September 2000, 18 UTC) to 225≤p≤325 hPa at 0 h (≡16 September 2000, 06 UTC); the upward motion is quite homogeneous and can be estimated within the range 0.00≤w≤0.06 m s−1 with a median of about med(w)~0.03 m s−1.
Fig. 2 Backward trajectory calculations with LAGRANTO (for 42 h). The colour indicate altitude in pressure coordinates. Note, that the air masses are quite collocated in the vertical direction after passing about longitude λ≈0°, which corresponds roughly to a time of t=12–14 h relative to the starting point. The upward motion during the last 6 h correspond to a median value of med(w)~0.03 m s−1.
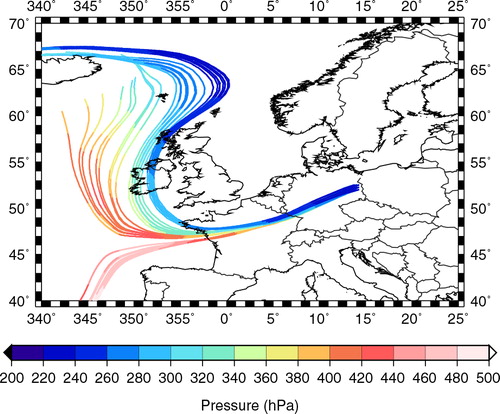
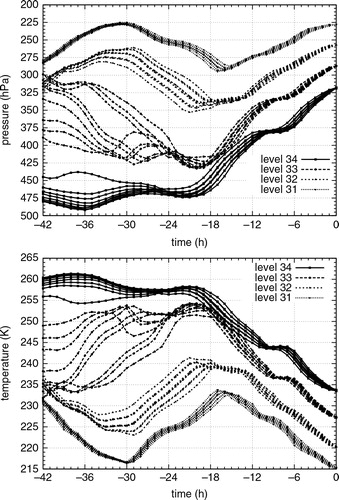
Fig. 3 Backward trajectory calculations for investigating the air streams, started at t=0 h (corresponding to 06 UTC, 16 September 2000) at ECMWF model levels 31–34. On the top panel, the altitude in pressure coordinates is shown, whereas on the bottom panel the temperature evolution is displayed.
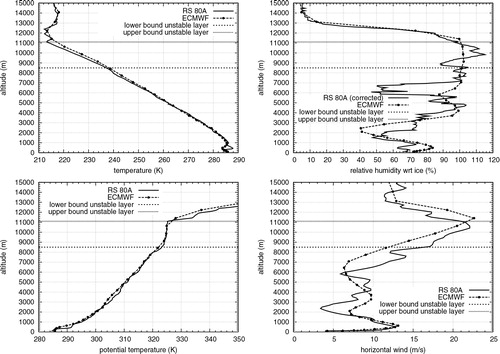
From a routine radiosonde ascent at 06 UTC, started at Richard-Assmann-Observatory Lindenberg we obtain corrected humidity data (Spichtinger et al., Citation2003a; Leiterer et al., Citation2005). Additionally, we use a ‘pseudo radiosonde’ ascent, that is, a vertical column from ECMWF analysis for the grid point nearest to the radiosonde's position in the upper troposphere. The drift of the radiosonde in altitudes 8≤z≤12 km is in the range 10–21.5 km because of weak horizontal winds; therefore the grid point 14.25°E/52.25°N is chosen for the pseudo radio soundings. In , vertical profiles of temperature, relative humidity over ice, potential temperature and horizontal wind speed, respectively, are shown. In the upper troposphere (9000≤z≤11,000 m) high ice supersaturation could be found in the radiosonde data. Even the corrected radiosonde cannot represent values of RHi>140%; thus, a dry bias is still possible (Leiterer et al., Citation2005). ECMWF analyses also indicate slight ice supersaturation in this altitude range, but the vertical structure is not well captured. The temperature profiles agree quite well (, left panel).
Fig. 4 Vertical profiles of temperature, relative humidity over ice, potential temperature and horizontal wind, respectively, from high-resolution radiosonde data (Δz~50 m) and ECMWF operational analyses are shown. Additionally, the upper and lower boundary of the potentially unstable layer are indicated in the profiles, as derived from equivalent potential temperature.
We investigate the thermal stability inside the supersaturated layer. The potential temperature profile is weakly stable (Brunt–Vaisala frequency N<0.007 s−1) with two embedded thin unstable layers (N
2~−5·10−5 s−2). For including the effect of water vapour and ice, we use an adapted version of equivalent potential temperature for phase transitions ice-vapour, which is (nearly) conserved for adiabatic processes including phase changes in the low temperature regime (T<235 K):4
For investigating potential instabilities, we adopt the classical definition from cloud dynamics as given for the standard equivalent potential temperature (e.g. Lin, Citation2008):5
Potential stability characterises stability for lifting of whole layers in contrast to static and conditional stability, which always refers to a single parcel. Our trajectory calculations indicate a layer lifting; thus, the use of equivalent potential temperature gradient as indication of potential instability is justified. A potentially neutral or even slightly unstable layer is found in the altitude range 8500≤z≤11,100 m (, right panel), almost coincident with the ice-supersaturated layer. The potentially unstable layer can also be estimated from the ascent velocity dz/dt of the radiosonde. The mean vertical velocity averaged over the whole ascent is about <dz/dt>≈5.15 m s−1. The deviation from the mean value is given by w′=dz/dt−<dz/dt>. w′ shows considerably higher values in the altitude range 8500≤z≤11,100 m with very pronounced minima at the boundaries (). Thus, both potential temperature and the ‘derived’ vertical velocity show the existence of an unstable layer. ECMWF data also represent the potentially unstable layer, although its vertical extension is smaller (altitude range ~9500≤z≤10,600 m), probably due to coarse data resolution. Ice water content values IWC>0 from ECMWF analysis data indicate a cirrus cloud in the altitude range of the ice-supersaturated layer. From satellite images (see ) the occurrence of a thick cirrus cloud over Central Europe can be confirmed.
Fig. 5 Determination of unstable layer using ‘vertical velocity’ as derived from radiosonde data and equivalent potential temperature. On the left panel the vertical velocity perturbation relative to the mean value for radiosonde ascent (<w>=5.15 m s−1) is shown. The middle panel represents a zoom of the left panel into the interesting altitude range of 7≤z≤12 km. For comparison, the equivalent potential temperature profiles (radiosonde/ECMWF) are shown in the right panel.
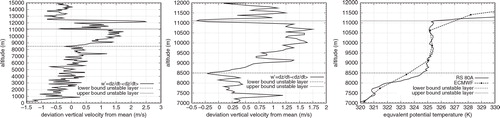
Fig. 6 AVHRR image (channel 5: λ=11.5–12.5µ m) at 05:31 UTC, September 16, 2000, showing thick cirrus clouds over Germany. This satellite image was kindly provided by NERC Satellite Receiving Station, Dundee University, Scotland (http://www.sat.dundee.ac.uk/).
In summary, there are some indications for a (thick) cirrus cloud and ice supersaturation within a potentially unstable layer. In the next section, the formation and evolution of a cirrus cloud under these special conditions will be investigated using the cirrus cloud model as described in Section 2.
3.2. Setup for simulations
We run model simulations for interpretation of measurements and analysis data in the following setup. We use a 2D domain (x–z–plane) in the middle and upper troposphere with a horizontal extension of L x =51.1 km (horizontal resolution Δx=100 m) and a vertical altitude range of 4≤z≤14 km (vertical resolution Δz=50 m). The total simulation time is set to t tot =400 min with a dynamical time step of Δt=1 s and an optional microphysical time step of Δt mp =0.1 s (in case of homogeneous nucleation and/or fast ice crystal growth, see Spichtinger and Gierens, Citation2009a, for details). The output data is written with a time increment of 5 min. The whole 2D domain is constantly lifted by a constant large-scale updraught of w LS =0.03 m s−1 consistent with trajectory calculations. and show the initial vertical profiles for the model. They are chosen to match the real profiles as good as possible after some simulation time. Thus, the initial profiles do not necessarily represent the observations at 16 September 2000, 06 UTC. In order to obtain a better agreement with the measurements in course of the simulation, the initial profiles were shifted downwards by Δz=360 m, such that they match the measurements at t~190–210 min.
Fig. 7 Initial profiles of temperature, relative humidity over ice and horizontal wind, respectively, for realistic simulations with the EULAG model.
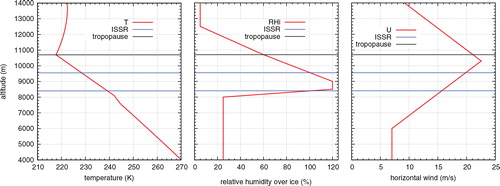
Fig. 8 Initial profiles of potential and equivalent potential temperature for realistic simulations with the EULAG model. Top: Whole vertical profile, bottom: Zoom into potentially unstable layer.
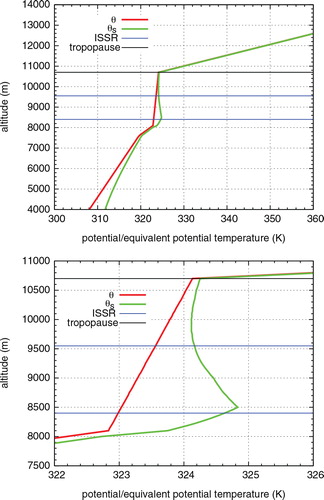
An ice-supersaturated layer is prescribed in the altitude range 8.4≤z≤9.55 km. While the (dry) potential temperature indicates stable stratification for the upper troposphere, the addition of moisture in the ice-supersaturated layer leads to a potentially unstable layer in the altitude range 8.5≤z≤10 km. The potential temperature field is superimposed by a Gaussian noise with a standard deviation of σ θ =0.05 K. These initial perturbations lead in turn to initial variations in vertical velocity. As described in the next section, these initial perturbations organise themselves and remain persistent with slightly decreasing amplitude due to dissipation.
3.3. Results
We investigate the convective cell formation and evolution, the microphysical and dynamical properties of the cells and the humidity fields inside the cells. This leads us to the main issue, namely high supersaturation inside thick cirrus clouds. As stated in the introduction, clear definitions on ‘high supersaturation’ and ‘thick clouds’ are usually missing in the discussion of ice supersaturation inside cirrus. For our analysis, we will use the following, more precise definitions:
High supersaturation is equivalent to values S i ≥12, very high supersaturation is equivalent to values S i ≥1.4. This definition is motivated by typical thresholds for ice nucleation (Koop et al., Citation2000; DeMott et al., Citation2003). For cloudy data points we will use the following definitions:
Thick cirrus cloud is equivalent to values of ice water content IWC≥10 mg m−3, very thick cirrus cloud is equivalent to values of ice water content IWC≥30 mg m−3. These values are estimated using mean temperature K and pressure
hPa, respectively, for the corresponding saturation mixing ratio
. This quantity can be seen as reservoir for clouds, as in former studies (e.g. Klein and Majda, Citation2006), that is, we set q
c
=f·q
s
with f~0.1 or f~0.33 for thick or very thick cirrus clouds, respectively.
3.3.1. 2D structure of the formed cirrus clouds.
and show the time evolution of cloud formation and development of convective cells. The entire 2D domain is lifted by a constant updraught of w
LS
=0.03 m s−1 and relative humidity over ice increases in reaction on this large-scale motion. The initially perturbed potential temperature field organise to larger structures under the influence of the moderate wind shear (). Small eddies form, leading to structured upward and downward motions. This organisation of an originally randomly disturbed temperature field into larger structures was already seen for simulations in a more stable environment (Spichtinger and Gierens, Citation2009b). The detailed formation mechanism of these structures remains unclear; wind shear might play a major role by generating vorticity in the x–z–plane. The eddies have a horizontal extension of few km and a vertical extension of ~0.5–1 km as estimated from the turbulent kinetic energy field (not shown). The induced vertical velocity is quite small (−0.08≤w′≤0.08 m s−1, with w′=w–w
LS
) in the initial phase (t≤80 min). The additional temperature changes driven by small-scale eddies lead to an increase in relative humidity over ice and to a fairly inhomogeneous but structured 2D distribution of RHi. In some small regions the thresholds for homogeneous nucleation are surpassed; ice crystals are formed in the lower part of the ice-supersaturated layer at around t~55 min and later. Because ice formation is triggered first in the lower part of the ice-supersaturated region (8.5≤z≤9 km) at quite high temperatures (230≤T≤236 K), only few ice crystals are formed in these regions (N
i
~10 L
−1). Although these ice crystals can grow without competition in a highly supersaturated environment, it takes some time until considerable latent heat is released. The addition of latent heat contributes to a further enhancement of the existing eddies; cells containing ice crystals are formed. At t~105 min (see ) more than 10 convective cells can be seen, visualised by their ice water content (black isolines). In the following, the cells grow in vertical direction due to latent heat release, reaching higher levels of the ice-supersaturated layer. Horizontal wind shear has an impact on the shape of the developing cells. In the lower part of the domain (i.e. 8≤z≤10 km), the wind is increasing with height, tilting convective cells to the right. As soon as the cells reach levels around z~10 km (maximum wind, change of wind shear), they tend to rise almost directly upwards. After reaching the negatively sheared region above wind maximum the cells are pushed to the left, inducing overturning of the cells. The rising convective cells are stopped at the tropopause. The buoyancy of the cells is not sufficient that they can penetrate into the highly stratified stratosphere. Since the vertical extension of the layer with convective activity is quite shallow, we call the phenomenon shallow cirrus convection in analogy to shallow convection in liquid clouds. The main convective activity takes place in the time interval 120≤t≤240 min. However, also at later stage of the simulations few convective cells are triggered, leading to some inhomogeneities in a quite mixed layer cloud. We will see later that the convective activity is not strong enough to produce a well-mixed layer, thus potentially unstable regions can exist over the whole simulation time.
Fig. 9 Time evolution of convective cells inside the ISSR in the x-z-plane (horizontal extension in kilometres vs. altitude in kilometres) – early stage of cirrus cloud (t=75, 90, 105, 120, 135, 150, 165, 180, 195, 210 min). Colour bar: relative humidity over ice, black lines: isolines of ice water content (increment: ΔIWC=5 mg m−3).
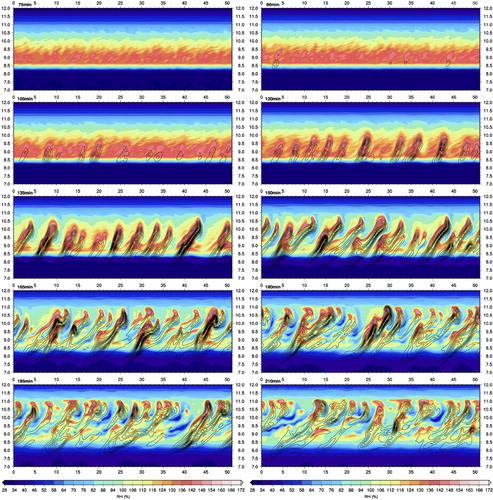
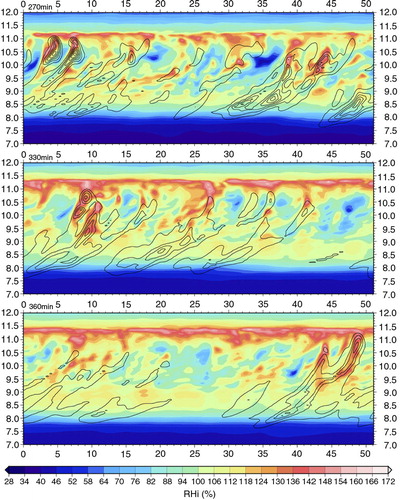
Fig. 10 Time evolution of convective cells and the layer cloud in the x-z-plane (horizontal extension in kilometres vs. altitude in kilometres) at a later stage (t=270/330/360 min). Colour bar: relative humidity over ice, black lines: isolines of ice water content (increment: ΔIWC=5 mg m−3).
The cloud structure of the formed cloud is determined by the general behaviour of the convective cells. Ice crystals inside the cells are lifted by cell's updraught until they grow to large sizes such that their terminal velocities are larger than vertical updraughts. Sedimenting ice crystals form the typical fall streaks, reaching from the top of the convective cells over the whole range of the supersaturated layer far down into the subsaturated layer below.
3.3.2. Dynamical vs. microphysical aspects of convective cells.
The dynamic mechanism of cell formation and evolution for shallow cirrus convection is almost identical to classical cloud dynamics of liquid clouds. The existing condensate (water or ice) acts as sink for supersaturated water vapour. The vapour condenses on the stable phase (liquid or solid) and latent heat is released. Thus, in a potentially unstable environment the temperature inside cloud elements is higher than in the cloud free environment. This difference produces an intrinsic updraught region inside the cloud. The changed velocity field leads also to a cell formation, that is, structures larger than the initial cloud element are formed.
In contrast to condensation of liquid cloud droplets, ice formation requires high supersaturations (Koop et al., Citation2000; DeMott et al., Citation2003); this leads to some special features in the cell formation and evolution. We discuss some aspects of the evolution of a single cell in more details in the following. For determining the dominant processes, we also investigate timescales for (a) changing relative humidity and (b) changing ice mass concentration q
c, that is,6
7
The timescales are defined in the Appendix. For the analysis of the different processes we use ratios of the absolute values of timescales . The interpretation is quite straightforward. A timescale ratio
indicate a dominant process r≈1⇔| τ
1|≈|τ
2| indicates that both processes are of comparable strength; finally, for
process 1 is dominant. This type of analysis is also represented in and .
There are different stages of a typical cell in ice-supersaturated air, summarised as follows:
The large-scale updraughts in combination with small-scale eddies induce first nucleation events. Since the nucleation takes place at (1) low vertical velocities (w≤0.02–0.05 m s−1) and (2) high temperatures (i.e. at the lower boundary of the supersaturated layer), just few ice crystals are produced (N i ~10–20 L−1). These crystals can grow to large sizes in the highly supersaturated environment and in the further evolution they sediment. Because of small surface area of ice crystals, the consumption of water vapour is quite ineffective; the latent heat release leads to small additional values of vertical velocity. Secondary nucleation events follows in the enhanced vertical velocity, leading to higher ice crystal number concentrations. Falling ice particles form the first fall streaks, removing ice mass from the nucleation zone.
The cell starts to organise due to changes in the velocity field; a confined updraught region is formed with vertical velocity increasing in time. The ice crystals inside the cell grow further, consuming ice supersaturation. On the other hand, rising of the cells and thus adiabatic cooling leads to a source of ice supersaturation. Timescale analysis (see below) shows that cooling is almost always dominant over growth and/or mixing. High supersaturation values are found inside the cells.
Sedimentation forms fall streaks, extending from the top of the cells down to the lower boundary of the supersaturated layer and far beyond into subsaturated air. This is a very clear macroscopic signature of the convective cells.
The cell rises until level of neutral buoyancy is reached. The cell is then overturning and sinks downwards; it disappears and the ice crystals sediment and evaporate in the subsaturated air.
An example of single cell evolution in its developing stage is shown in . Here, the cell is tracked and displayed with a time increment of Δt=10 min; the variables potential temperature perturbation, vertical velocity, relative humidity over ice, ice crystal mass and number concentration, respectively, are shown. On the left panels, the 2D structure of the cell is shown; on the right panel, vertical profiles as given at the centre of the cell are shown. Two important features can be seen:
Inside the cells no further ice nucleation takes place (‘quenching’ of nucleation), that is, at the maximum updraught values, diffusional growth is always large enough to keep supersaturation values below homogeneous freezing thresholds. On top of the cells, nucleation events are triggered, that is, at lower vertical velocities.
The updraughts triggered by latent heat release also change the velocity fields. Inside the cell upward motion can be found, whereas laterally downdraughts are induced. Thus, relative humidity is reduced in the ambient air due to adiabatic compression in the downdraughts. Again, the ‘cooling’ timescale is smaller than the ‘growth’ timescale. This means that relative humidity is faster reduced by warming than it is enhanced by sublimating ice crystals.
High supersaturation inside cells is triggered by dominance of cooling as source for supersaturation and the ability of ice crystals inside the cells to reduce the ice supersaturation below homogeneous ice nucleation thresholds. Thus, vertical velocity provides high supersaturation but growth prevents ice nucleation leading to ice supersaturation on high levels. In principle, this feature is similar to modification or even suppression of homogeneous nucleation by few heterogeneously formed and pre-existing ice crystals; also in this case high ice supersaturations can be observed (see, e.g., Gierens, Citation2003; Ren and MacKenzie, Citation2005; Spichtinger and Gierens, Citation2009c; Spichtinger and Cziczo, Citation2010).
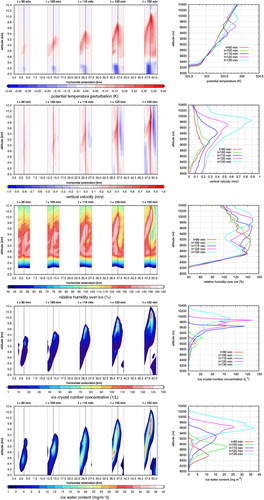
Fig. 11 Time evolution of a tracked cell during the time interval 90 ≤t≤130 min (Δt=10 min). The panel shows the time evolution of vertical velocity perturbations, relative humidity over ice, ice crystal number concentrations and ice water content, respectively. Left: 2D structure of the cell. Right: Vertical profiles at the centre of the cell.
We analyse this behaviour using timescale analysis. In , timescales for cooling, growth and mixing as well as ratios of timescales are represented at the end of time series in ; the cell is in its mature state (simulation time t=130 min). For processes cooling (or equivalently warming) vs. depositional growth (or equivalently sublimation) the timescale analysis is quite clear. The first term in eq. (3) (driven by vertical velocity) is almost always dominant over the growth/sublimation term, even in different velocity regimes (w<0 and w>0). It seems that just for values of cloud ice mixing ratio q
c
>10−5 kg/kg, diffusional growth could be of same order than cooling. This dominance can be also seen for the whole simulation data, as represented in the 2D probability distribution of (, upper left panel). For the comparison cooling vs. mixing, we find the same qualitative behaviour. The cooling term is almost always dominating over mixing. This feature can also be seen for the whole simulation in the 2D distribution (, upper right panel) Thus, in the updraughts of the convective cells, ice supersaturation is almost always increased by cooling, whereas neither depositional growth nor mixing is able to reduce ice supersaturation efficiently. The same is true for the downdraught regions. The decrease of relative humidity by warming due to downdraughts is dominating over enhancement of RHi by sublimating ice crystals or mixed air.
Fig. 12 Timescales and timescale ratios for the tracked cell at simulation time t=130 min. Top row: Timescales vs. ice mass mixing ratio for relative humidity timescales (left panel) and ice mass concentration timescales (right panel). Bottom row: Timescale ratios vs. vertical velocity for relative humidity timescales (left panel) and ice mass concentration timescales (right panel).
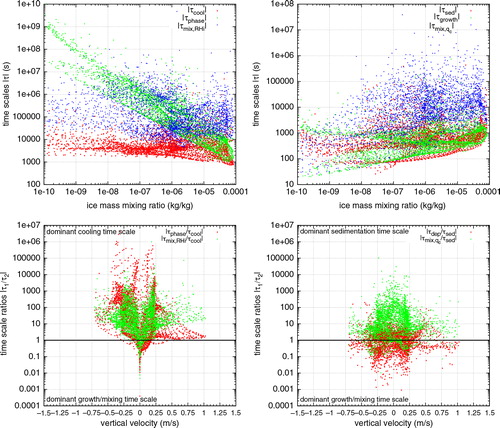
Fig. 13 Timescales for the whole simulation time. Top row: RHi timescale ratios, left: ratios ; right:
. Bottom row: q
c
timescale ratios, left: ratios
, right:
.
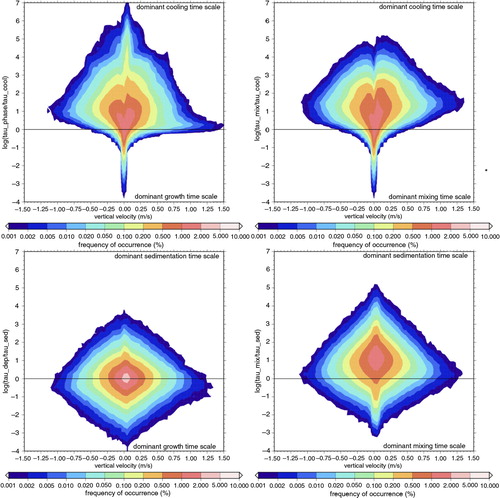
The comparison of timescales for ice mass mixing ratio q
c
shows a different behaviour. Growth and sedimentation are usually of the same order of magnitude. However, large variations can occur; both scenarios are possible, that is, and
. This behaviour can be seen in the snapshots at simulation time t=130 min () as well as in the overall picture (2D distribution in , lower left panel). The comparison between sedimentation and mixing shows a slightly different behaviour. Sedimentation is almost always dominating over mixing (
), that is, changes by sedimenting ice crystals are usually much faster than changes due to mixing of air due to local dynamics. This behaviour can be seen for the cell at simulation time t=130 min () as well as in the 2D probability distribution (, lower right panel).
For the time evolution of tracked cells, a typical life time of the cells, from first nucleation events to the decaying of the cell, can be estimated: t life ~90 min. The ice supersaturation inside the cell is just present as long as the intrinsic updraught is maintained by the latent heat release.
3.3.3. Statistics of relative humidity inside cirrus clouds.
In detailed investigation of cloud evolution, single cells and timescales, we have seen that ice supersaturation inside convective cells is possible and quite frequent. From snapshots in it is not possible to estimate the frequency of occurrence of such events. Therefore, we present a two-dimensional probability density for relative humidity and ice water content in . All data from the whole simulation are used; the criterion of ‘cloudy data’ was determined by a threshold of ice number concentration. A data point is marked as cloudy if the ice crystal number concentration exceeds the value N i,thers =1 L−1. This threshold corresponds quite well to the typical detection limit for in situ measurements (see, e.g., Krämer et al., Citation2009). Primarily, we are interested in ice supersaturation inside clouds. For consistency, we present the 2D distribution for the relative humidity range 30%≤RHi≤160% and the ice water content interval 0≤IWC≤90 mg m−3. The probability distribution is quite broad with a maximum around (RHi, IWC)≈(105%, 5 mg m−3). This enhanced relative humidity over ice is consistent with a permanent supersaturation source by large-scale dynamics w LS =0.03 m s−1. Several additional features can be seen (all values of frequency of occurrence are represented in ):
Ice clouds are usually not in thermodynamic equilibrium, only about 11.5% of all cloud events are close to saturation (RHi~100%, i.e., 98.5%≤RHi≤102.5%). The relative humidity inside clouds range between strong subsaturation (RHi~30%) and high supersaturation (RHi~160%). The reason for this feature is the slow relaxation due to long growth timescales at cold temperatures (in the usual typical range 103 s
s, see ).
For shallow cirrus convection, more ice clouds are in the supersaturated stage than in the subsaturated stage. Actually, in 52% of all cloud events ice supersaturation can be found (RHi>100%), 36.5% of all cloud cases are present in subsaturated air (RHi<100%).
Ice supersaturation inside thick cirrus clouds (IWC≥10 mg m−3) occurs quite often (about 14% of all cloud events); very high supersaturations up to RHi~150% are possible. The frequency of occurrence for ice supersaturation in very thick clouds (IWC≥30 mg m−3) is still not negligible (about 1.7% of all cloud events)
The two-dimensional probability distribution shows that ice supersaturation inside cirrus clouds is quite common in case of shallow cirrus convection. We note here that the probability distribution does not allow to estimate how long an air parcel inside a cirrus cloud is in the status of ice supersaturation (duration or persistence of supersaturation). The evolution of cells in shows that ice supersaturation in shallow cirrus convection is a transient phenomenon, triggered by vertical updraughts inside the cells and their lifetime. Generally, we tend to believe that if measurements along flight tracks show many data points in supersaturated air that these measurements represent persistent supersaturation. This is not necessarily true, as shown in the simulated situation.
Fig. 14 Joint two-dimensional probability density for relative humidity over ice inside cirrus clouds. The frequency of occurrence for events of certain relative humidity over ice and ice water content is shown for events with ice crystal number concentration larger than 1L−1. Thermodynamic equilibrium (RHi=100%) is indicated by a black line.
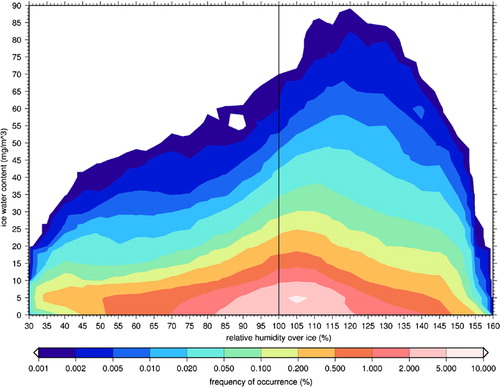
Table 1. Probability (in percent) for cloudy air (Ni ≥1 L−1) of a certain state of (super/sub)-saturation and ice water content, respectively
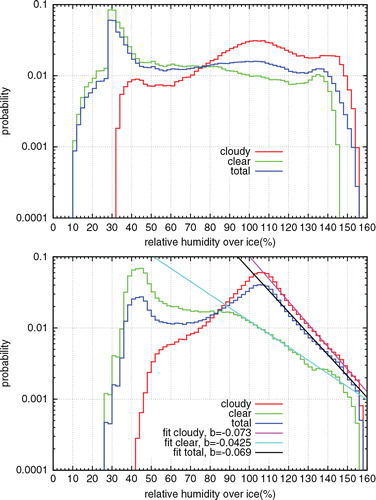
We additionally show probability distributions of relative humidity over ice for different parts of the simulation. During the time interval 60≤t≤210 min convective cells are triggered and they dominate the cloud structure. In the later period 210≤t≤400 min the convective activity is reduced. There are still some convective cells, however, the situation is more like a layer cloud, as driven by large-scale motion. Again, we discriminate between clear air and cloudy air by a threshold for ice crystal number concentration N i,thres =1 L−1.
The probability density of relative humidity over ice shows quite different behaviour for the two time periods (). During the phase of active convection, high relative humidity values are quite frequent inside and outside clouds due to vertical updraughts triggered by the cells themselves. The distribution for relative humidity in clear air is quite ‘flat’, whereas the humidity distribution for cloudy air shows a clear maximum around 105%, as already seen in the 2D distribution in . The distribution has also a clear secondary maximum around 145%. This is direct impact of convective updraughts leading to enhanced supersaturation inside the clouds, as discussed above. In the second time period, we find exponential decay for the supersaturated part of the distributions. In earlier studies this behaviour was already found in observational data obtained by different measurements techniques (Gierens et al., Citation1999, Citation2004; Spichtinger et al., Citation2002, Citation2003a Citation2004; Gettelman et al., Citation2006). However, it was always assumed (at least implicitly) that this exponential feature would exclusively occur for clear air data, but not for cloudy data. In our investigations the feature is present for both distributions. A simple exponential fit of the form p(RHi)=a·exp(−b·RHi) leads to exponents in the range 0.0425≤b≤0.073, comparable to former studies (Spichtinger et al., Citation2002, Citation2003b; Gettelman et al., Citation2006). It might be that the vigorous dynamics of the convective cells and mixing inside the supersaturated layer lead to this exponential behaviour, but the exact reason for this feature is still unknown. Beside the exponential behaviour, we see a clear maximum at about RHi~105% in the cloudy data, as already shown in the 2D distribution in . As discussed earlier, we would not expect relaxation to saturation since there is a constant source for supersaturation by the large scale updraught w LS =0.03 m s−1.
Fig. 15 Probability density of relative humidity over ice in cloudy air (red), clear air (green) and all data (blue) for the time intervals 60≤t≤210 min (top panel, active convection) and 210≤t≤400 min (bottom panel, decaying convection). For the later time period, the distributions are fitted by an exponential distribution of the form p(RHi)=a·exp(−b·RHi). The exponents b are indicated in the figure.
3.3.4. Statistics of vertical velocity and ice crystal number concentrations.
In , we show probability densities of vertical velocity for the two different time intervals as defined above (left panel: 60≤t≤210 min, right panel: 210≤t≤400 min), separated into clear and cloudy air by the ice crystal number concentration threshold N i,thres =1 L−1 (see Section 3.3.3). For the first period, the impact of convective cells can be seen quite clearly. The extension to large vertical velocity values is due to the strong upward motions inside the cells and the subsidence around the cells. The structure of the distribution for clear and cloudy data is quite similar to the ogival shape as reported by Gierens et al. (Citation2007). For clear air data, velocities are systematically lower than for cloudy data; inside clouds, the vertical velocity is triggered by the latent heat release and the maximum updraught is situated inside the cell. The rising cell is additionally influencing the air above and around it, leading to enhanced vertical velocities in clear air.
Fig. 16 Probability density of vertical velocity in cloudy air (red), clear air (green) and all data (blue) for the time intervals 60≤t≤210 min (top panel, active convection) and 210≤t≤400 min (bottom panel, decaying convection).
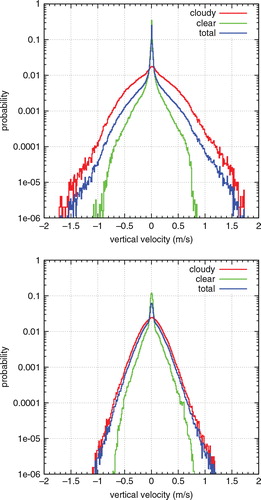
In the second period, the distributions are much more narrow. During this stage, convection is less active than before. Therefore, vertical velocities (inside and outside clouds) are generally smaller. The distribution shows an almost exponential decay in positive and negative velocity range. This behaviour is seen best for cloudy data. Frequency distributions of former measurements also show this quasi exponential distribution (e.g. during INCA campaign, see Kärcher and Ström, Citation2003).
In , we show probability densities of ice crystal number concentrations for the two different time intervals as defined above (red: 60≤t≤210 min, blue: 210≤t≤400 min). Both distributions peak around N i ~5–7 L−1. The distribution for the first time interval is quite broad. Low ice crystal number concentrations can be produced by weak nucleation events at the very beginning, triggered mainly by the large-scale updraught; the second source for these low concentration is sedimentation of ice crystals leading to a vertical spread and low concentrations (see discussion in Spichtinger and Gierens, Citation2009b). There is a cut-off for high ice crystal concentrations around Ni ~1000 L−1, only three data points show such high concentrations. In the second time interval, the distribution looks very similar, just the maximum is much more pronounced. Low ice crystal number concentrations are consistent with high ice supersaturation values (see discussion in Krämer et al., Citation2009).
Fig. 17 Probability density of ice crystal number concentrations for the time intervals 60≤t≤210 min (red) and 210≤t≤400 min (blue).
3.3.5. Mixing of supersaturated layers.
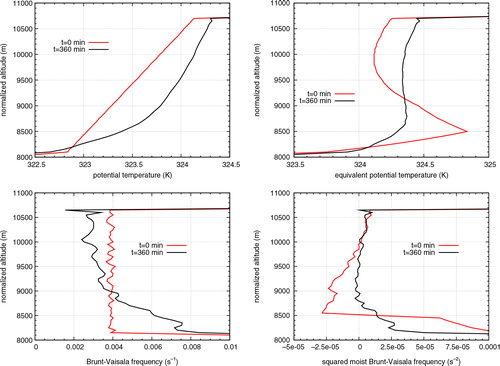
Convection has a strong impact on mixing in the atmosphere. Especially deep convection leads to strong mixing of atmospheric layers; after convection mixed layers show a lapse-rate close to moist adiabatic lapse-rate. In our case of shallow convection inside ice-supersaturated layers, a priori it is not clear, which final state will be reached. For a qualitative analysis we investigate mean profiles of (equivalent) potential temperature θ,θ
e
. The profiles are averaged over the horizontal direction. We compare profiles of the vertical layer 8≤z≤11 km from the initialisation of the simulation and at simulation time t=360 min, when convective activity is very weak. For a better comparison, we shift the vertical profile at t=360 m downwards by Δz=648 m, such that both profiles are normalised by altitude. From equivalent potential temperature a ‘moist’ Brunt-Vaisala frequency (N
m
) can be derived, similarly to standard Brunt-Vaisala frequency (N):8
show vertical profiles of θ,θ e (upper row) and N, N m (lower row) at initialisation (solid line) and at simulation time t=360 min (dashed line). At the initialisation, the stratification is quite weak (N≈0.004 s−1) and a potentially unstable layer is present by enhanced humidity in the supersaturated layer. During the simulation, convective activity leads to transport of the latent heat and mixing. At simulation time t=360 min, the potential temperature profile has changed over the whole layer. In the upper part (z≥9 km) stability has decreased, whereas in the lower part (z≤9 km) stability has increased. The equivalent potential temperature approaches neutral stratification, but a slight potentially unstable layer remains. Thus, convective mixing is not strong enough to remove potential instability completely. Further latent heat release would trigger again (weak) convection. We have calculated a ‘moist-adiabatic’ lapse rate for vapour-ice transitions, similarly to the usual definition of moist-adiabatic lapse-rates (see, e.g., Emanuel, Citation1994). However, the final profile does not approach this ‘moist-adiabatic’ lapse-rate, even not for a constant supersaturation S i ≠1. Thus, for shallow convection in pure ice clouds there is not a final state in mixing reaching ‘moist-adiabatic’ lapse-rate, that is, a state near thermodynamic equilibrium. This is in contrast to the usual behaviour for pure liquid convective clouds. Since thermodynamic equilibrium is not a typical state for ice clouds in contrast to liquid clouds, this is not a surprising result.
Fig. 18 Vertical profiles of potential temperature, entropy ice potential temperature, Brunt-Vaisala frequency and squared moist Brunt-Vaisala frequency, respectively, at times t=0 min and t=360 min, shifted to an equivalent height (i.e. start height).

3.3.6. Comparison of radiosonde profiles with ‘pseudo-radiosoundings’.
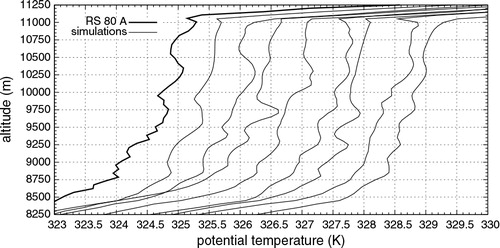
In our realistic case, there are no in situ measurements of ice crystals for corroborating the existence of convective cells; therefore, we have to carry out a circumstantial evidence. For this purpose we compare the vertical profile of potential temperature as measured by the radiosonde with several ‘pseudo-radiosonde’ profiles. For a horizontal grid point we extract the vertical column at this point as a ‘pseudo-radiosonde’ ascent. The realisations are given for a distinct simulation time (t=195 min) equivalent to the realistic radiosonde ascent.
The measured profile of potential temperature (, thick line) shows a high variability. Some unstable layers are embedded into stable layers. The perturbations in potential temperature are in the order of Δθ~0.2–0.5 K. As we have seen from our investigation of a single convective cell, such perturbations might result from an ascending convective cell. Temperature perturbations from latent heat release are transported upwards by the updraught of the cell, leading to a signature of an unstable layer. We see a similar signature in the pseudo-radiosondes as extracted from the model simulation. shows eight realisations of vertical profiles, shifted by Δθ=0.5 K for better representation. We cannot expect that the realistic profile is represented in a 1–1 relation. However, many profiles show very similar structures as in the observations; the magnitude of simulated perturbations is in very good agreement with measured perturbations. Thus, this is a strong indication that the structure in the radiosonde profile of potential temperature is crucially determined by convective cells in cirrus clouds.
Fig. 19 Potential temperature profile as obtained from the radiosonde (thick line) and eight realisations from the simulation at a corresponding simulation time (t=195 min). The profiles are shifted by Δθ=0.5 K for a better representation.
4. Discussion
The key for ice supersaturation inside cirrus clouds is a source term due to vertical updraughts. Timescale analysis showed clearly that this cooling term in relative humidity rates is almost always dominating over other terms. Although latent heat release and in turn formation of cellular structures is the dominant effect for ice supersaturation inside cirrus clouds in this study, some other effects might influence or modify this feature. Here we discuss some other effects:
Impact of radiation:
In our simulations we omit radiative transfer calculations with feedbacks to the cloud dynamics. This was done for concentrating on feedbacks of latent heat release only. Cloud-radiation feedbacks are very complex processes and depend on many environmental conditions. Ice crystals absorb solar radiation and the high water vapour inside the clouds lead to a strong signal in infrared radiation. In turn, cirrus clouds produce local heating rates. The exact values depend strongly on environmental conditions. Therefore, we decided to leave out the effect. We have carried out off-line radiative transfer calculations in order to estimate typical heating rates inside the cells. For this purpose we used the radiative transfer code by Fu and Liou (Citation1993) and adapted formulae for the effective size of the ice crystals (see Appendix in Joos et al., Citation2014). For typical mid-latitude conditions in spring (latitude ~50°, surface temperature T s ~300 K) we could derive local heating rates in order of
Additional heterogeneous nucleation:
The dominant ice formation process in the extra tropical tropopause region is homogeneous freezing of aqueous solution droplets (Kärcher and Ström, Citation2003). Heterogeneous nucleation might play a minor role. For the sub tropics, the picture might change, as recent studies suggest; this is probably due to the high loading of heterogeneous IN in the subtropical upper troposphere (Cziczo et al., Citation2013). Boxmodel studies without including sedimentation proposed suppression of homogeneous nucleation for small number concentrations of IN in order of N IN ~10 L−1 (Gierens, Citation2003; Ren and MacKenzie, Citation2005). If sedimentation is included, box model studies suggest more a modification of homogeneous nucleation events for typical IN concentrations in the tropopause region (Haag and Kärcher, Citation2004; Spichtinger and Cziczo, Citation2010). In former studies using LES models, perturbation and modification of homogeneous nucleation by heterogeneous IN was corroborated (Spichtinger and Gierens, Citation2009c; Joos et al., Citation2014). For investigating the impact of heterogeneous IN on shallow cirrus convection, we run the model including heterogeneous IN with a nucleation threshold at RHi IN,thres =130% and a number concentration of N IN =10 L−1 as described in Section 3.2. The results show no qualitative difference in the convective cell activity. In case of additional heterogeneous IN, convective activity was triggered earlier due to the lower nucleation threshold compared to homogeneous nucleation. The main structure of convective cells as well as of high supersaturation inside the cells remains the same. Ice supersaturation is present in the cells as for pure homogeneous nucleation. We do not quantify the impact of heterogeneous nucleation further, because this is beyond the scope of this study. In an upcoming study, we will address this issue in a more idealised setup.
Role of sedimentation:
Sedimentation of ice crystals due to gravity is of high importance for the development of cirrus clouds (see, e.g., Spichtinger and Gierens, Citation2009c; Spichtinger and Cziczo, Citation2010). In box model studies this effect is usually neglected, although some models deal with rudimental sedimentation approaches (Haag and Kärcher, Citation2004; Kay et al., Citation2006; Spichtinger and Cziczo, Citation2010). As discussed above, fall streaks are formed by sedimentation. The removal of ice crystals from their origin by gravity leads to a weakening of the growth term in the relative humidity rate [eq. (3)]. This results into less latent heat release, which feedbacks to vertical velocity. We tested the impact of sedimentation by running a simulation without sedimentation. As expected, the ice crystals stay in the cells; they can only be removed by active warming of the cells due to downdraughts. Convective activity starts earlier since latent heat release is more effective at the beginning. However, the initial structure of the cells remains similarly to the standard run. The overturning of the cells is enhanced; the vertical velocities do not change as compared to the reference simulation. The ice water content is about 2–5 times higher but ice crystal number concentrations are somewhat reduced due to very efficient quenching. In contrast to the standard run with spacings between the cells in order of some kilometres, in the sensitivity run the whole 2D domain is filled with clouds after about 180 min. Although one would think that growth should be more effective, the timescale analysis shows that still the velocity driven source of supersaturation dominates overall other terms. High ice supersaturation is still possible and frequent. The strong internal overturning leads to subsidence regions with warming and sublimation of the ice crystals. Additionally, water vapour and ice mass concentrations are spread by mixing.
5. Summary and conclusions
We investigated the hypothesis of shallow convection inside cirrus clouds (‘shallow cirrus convection’) in the tropopause region. Measurements from radiosondes and ECMWF meteorological analyses show evidence of a potentially unstable layer in the upper troposphere with a large vertical extension in order of 2 km. We used a state-of-the-art large-eddy cirrus simulation model for simulating this realistic case. From the simulations, we could derive the following main results.
Shallow cirrus convection is possible in analogy to classical cloud dynamics for liquid clouds. A potentially unstable layer is externally lifted by large-scale motion, leading to first ice nucleation events. Cell formation is triggered by latent heat release of growing ice crystals. During the developing stage, sedimenting ice crystals form characteristic fall streaks. The cells rise until they reach their level of neutral buoyancy near the tropopause. Then they decay and evaporate in the subsidence around the updraught regions of the cells.
Ice supersaturation inside cirrus clouds can be triggered by shallow cirrus convection. The source for supersaturation is the intrinsic updraught of convective cells, leading to cooling and increase of relative humidity. The source term driven by vertical velocity is almost always dominating over sinks in supersaturation, given by diffusional growth. The same is true for subsidence regions. Also in such cases, drying of air in terms of relative humidity due to downward motion dominates over possible moistening due to sublimating ice crystals.
Mixing due to local dynamics can also influence relative humidity in cirrus clouds. Timescale analysis for relative humidity rates shows that the impact of mixing is usually small compared to cooling, but could be of same order as diffusional growth.
Cirrus clouds in shallow cirrus convection are usually not in thermodynamic equilibrium (i.e. saturation). Just about 11.5% of all cloudy data (N i ≥N i,theres=1 L−1) are close to saturation. About 52% of cloudy data are found at ice supersaturation, whereas about 36.5% of cloudy data are found in subsaturated air. Since cirrus clouds constitute an open thermodynamic system, this result is consistent with non-equilibrium thermodynamics.
About 14% of all cloudy data represent thick cirrus clouds (IWC≥10 mg m−3) in status of ice supersaturation. Even for very thick cirrus clouds (IWC≥30 mg m−3), ice supersaturation is possible (which occurs in about 1.7% of all cloudy data). High supersaturation (S i ≥12) inside cirrus clouds could be found in about 20% of all cloudy data, very high supersaturation (S i ≥14) is present in about 5% of all cloud events (see also values reported in )
Relative humidity probability density functions show exponential decay in the supersaturated interval for clear and cloudy air conditions, mostly during the later stage of the convection evolution. This is in contrast to our former conjecture that the exponential feature is dominant for clear measurements only. The exponential feature is probably driven by strong mixing inside the cirrus layer.
Sedimentation is an important process for shaping cells in the manner of fall streaks. Diffusional growth and sedimentation are of equal importance in terms of timescale analysis. High variations in the dominance can occur (i.e.
The rising cells transport potential temperature, ice and water vapour into the upper part of the layer; the subsidence around the cells transport upper air masses downwards. These effects lead to a general kind of mixing, driven by the life cycle of the cells. At the end of the simulations a partly mixed layer was established; however, the layer includes still some potentially unstable parts. The final stratification differs from moist-adiabatic lapse rate. Therefore we conclude that shallow cirrus convection does not generally lead to a well-mixed state. This is due to the very moderate updraughts in the range
Ice supersaturation in shallow cirrus convection is a transient phenomenon. It is not persistent but is limited to the lifetime of convective cells. This feature can only be detected introducing time-dependent investigations.
We were able to investigate shallow cirrus convection and derived some results corroborating the existence of high ice supersaturation inside cirrus clouds, as driven by vertical motions. Dynamics is the key for the multi scale system of cirrus clouds in their environment. From our investigation we can carefully conclude that dynamics is the dominating process driving thermodynamic states of cirrus clouds. Microphysical effects might modify cirrus cloud processes. Probably, in many cases of actual measurements superposition of dynamics on different scales might explain thermodynamic conditions (see also Spichtinger and Krämer, Citation2013). Our investigations are representative in absence of additional motions, which could superimpose large-scale dynamics and convective cell dynamics. For instance, gravity waves propagating through cirrus layers might change the qualitative results. However, small-scale variability is represented in the simulations in form of initially prescribed perturbations of potential temperature. Additional turbulence would be related to breaking waves, which are excluded in our case.
Finally, we want to remark that the origin of the potentially unstable layer in our case is not clear. Possible formation mechanisms are large-scale advection and mixing of different air masses, mesoscale mixing processes (e.g. near the jet regions due to strong wind shear) or radiation processes in cloudy and clear air with an enhanced water vapour content (leading to strong radiative cooling). In future work, these issues should be clarified. In future studies, we will investigate the impact of environmental conditions on shallow cirrus convection in more detail.
6. Acknowledgements
I thank Ulrich Achatz, Marcia Baker, Andreas Dörnbrack, Fabian Fusina, Hanna Joos, Ulrich Schumann, Piotr Smolarkiewicz and Heini Wernli for fruitful discussions. I also thank two anonymous reviewers; their comments helped to improve the manuscript significantly. This work was partly supported by the European Commission within the framework of a Marie Curie fellowship (Impact of mesoscale dynamics and aerosols on the life cycle of cirrus clouds). This work contributes to the COST action ‘Water Vapour in the Climate System’ (WaVaCS). The simulations were carried out on the high-performance computing facilities of the European Centre for Medium-Range Forecasts (ECMWF) within the framework of the special project ‘Ice supersaturation and cirrus clouds’ (SPDEISSR).
Notes
1Note that in most discussions, no definitions on ‘high supersaturation’ and ‘thick cirrus clouds’ are given. There is a kind of common sense on high values (usually S i >1.3, close to nucleation thresholds), but clear definitions are lacking.
Related Research Data
References
- Bogdan A. , Molina M. J . Why does large relative humidity with respect to ice persist in cirrus ice clouds?. J. Phys. Chem. 2009; 113: 14123–14130.
- Brabec M. , Wienhold F. G. , Luo B. P. , Vmel H. , Immler F. , co-authors . Particle backscatter and relative humidity measured across cirrus clouds and comparison with microphysical cirrus modelling. Atmos. Chem. Phys. 2013; 12: 9135–9148.
- Bretherton C. S. , Smolarkiewicz P. K . Gravity waves, compensating subsidence and detrainment around cumulus clouds. J. Atmos. Sci. 1989; 46: 740–759.
- Cirisan A. , Luo B. P. , Engel I. , Wienhold F. G. , Krieger U. K. , co-authors . Balloon-borne match measurements of mid-latitude cirrus clouds. Atmos. Chem. Phys. 2014; 14: 7341–7365.
- Cirisan A. , Spichtinger P. , Luo B. P. , Weisenstein D. K. , Wernli H. , co-authors . Microphysical and radiative changes in cirrus clouds by geoengineering the stratosphere. J. Geophys. Res. 2013; 118: 4533–4548.
- Chen T. , Rossow W. B. , Zhang Y . Radiative effects of cloud-type variations. J. Clim. 2000; 13: 264–286.
- Comstock J. , Lin R.-F. , Starr D. O. , Yang P . Understanding ice supersaturation, particle growth, and number concentration in cirrus clouds. J. Geophys. Res. 2008; 113: D23211.
- Cziczo D. J. , Froyd K. D. , Hoose C. , Jensen E. J. , Diao M. , co-authors . Clarifying the dominant sources and mechanisms of cirrus cloud formation. Science. 2013; 340: 1320–1324.
- DeMott P. , Cziczo D. , Prenni A. , Murphy D. , Kreidenweis S. , co-authors . Measurements of the concentration and composition of nuclei for cirrus formation. Proc. Natl. Acad. Sci. U. S. A. 2003; 100: 14655–14660.
- Emanuel K. A . Atmospheric Convection. 1994; New York: Oxford University Press.
- Fahey D. W. , Gao R.-S. , Möhler O. , Saathoff H. , Schiller C. , co-authors . The AquaVIT-1 intercomparison of atmospheric water vapor measurement techniques. Atmos. Meas. Tech. Discuss. 2014; 7: 3159–3251.
- Fu Q. , Liou K . Parameterization of the radiative properties of cirrus clouds. J. Atmos. Sci. 1993; 50: 2008–2025.
- Fusina F. , Spichtinger P . Cirrus clouds triggered by radiation, a multiscale phenomenon. Atmos. Chem. Phys. 2010; 10: 5179–5190.
- Fusina F. , Spichtinger P. , Lohmann U . The impact of ice supersaturated regions and thin cirrus on radiation in the mid latitudes. J. Geophys. Res. 2007; 112: D24S14.
- Gary B. L . Mesoscale temperature fluctuations in the stratosphere. Atmos. Chem. Phys. 2006; 6: 4577–4589.
- Gensch J. , Bunz H. , Baumgardner D. G. , Christensen L. E. , Fahey D. W. , co-authors . Supersaturations, microphysics and nitric acid partitioning in a cold cirrus cloud observed during CR-AVE 2006: an observation-modelling intercomparison study. Environ. Res. Lett. 2008; 3: 035003.
- Gettelman A. , Fetzer E. J. , Eldering A. , Irion F. W . The global distribution of supersaturation in the upper troposphere from the Atmospheric Infrared Sounder. J. Clim. 2006; 19: 6089–6103.
- Gierens K . On the transition between heterogeneous and homogeneous freezing. Atmos. Chem. Phys. 2003; 3: 437–446.
- Gierens K. , Kohlhepp R. , Dotzek N. , Smit H . Instantaneous fluctuations of temperature and moisture in the upper troposphere and tropopause region. Part 1: probability densities and their variability. Meteorol. Z. 2007; 16: 221–231.
- Gierens K. , Kohlhepp R. , Spichtinger P. , Schroedter-Homscheidt M . Ice supersaturation as seen from TOVS. Atmos. Chem. Phys. 2004; 4: 539–547.
- Gierens K. , Schumann U. , Helten M. , Smit H. , Marenco A . A distribution law for relative humidity in the upper troposphere and lower stratosphere derived from three years of MOZAIC measurements. Ann. Geophys. 1999; 17: 1218–1226.
- Gierens K. , Spichtinger P . On the size distribution of ice supersaturation regions in the upper troposphere and lower stratosphere. Ann. Geophys. 2000; 18: 499–504.
- Grabowski W. W . Representation of turbulent mixing and buoyancy reversal in bulk cloud models. J. Atmos. Sci. 2007; 64: 3666–3680.
- Gu Y. , Liou K. N . Interactions of radiation, microphysics, and turbulence in the evolution of cirrus clouds. J. Atmos. Sci. 2000; 57: 2463–2479.
- Haag W. , Kärcher B . The impact of aerosols and gravity waves on cirrus clouds at midlatitudes. J. Geophys. Res. 2004; 109: D12202.
- Haag W. , Kärcher B. , Strm J. , Minikin A. , Lohmann U. , co-authors . Freezing thresholds and cirrus cloud formation mechanisms inferred from in situ measurements of relative humidity. Atmos. Chem. Phys. 2003; 3: 1791–1806.
- Houze R. A . Cloud Dynamics.
- Houze R. A . Cloud Dynamics.
- Jensen E. J. , Toon O. B. , Tabazadeh A. , Sachse G. W. , Anderson B. E. , co-authors . Ice nucleation processes in upper tropospheric wave-clouds observed during SUCCESS. Geophys. Res. Lett. 1998; 25: 1363.
- Joos H. , Spichtinger P. , Lohmann U . Orographic cirrus in a future climate. Atmos. Chem. Phys. 2009; 9: 7825–7845.
- Joos H. , Spichtinger P. , Lohmann U. , Gayet J.-F. , Minikin A . Orographic cirrus in the global climate model ECHAM5. J. Geophys. Res. 2008; 113: D18205.
- Joos H. , Spichtinger P. , Reutter P. , Fusina F . Influence of heterogeneous freezing on the microphysical and radiative properties of orographic cirrus clouds. Atmos. Chem. Phys. 2014; 14: 6835–6852.
- Kajikawa M. , Heymsfield A . Aggregation of ice crystals. J. Atmos. Sci. 1989; 46: 3108–3121.
- Kärcher B. , Koop T . The role of organic aerosols in homogeneous ice formation. Atmos. Chem. Phys. 2005; 5: 703–714.
- Kärcher B. , Lohmann U . A parameterization of cirrus cloud formation: homogeneous freezing of supercooled aerosols. J. Geophys. Res. 2002; 107(D2): 4010.
- Kärcher B. , Ström J . The roles of dynamical variability and aerosols in cirrus cloud formation. Atmos. Chem. Phys. 2003; 3: 823–838.
- Kay J. , Wood R . Timescale analysis of aerosol sensitivity during homogeneous freezing and implications for upper tropospheric water vapor budgets. Geophys. Res. Lett. 2008; 35: 10809.
- Kay J. E. , Baker M. , Hegg D . Microphysical and dynamical controls on cloud optical depth distributions. J. Geophys. Res. 2006; 111: D24205.
- Kay J. E. , Baker M. , Hegg D . Physical controls on orographic cirrus inhomogeneity. Atmos. Chem. Phys. 2007; 7: 3771–3781.
- Klein R. , Majda A . Systematic multiscale models for deep convection on mesoscales. Theor. Comp. Fluid Dyn. 2006; 20: 525–552.
- Koop T. , Bookhold J. , Shiraiwa M. , Pöschl U . Glass transition and phase state of organic compounds: dependency on molecular properties and implications for secondary organic aerosols in the atmosphere. Phys. Chem. Chem. Phys. 2011; 13: 19238–19255.
- Koop T. , Luo B. , Tsias A. , Peter T . Water activity as the determinant for homogeneous ice nucleation in aqueous solutions. Nature. 2000; 406: 611–614.
- Korolev A. , Mazin I . Supersaturation of water vapor in clouds. J. Atmos. Sci. 2003; 60: 2957–2974.
- Krämer M. , Schiller C. , Afchine A. , Bauer R. , Gensch I. , co-authors . On cirrus cloud supersaturations and ice crystal numbers. Atmos. Chem. Phys. 2009; 9: 3505–3522.
- Lane T. P. , Doyle J. D. , Plougonven R. , Shapiro M. A. , Sharman R. D . Observations and numerical simulations of inertia-gravity waves and shearing instabilities in the vicinity of a jet stream. J. Atmos. Sci. 2004; 61: 2692–2706.
- Lane T. P. , Reeder M. J. , Clark T. L . Numerical modeling of gravity wave generation by deep tropical convection. J. Atmos. Sci. 2001; 58: 1249–1274.
- Lee S.-H. , Wilson J. C. , Baumgardner D. , Herman R. L. , Weinstock E. M. , co-authors . New particle formation observed in the tropical/subtropical cirrus clouds. J. Geophys. Res. 2004; 109: D20209.
- Leiterer U. , Dier H. , Nagel D. , Naebert T. , Althausen D. , co-authors . Correction method for RS80-A Humicap humidity profiles and their validation by lidar backscattering profiles in tropical cirrus clouds. J. Atmos. Ocean. Tech. 2005; 22: 18–29.
- Lin Y.-L . Mesoscale Dynamics.
- McIntyre M. E . Potential-vorticity inversion and the wave-turbulence jigsaw: some recent clarifications. Adv. Geosci. 2008; 15: 47–56.
- Minikin A. , Petzold A. , Ström J. , Krejci R. , Seifert M. , co-authors . Aircraft observations of the upper tropospheric fine particle aerosol in the Northern and Southern Hemispheres at midlatitudes. Geophys. Res. Lett. 2003; 30: 1503.
- Murphy D. M . Dehydration in cold clouds is enhanced by a transition from cubic to hexagonal ice. Geophys. Res. Lett. 2003; 30: 2230.
- Murphy D. M. , Koop T . Review of the vapour pressure of ice and supercooled water for atmospheric applications. Q. J. Roy. Meteorol. Soc. 2005; 131: 1539–1565.
- Murray B. J . Inhibition of ice crystallisation in highly viscous aqueous organic acid droplets. Atmos. Chem. Phys. 2008a; 8: 5423–5433.
- Murray B. J . Enhanced formation of cubic ice in aqueous organic acid droplets. Environ. Res. Lett. 2008b; 3: 025008.
- Murray B. J. , Knopf D. A. , Bertram A. K . The formation of cubic ice under conditions relevant to Earth's atmosphere. Nature. 2005; 434: 202–205.
- Murray B. J. , Wilson T. W. , Dobbie S. , Cui Z. , Al-Jumur S. M. R. K. , co-authors . Heterogeneous nucleation of ice particles on glassy aerosols under cirrus conditions. Nat. Geosci. 2010; 3: 233–237.
- O'Sullivan D. , Dunkerton T . Generation of inertia-gravity waves in a simulated life cycle of baroclinic instability. J. Atmos. Sci. 1995; 52: 3695–3716.
- Ovarlez J. , van Velthoven P. , Sachse G. , Vay S. , Schlager H. , co-authors . Comparison of water vapor measurements from POLINAT 2 with ECMWF analyses in high humidity conditions. J. Geophys. Res. 2000; 105(D3): 3737–3744.
- Peter T. , Marcolli C. , Spichtinger P. , Corti T. , Baker M. B. , co-authors . When dry air is too humid. Science. 2006; 314(5804): 1399–1402.
- Plougonven R. , Muraki D. J. , Snyder C . A baroclinic instability that couples balanced motions and gravity waves. J. Atmos. Sci. 2005; 62: 1545–1559.
- Plougonven R. , Teitelbaum H. , Zeitlin V . Inertia gravity wave generation by the tropospheric midlatitude jet as given by the Fronts and Atlantic Storm-Track Experiment radio soundings. J. Geophys. Res. 2003; 108(D21): 4686.
- Prusa J. , Smolarkiewicz P. , Wyszogrodzki A . EULAG, a computational model for multiscale flows. Comput. Fluids. 2008; 37: 1193–1207.
- Ren C. , MacKenzie A. R . Cirrus parametrization and the role of ice nuclei. Q. J. Roy. Meteorol. Soc. 2005; 131: 1585–1605.
- Rosenthal A. J. , Lindzen R. S . Instabilities in a stratified fluid having one critical level. Part I: results. J. Atmos. Sci. 1983; 40: 509–520.
- Schumann U . Subgrid length-scales for large-eddy simulation of stratified turbulence. Theor. Comput. Fluid Dyn. 1991; 2: 279–290.
- Shilling J. E. , Tolbert M. A. , Toon O. B. , Jensen E. J. , Murray B. J. , co-authors . Measurements of the vapor pressure of cubic ice and their implications for atmospheric ice clouds. Geophys. Res. Lett. 2006; 33: L17801.
- Skrotzki J. , Connolly P. , Schnaiter M. , Saathoff H. , Mhler O. , co-authors . The accommodation coefficient of water molecules on ice – cirrus cloud studies at the AIDA simulation chamber. Atmos. Chem. Phys. 2013; 13: 4451–4466.
- Smith R . The influence of mountains on the atmosphere. Adv. Geophys. 1979; 21: 87–230.
- Smolarkiewicz P. , Margolin L . On forward–in–time differencing for fluids: an Eulerian/Semi–Lagrangian non–hydrostatic model for stratified flows. Atmos. Oceans. 1997; 35: 127–152.
- Spichtinger P. , Cziczo D. J . Impact of heterogeneous ice nuclei on homogeneous freezing events in cirrus clouds. J. Geophys. Res. 2010; 115: D14208.
- Spichtinger P. , Gierens K . Modelling cirrus clouds. Part 1a: model description and validation. Atmos. Chem. Phys. 2009a; 9: 685–706.
- Spichtinger P. , Gierens K . Modelling cirrus clouds. Part 1b: structuring cirrus clouds by dynamics. Atmos. Chem. Phys. 2009b; 9: 707–719.
- Spichtinger P. , Gierens K . Modelling cirrus clouds. Part 2: competition of different nucleation mechanisms. Atmos. Chem. Phys. 2009c; 9: 2319–2334.
- Spichtinger P. , Gierens K. , Dörnbrack A . Formation of ice supersaturation by mesoscale gravity waves. Atmos. Chem. Phys. 2005b; 5: 1243–1255.
- Spichtinger P. , Gierens K. , Leiterer U. , Dier H . Ice supersaturation in the tropopause region over Lindenberg, Germany. Meteorol. Z. 2003a; 12: 143–156.
- Spichtinger P. , Gierens K. , Read W . The statistical distribution law of relative humidity in the global tropopause region. Meteorol. Z. 2002; 11: 83–88.
- Spichtinger P. , Gierens K. , Read W . The global distribution of ice supersaturated regions as seen by the microwave limb sounder. Q. J. Roy. Meteorol. Soc. 2003b; 129: 3391–3410.
- Spichtinger P. , Gierens K. , Smit H. G. J. , Ovarlez J. , Gayet J.-F . On the distribution of relative humidity in cirrus clouds. Atmos. Chem. Phys. 2004; 4: 639–647.
- Spichtinger P. , Gierens K. , Wernli H . A case study on the formation and evolution of ice supersaturation in the vicinity of a warm conveyor belt's outflow region. Atmos. Chem. Phys. 2005a; 5: 973–987.
- Spichtinger P. , Krämer M . Tropical tropopause ice clouds: a dynamical approach to the mystery of low crystal numbers. Atmos. Chem. Phys. 2013; 13: 9801–9818.
- Vay S. A. , Anderson B. E. , Jensen E. J. , Sachse G.W. , Ovalez J. , co-authors . Tropospheric water vapor measurements over the North Atlantic during the Subsonic Assessment Ozone and Nitrogen Oxide Experiment (SONEX). J. Geophys. Res. 2000; 105: 3745–3756.
- Wernli H. , Davies H . A Lagrangian-based analysis of extratropical cyclones. I: the method and some applications. Q. J. Roy. Meteorol. Soc. 1997; 123: 467–489.
- Zhang W. , Macke A. , Albers F . Effect of crystal size spectrum and crystal shape on stratiform cirrus radiative forcing. Atmos. Res. 1999; 52: 59–79.
- Zobrist B. , Marcolli C. , Pedernera D. A. , Koop T . Do atmospheric aerosols form glasses?. Atmos. Chem. Phys. 2008; 8: 5221–5244.
7. Appendix: derivation of timescales
The general assumption for timescale analysis of a quantity ψ, driven by several competing processes i=1, …, n is as follows:9
that is, each process i is linked to an instantaneous timescale , which would result into an exponential behaviour. For the superposition of the different processes i=1, …, n, we can write
10
By definition, timescales can have different signs, indicating sources and sinks for the quantity ψ. For the investigations in shallow cirrus convection, that is, in the cells, two different variables must be studied, relative humidity over ice (or equivalently the saturation ratio Si=RHi/100%) and ice mass mixing ratio. For this purpose, we derive the following equations:
(1) Relative humidity evolution: RHi depends on temperature, pressure and water vapour mixing ratio, respectively. Thus, we have to consider changes in these variables, given by external forcings (vertical motion and mixing) and phase transitions in the system. Mixing plays a minor role for temperature and pressure changes, since the horizontal and vertical gradients on grid resolution are small and also variations are quite small; therefore mixing can be neglected for temperature and pressure. The temperature, pressure and humidity rates can be described as follows:11
12
13
For the changes of temperature we get the following equations14
whereas for pressure we can express the changes via temperature changes15
For diagnosing mixing, we make an ansatz in terms of eddy diffusivity, that is, the changes in concentrations due to mixing can be described by the following equation.16
K
q
denotes the eddy diffusivity coefficient, related to turbulent kinetic energy E
17
The perturbation velocities are given by subtracting the initial horizontal wind profile u
e
(z) as represented in (left panel) and subtracting the large-scale vertical wind component. The diffusivity can be expressed by with the characteristic length scale of grid resolution
m and a constant c=0.2 (see, e.g., Schumann, Citation1991; Grabowski, Citation2007). Using the expressions for partial derivatives
18
we end with an equation for sources and sinks of relative humidity:19
Using the growth equation for the specific humidity rate, that is,20
whereas a=f·a*(p,T), b=b(p,T),21
and σ
m
denotes the geometric width of the lognormal mass distribution. The coefficients a
*, b are described by Spichtinger and Gierens (Citation2009a). The final expression for the relative humidity rate is then as follows:22
23
Since, we mostly investigate upward motions, we adopt the usual term for the vertical forcing to be ‘cooling’. The timescales for cooling, phase change and mixing, respectively, are given by24
25
26
(2) Cloud ice mixing ratio evolution: Cloud ice mass is changed by growth by diffusion, sedimentation and mixing due to eddies. For mixing, we use the same ansatz as above, but now for cloud ice mass concentration q
c
. Thus, the rate equation can be described as27
28
29
while . Note, that because q,q
c
are scalars, we can set K
q
=Kqc
(Schumann, Citation1991). Thus, we can define timescales for the ice mass mixing ratio
30
31
32
Note, that timescales and
are different, although they rely to the same process (phase change due to diffusional growth).