
Abstract
A series of idealised experiments using a cloud-resolving storm simulator (CReSS) was performed to investigate the effects of the isolated elliptically shaped terrain of Jeju Island (oriented east–west), southern Korea, on the enhancement of pre-existing rainfall systems under the influence of prevailing southwesterly moist flows. Control parameters were the low-altitude wind speed (Froude numbers: 0.2, 0.4, 0.55) and the initial location of the elongated (oriented north–east) rainfall system (off the northwestern or western shores of the island). Simulations were conducted for all combinations of initial location and wind regime. Overall, results indicate that weak southwesterlies flowing around the steep mountain on the island (height, 2 km) generate two local convergences, on the northern lateral side and on the lee side of the island, both in regions of moist environments, thus producing conditions favourable for enhanced rainfall. As an eastward-moving rainfall system approaches the northwestern shore of the island, the southwesterlies at low altitudes accelerate between the system and the terrain, generating a local updraft region that causes rainfall enhancement onshore in advance of the system's arrival over the terrain. Thus, the prevailing southwesterlies at low altitudes that are parallel to the terrain are a crucial element for the enhancement. Relatively weak southwesterlies at low altitudes allow system enhancement on the lee side by generating a convergence of relatively weak go-around northwesterlies from the northern island and relatively strong moist southwesterlies from the southern island, thus producing a relatively long-lived rainfall system. As the southwesterlies strengthen, a dry descending air mass intensifies on the northeastern downwind side of the terrain, rapidly dissipating rainfall and resulting in a relatively short-lived rainfall system. A coexisting terrain-generated local convergence, combined with the absence of dry descending air on the downwind side of the terrain, prolongs the lifetime of the rainfall system.
1. Introduction
1.1. Background
Orographic features play an important role in controlling cloud formation and the amount and distribution of associated precipitation (Lin, Citation2007). Previous studies have improved our understanding of mechanisms related to orographically induced precipitation systems, examining factors such as low-level convergence, wind blocking (measured by the Froude number, Fr=U/Nh, where U is the averaged wind speed at altitudes less than that of the maximum terrain height, h is the maximum terrain height and N is the Brunt–Vaisala frequency), ambient wind direction and speed, terrain steepness and environmental stability induced by various sizes and shapes of terrains (Smith, Citation1979; Smolarkeiwicz et al., Citation1988; Smolarkeiwicz and Rotunno, Citation1989; Li et al., Citation1997; Olafsson, Citation2000; Chiao and Lin, Citation2003; Jiang, Citation2003; Petersen et al., Citation2003; Reeves and Lin, Citation2007; Houze, Citation2012; Xu et al., Citation2012).
Numerous theoretical studies have been conducted using numerical simulations to evaluate terrain-modified airflow around an isolated bell-shaped topography (Smolarkeiwicz and Rotunno, Citation1989; Smith and Grønås, Citation1993; Jiang, Citation2003). These studies have shown that the windward side of an isolated bell-shaped terrain is characterised by a convergence zone, with flow deceleration and reversal occurring on the windward slope of the terrain under low-Fr regimes. Consequently, an arc-shaped convergence zone forms by horizontal rerouting of flows at low altitudes, and a flow reversal characteristically occurs on the upslope part of the windward side of the terrain. Lee vortices, which are closely associated with gravity wave dynamics, form on the lee side of the terrain.
Smolarkeiwicz and Rotunno (Citation1990) showed that distinctive terrain-modified airflows appear around elliptically shaped terrains with lengths longer than those of the impinging rainfall systems, as the higher parts of the terrain have a shallower (and therefore longer) slope compared with terrains that are circular in a plan view (i.e., not elliptical). In a low-Fr regime, upslope flow reversals are absent, and the horizontal rerouting of the low-level flow converges with ambient flows on the lateral edges of the obstacle. The horizontally split flows on the windward side reunite on the lee side, generating leeward vortices. If the terrain is elliptically shaped, the effects of the terrain on the flow vary depending on the elongation direction of the terrain axis relative to the ambient flow direction. An elliptically shaped terrain with a short axis parallel to the ambient stream induces an elongated convergence zone, consisting of horizontal rerouting of flows and flow reversal on windward upslope located on the long axis of the obstacle. On lee-side downslopes, relatively large-scale vortices develop.
When a moist airflow encounters a mountainous area, the flow is affected by orographic lifting and blocking. The modified moist airflow may locally trigger cloud formation and precipitation. In a moist environment, a previously generated precipitation system approaching a mountainous region is significantly enhanced in the vicinity of the terrain due to flow modification. Although many studies have examined precipitation systems in mountainous regions, the effects of terrain on pre-existing precipitation systems approaching a terrain with a moist environment are relatively unexplored, and most previous studies have focussed on the Taiwan region (Lin et al., Citation1992; Jou and Deng, Citation1998; Chen et al., 2001; Wang et al., Citation2005; Reeves and Lin, Citation2007; Xu et al., Citation2012).
Previous studies have investigated the intensification of pre-existing convective systems on the Central Mountain Range (CMR; width, 120 km; length, 320 km; height, 4 km; extending southwest–northeast) of Taiwan (an isolated elliptically shaped terrain), under southwesterly monsoon flows dominant at low altitudes during the rainy season (May to mid-June) (Chen and Yu, Citation1988; Chen et al., Citation1991; Jou and Deng, Citation1992; Akaeda et al., Citation1995; Chen et al., Citation2001; Wang et al., Citation2005; Lai et al., Citation2011). Wang et al. (Citation2005) investigated the enhancement mechanisms of a north–south elongated pre-existing rainfall system approaching the northwestern side of the CMR with low Fr. The southern part of the system was significantly enhanced by convergence due to terrain blocking, resulting in heavy rainfall (nearly 200 mm in 2 hr) along the northwestern coast of the CMR. In the Taiwan region, the moist southwesterly monsoon flow and its modification by the terrain were found to significantly enhance the approaching rainfall system on the western side of the CMR; consequently, the highest rainfall accumulations in Taiwan have been recorded on the western slope of the terrain.
Similar to the Taiwan region, during the rainy season, southwesterly monsoon flows generated in East Asia encounter the southern side of stationary fronts, thus transporting high equivalent potential temperatures northeastward and creating an environment with strong horizontal moisture and wind-shear gradients (Chen and Yu, Citation1988; Jou and Deng, Citation1992). Such orographically intensified precipitation systems have been frequently observed around the oriented Jeju Island from west-southwest to east-northeast (; width, 35 km; length, 78 km; height, 1.95 km), southern Korea. Similar to the CMR terrain of Taiwan, an isolated elliptically shaped mountain is present on Jeju Island, and a southwesterly monsoonal flow prevails at low altitudes during the rainy season (June to mid-July). Despite the similarities between the two domains, some differences are also apparent, especially with respect to the orientations and horizontal scales of the terrains. On Jeju Island, the terrain is oriented from west-southwest to east-northeast, as compared with the orientation of Taiwan from southwest to northeast, and the horizontal scale of Jeju Island (width, 35 km; length, 78 km) is small compared with Taiwan. Thus, the barrier effect of the central mountain on Jeju Island may be smaller than that observed in the CMR of Taiwan. Prevailing southwesterly monsoonal flows have resulted in the highest recorded rainfall on Jeju Island, as rainfall systems are concentrated on the northern lateral side of the terrain. A few previous case studies on orographically enhanced rainfall systems on the northern side of Jeju Island are introduced in the following section.
Fig. 1 Location and elevation map of Jeju Island. The inner domain [the square in (a)] is considered in numerical experiments using a cloud-resolving storm simulator (CReSS) with 1.0 km resolution [shown in (b)]. The centre locations of initial warm bubbles (BNW and BW) for the experiments are depicted by cross symbols in (b).
![Fig. 1 Location and elevation map of Jeju Island. The inner domain [the square in (a)] is considered in numerical experiments using a cloud-resolving storm simulator (CReSS) with 1.0 km resolution [shown in (b)]. The centre locations of initial warm bubbles (BNW and BW) for the experiments are depicted by cross symbols in (b).](/cms/asset/9fd52227-b7ef-4269-9af7-b7f07235a2c7/zela_a_11817013_f0001_ob.jpg)
1.2. Studies on terrain effect of Jeju Island on rainfall
A few previous observational studies have been conducted on rainfall enhancement on Jeju Island (Lee et al., Citation2010, Citation2012); these studies investigated the development of pre-existing rainfall systems on the northern lateral side of the terrain. Lee et al. (Citation2010) analysed the mechanics of a rainfall system that showed localised intense rainfall around Jeju Island on 30 June 2006, using a single-Doppler radar dataset and the results of a numerical experiment. The pre-existing rainfall system moved eastward, approaching the western side of the island with prevailing southwesterly winds at low altitudes (Fr=0.55). The system quickly reached the western side of the island. As the system passed the northwestern side of the island, rainfall enhancement was significant due to flow blocking by the terrain (Lott and Miller, Citation1997) and the wind direction was modified to a south–southwesterly direction. Simultaneously, a portion of the southwesterly wind flowed over the terrain, inducing a downdraft region on the northeastern downwind slope and resulting in rainfall dissipation on the lee side. Thus, the lifetime of the rainfall system was relatively short.
The relatively long-lasting rainfall system on 6 July 2007 was analysed by Lee et al. (Citation2012) using a dual-Doppler radar dataset. The eastward-moving pre-existing system approached the northern side of the island. As the system approached the island, rainfall enhancement occurred off the northwestern shore of the island on account of local updrafts generated by accelerated southwesterly winds at low altitudes between the system and island. Onshore, the steep terrain of Jeju Island caused the relatively weak southwesterly flow (Fr=0.2) at low altitudes to flow around the terrain, generating two local updrafts, on the northern lateral and lee sides of the island. Consequently, the system passed over the northern side of the island, enhancing rainfall on the northern and lee sides of the island. The lifetime of this system was relatively long.
Lee et al. (Citation2010, Citation2012) revealed that: (1) a moist environment and southwesterly winds at low altitudes are well maintained when a stationary front is located off the northern shore of Jeju Island and (2) the isolated elliptically shaped terrain of Jeju Island induces a horizontal rerouting of low-level winds with relatively low Fr, generating a local updraft region on the northern lateral side of the island; thus rainfall is intensified on the lateral side of the island. Despite these similarities between the two studies, some differences are also apparent.
First, both previously studied rainfall systems moved eastward, but their arrival on the island differed in that: (1) the rainfall system in Lee et al. (Citation2012) landed on the northern side of the island and (2) the rainfall system in Lee et al. (Citation2010) landed on the western side of the island. The evolution of the systems as they approached the island was also different: (1) The rainfall system approaching the northern side of the island travelled off the northwestern shore before landing on the island. As the distance between the system and the terrain decreased, the southwesterly wind at low altitudes (<1 km) accelerated, generating a local updraft; the interaction between the terrain and the system seemed to establish a wall. Therefore, rainfall was enhanced off the northwestern shore of the island. Lee et al. (Citation2014) mentioned the important role of local updrafts on the northwestern shore of the island in generating an active warm-rain process below a freezing layer. (2) The rainfall system on the western side of the island did not enhance rainfall off the western shore of the island before it landed on the terrain. As the system approached the western shore, concentrated southwesterly winds and related updrafts were absent offshore. One of our working hypotheses is that rainfall enhancement results from the generation of local updrafts caused by terrain–system interactions, when a system is located off the northwestern shore of the island.
Second, the Fr in the environment of previously studied rainfall systems which was calculated in levels from surface to the mountain height (2 km) was dissimilar: Fr=0.55 (Lee et al., Citation2010) and Fr=0.2 (Lee et al., Citation2012). The related systems also evolved differently on the lee side of the island, from (1) rainfall dissipation on the northeastern downwind side (Lee et al., Citation2010), to (2) rainfall enhancement on the eastern side of the island (Lee et al., Citation2012). Theoretically, for large Fr (>1), the flow tends to induce a vertically propagating wave over an obstacle; as the Fr decreases, the vertical propagation of flow becomes to be weakened; a low Fr (<0.5), on the other hand, tends to induce intense clouds and a nearly horizontal detour of the flow around the obstacle (Smolarkeiwicz et al., Citation1988; Smolarkeiwicz and Rotunno, Citation1989, Citation1990; Yoshizaki et al., Citation2000). The terrain of Jeju Island in an environment of Fr=0.55 generates both horizontal and vertical rerouting of flows over the island. The vertical propagation generated a dry descending airflow on the northeastern downwind slope and a rapid dissipation of rainfall. When Fr is fairly low (Fr=0.2), horizontal rerouting of the flow prevails; thus the terrain-modified northwesterly winds from the northern island converge with southwesterly winds from the southern island. The related local updrafts on the lee side trigger enhanced rainfall. Our second working hypothesis is that an enhanced rainfall system is generated by terrain-induced local updrafts on the lee side of the terrain when Fr is fairly low.
Based on the results of previous studies (Lee et al., Citation2010, Citation2012), further investigations into factors that enhance pre-existing rainfall systems on the northern lateral and lee sides of Jeju Island are required to improve rainfall forecasts in this domain. The goal of the present study is to understand the effects of the isolated east–west oriented elliptical terrain of Jeju Island on the enhancement of pre-existing rainfall systems using idealised experiments, based on an examination of the hypotheses proposed above.
2. Numerical setup
Investigation of the terrain effect of Jeju Island on rainfall enhancement using numerical simulations requires a high-resolution analysis (<2-km grid). For this study, a cloud-resolving storm simulator (CReSS) with a 1-km resolution was used.
2.1. Model description
The CReSS is a 3-dimensional non-hydrostatic model developed at the Hydrospheric Atmospheric Research Center (HyARC), Nagoya University, Japan (Tsuboki and Sakakibara, Citation2002). The model employs compressible non-hydrostatic dynamics and no cumulus parameterisation and is designed to realistically simulate mesoscale systems at high resolutions using explicit cloud microphysics (see for a detailed description of the model; the CReSS model is comparable to the ARPS, MM5 and WRF models). Conformal map projection in the horizontal dimensions and a terrain-following curvilinear coordinate (ζ) in the vertical dimension are used, such that1 where zt
and zs
are model heights at the top and surface, respectively. With this coordinate system, the equations for 3-dimensional momentum, pressure and potential temperature (θ) are formulated, as described in detail by Tsuboki and Sakakibara (Citation2007). The equation set includes all types of waves, such as Rossby waves, acoustic waves and gravity waves. Final predicted variables are 3-dimensional wind components (u, v and w) and pressure and potential temperature perturbations (p′ and θ′) from the mean state, which is in hydrostatic equilibrium at the starting time of model integration.
Table 1. Specifications of CReSS
The CReSS model includes a bulk cold-rain parameterisation and a 1.5-order closure with a turbulent kinematic energy prediction (Tsuboki and Sakakibara, Citation2007). The microphysics prognostic variables are the mixing ratios of water vapour (qv ), cloud water (qc ), rain (qr ), cloud ice (qi ), snow (qs ), and graupel (qg ), and the number concentrations of cloud ice (Ni ), snow (Ns ) and graupel (Ng ). The microphysics is based on Lin et al. (Citation1983), Cotton et al. (1986), Murakami (Citation1990), Ikawa and Saito (Citation1991) and Murakami et al. (Citation1994). A two-moment cold-rain scheme is available in the CReSS; that is, microphysical processes of the CReSS include three basic categories of processes in both the liquid water and ice phases: (1) phase nucleation, (2) growth or evaporation by diffusion and (3) inter-particle collection.
Subgrid-scale turbulent mixing is parameterised using a 1.5-order closure with a turbulent kinetic energy (TKE) prediction (Tsuboki and Sakakibara, Citation2007). Downward long-wave radiation from the atmosphere is considered using the empirical formula of Kondo (Citation1976), which includes the effects of cloud and water vapour. Downward short-wave radiation absorbed by the ground is estimated by considering the reflection of solar radiation from the ground surface (surface albedo). Regarding land-surface schemes, non-dimensional bulk coefficients are expressed using the scheme of Louis et al. (Citation1981).
For numerical computation in CReSS, the Arakawa-C staggering grid and the Lorenz grid are used for discretisation in the horizontal and vertical, respectively. To improve computational efficiency, a mode-splitting technique (Klemp and Wilhelmson, Citation1978) is adopted to integrate acoustic mode terms (and gravity mode by option) using a smaller time step Δτ, and terms of all other modes using a larger time step. The leapfrog scheme with the Asselin time filter (Asselin, Citation1972) is used for time stepping, while the Crank–Nicolson scheme can be used to solve p’ and w implicitly in the vertical for small Δτ by option. Computational mixing is used to remove grid-scale noise. For parallel computing, data exchange between individual processing elements is performed by the Massage Passing Interface (MPI). While under continuous development, the CReSS model has been successfully applied to simulate cloud streets during a cold air outbreak (Liu et al., Citation2004), localised heavy rainfall (Tsuboki and Sakakibara, Citation2004) and terrain-forced heavy rainfall (Wang et al., Citation2005; Lee et al., Citation2010). For a more complete description of the formulation and different configurations and options of CReSS, see Tsuboki and Sakakibara (Citation2002, Citation2007).
2.2. Design for idealised experiments
The model setup for this study was as follows. The CReSS domain in the present study was set to 31.0°N–35.2°N, 124.0°E–128.5°E (b) with a 1.0-km horizontal grid size. A total of 69 levels were used in the vertical dimension, spaced at 150 m from the surface to 10.3 km; the total number of grid points was 400×400×69. The USGS GTOPO30 dataset with a horizontal grid spacing of approximately 1 km (for details, see http://www1.gsi.go.jp/geowww/globalmap-gsi/gtopo30/gtopo30.html) was used for depicting the terrain of Jeju Island (). The elliptically shaped Jeju Island spans 126.17°E–126.95°E (width, 78 km) and 33.19°–33.56°N (length, 35 km). An isolated mountain (Mt. Halla; height, 1950 m) is located in the centre of the island. The CReSS domain was defined so that Jeju Island is located at the centre of the domain (b). A wave-radiating boundary condition was applied at the lateral boundary. Each experiment was integrated for 3.5 hr, from 1200 local standard time (LST; LST=UTC+9 hr), using the bulk cold-rain microphysics with time steps of 3.75 s (large) and 1.25 s (small) with output every 5 min.
Considering the environmental conditions noted in the previous studies on enhancement mechanisms of rainfall systems around Jeju Island (Lee et al., Citation2010, Citation2012), the initial flow field in the present study was initialised using a pseudo-sounding derived analytically from the following parameters: air temperature (T), relative humidity (RH) and horizontal wind (u and v) (see Appendix for details). The environments were horizontally homogeneous at the start of the simulations. The maximum T and RH were set to 299 K and 90%, respectively, at the surface and were gradually decreased to 259 K and 50% at a height of 8.0 km, respectively (N=0.011 s−1). For simplicity, a constant sea surface temperature of 297 K, close to the climatological mean in the vicinity of Jeju Island during the rainy season, was used over the ocean. Homogeneous southwesterly winds prevailed below a height of 2 km. Control parameters in the present study were initial environmental wind speed at low altitudes (measured by Fr) and the initial location of the bubble (BIL); these parameters are summarised in . The speed of the southwesterly flow was designed in levels from surface to the mountain height (2 km) for three categories of Fr: 0.2, 0.4 and 0.55 (see ). Above 2 km, the horizontal wind gently was redirected to the westerly so that the generated rainfall system was directed towards the eastern side of Jeju Island.
Table 2. List of idealised experiments
To investigate the evolution of a pre-existing rainfall system induced by terrain-generated local updrafts on the northern lateral and eastern lee sides of the terrain, the pre-existing rainfall system was initiated with an elongated warm bubble having a maximum potential temperature perturbation of 2 K, based on the results of previous observational studies (Lee et al., Citation2010, Citation2012). The placement of a thermal bubble in a domain is a widely used method for initiating a convective motion that simulates a rainfall system (Frame and Markowski, Citation2006, Citation2010; Markowski and Dotzek, Citation2011). The horizontal and ordinate radii of the bubble were 10 and 22.5 km, respectively, over which the perturbation decreased to zero. The bubble was centred at a height of 2 km above the ground surface. The shape of the warm bubble (ellipsoidal, with a longer ordinate radius) and its size match the reflectivity patterns of rainfall systems observed by Doppler radar (Lee et al., Citation2010, Citation2012), before the rainfall systems reach the island. For BIL, two cases were considered: a bubble off the western shore (BW; 33.35°N, 125.85°E) and a bubble off the northwestern shore (BNW; 33.45°N, 125.85°E) of the island, separated by approximately 10 km (cross symbols in ). The longitude (125.85°E) of the initiated warm bubble was considered so that the rainfall system approaches on the island. Experiments without the warm bubble (no bubble, NB) were performed for the three Fr values to understand the terrain effect of the elliptically shaped steep topography of Jeju Island on dynamic fields.
3. Terrain effects on flow dynamics
The terrain effect of the elliptically shaped and topographically steep Jeju Island on dynamic fields around the island was investigated using three idealised numerical experiments (NB runs, without a bubble). The surface environment was identical in all experiments, having a surface RH of 90% and a temperature of 299 K; Fr was designed to be 0.2, 0.4 and 0.55 for the NB2, NB4 and NB5 runs, respectively (). No rainfall was generated in these runs. In this study, the simulation time (ST) is the time from the initiation of the experiment. An ST of 0100 was selected to understand the horizontal and vertical patterns of the horizontal and vertical winds, RH and convergence; similar results were obtained for the other time points.
3.1. Horizontal patterns
Horizontal distributions of horizontal wind, RH, convergence and downdraft at low altitudes in the NB2, NB4 and NB5 runs are shown in .
a shows a prevailing southwesterly wind (7 m s−1) off the southwestern shore of the island at a height of 500 m in the NB2 run. Relatively weakened southwesterly winds of 5 m s−1 were distributed on the western slope of the island. The southwesterly wind split into south–southwesterly and westerly winds on the northwestern and southwestern sides of the island, respectively (b); simultaneously, a high-RH (>88%) region developed in an arc shape surrounding the terrain (a) and convergences of 0.6×10⁻³ s−1 (cross symbols, b) developed on the northwestern side of the island below 1 km. Subsequently, the rerouted south–southwesterly wind on the northwestern side arrived on the northeastern side of the island as a weak westerly (6 m s−1), converging with the relatively strong southwesterly (12 m s−1) from the southern side of the island. As a consequence, a convergence developed on the eastern side of the island (b, eastern side of 126.6°E). Downdrafts (contours, b; −0.3 m s−1) were barely detected on the lee side of the terrain.
Fig. 2 Horizontal distributions of horizontal wind, relative humidity (RH), convergence and downdraft in the NB2, NB4 and NB5 runs at 0100 ST. The thick solid line and thin dashed lines in each panel represent the coastline and topography, respectively, of Jeju Island (contour interval, 200 m). The left panels (a), (c) and (e) show the horizontal wind field (arrows) and RH (in grey scale) at a height of 500 m. The right panels (b), (d) and (f) show the horizontal wind (arrows), the downdraft (contour intervals, 0.2 m s−1, from −0.3 m s−1) and maximum convergence (grey crosses and open circles represent convergences between 0.5×10⁻³ s−1 and 1.0×10⁻³ s−1, and greater than 1.0×10⁻³ s−1, respectively). The locations of the vertical 100-km long cross-sections shown in are indicated in (a), (c) and (e). Black dots on line A–B in (a), (c) and (e) are the midpoints (at 50 km) of the cross-sections, and represent the locations of the downward pointing arrows in each panel of .
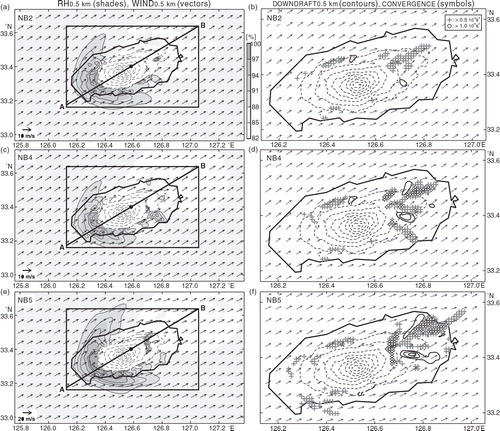
The horizontally rerouted low-level winds, the related local convergences and the arc-shaped high-RH region, which were identified in the NB2 run, were similarly apparent in the results of the NB4 run (c, d). Compared to the results of NB2 run, relatively strong southwesterly winds (8 m s−1) were dominant around the island (c). The southwesterly wind redirected to the south–southwesterly on the northwestern slope of the island at a height of 500 m, generating a local convergence of 0.7×10⁻³ s−1 (cross, d). On the eastern slope of the island (to the east of 126.6°E, d), the westerly (5 m s−1) and southwesterly (11 m s−1) winds converged, with a maximum convergence greater than 1.5×10⁻³ s−1 (open circles). At the same time, downdrafts (contours, d) stronger than −0.5 m s−1 were identified below 1 km on the eastern slope of the island.
In the NB5 run, relatively strong southwesterly winds (13 m s−1) prevailed toward the western part of the island (e), generating convergences of 0.7×10⁻³ s−1 on both the northwestern (cross symbols in f) and southwestern sides of the island. Corresponding to the relatively strong southwesterly winds, the arc-shaped RH region (RH>90%) expanded horizontally (e), as compared with that found in the NB2 and NB4 runs (a, c). High RH (>94%) was distributed on the western slope of the island and relatively strong downdrafts (<−0.8 m s−1) were apparent on the eastern slope of the island (to the east of 126.6°E) below 1 km (contours, f). Simultaneously, convergences of 1.6×10⁻³ s−1 (open circles) developed on the eastern side of the island.
summarises the experiments in which an initial bubble is absent from the simulation (NB2, NB4 and NB5); Cwest and Ceast (10−3 s−1) are the maximum intensities of the convergence on the island to the west and the east, respectively, of longitude 126.6°E; Weast (m s−1) is the maximum intensity of the downdraft on the island to the east of longitude 126.6°E.
Table 3. Summarised results of experiments without bubble: inter-model comparisons
3.2. Vertical patterns
A vertical southwest–northeast cross-section (A–B) was selected from the region depicted in a, c and e to illustrate the vertical structure of vertical winds and RH across the mountain on Jeju Island. The A–B transect is oriented parallel to the dominant low-altitude southwesterly wind.
Along the A–B transect in the NB2 run (a), a relatively weak updraft of 0.5 m s−1 was apparent on the southwestern slope of the island, in the region of the relatively weakened southwesterly wind (a, b). The related RH distribution is shown in b. A region of high RH (>90%) was concentrated at low altitudes on the southwestern slope of the island. The altitudes of the high-RH region at 10 km, 20 km, 30 km and 40 km from point A were 0.9 km, 1.1 km, 1.2 km and 1.9 km, respectively (b). Along the southwestern slope at 30–40 km, a region with a mixing ratio of cloud water of 0.4 g kg−1 was observed at altitudes below 1.2 km (not shown). A paired downdraft (light shade) and updraft (dark shade) region was located on the northeastern slope (a). At 50 km from point A, a thick downward arrow on the horizontal axis of each panel of is present, and a black circle on the A–B line is depicted in . As shown in a, a region of relatively intense updraft (>2 m s−1) is localised at 50–60 km along the transect on the northeastern slopes below altitudes of 2 km, at the location of convergence of the westerly and the southwesterly winds at low altitudes (a, b). The related high RH (>85%) was identified below altitudes of 2 km at 55–60 km along the transect (b).
Fig. 3 Vertical distributions of vertical velocity and relative humidity (RH) in the NB2, NB4 and NB5 runs at 0100 ST. The locations of the cross-sections are shown in a, c and e. The left panels (a), (c) and (e) depict the vertical velocity in grey scale. Regions of updraft stronger than 0.5 m s−1 and downdraft stronger than −0.5 m s−1 are contoured by solid lines and dashed lines, respectively, (contour interval, 0.5 m s−1). The right panels (b), (d) and (f) indicate regions of RH >70% in grey scale and the vertical velocity by contours (as in the left panel).
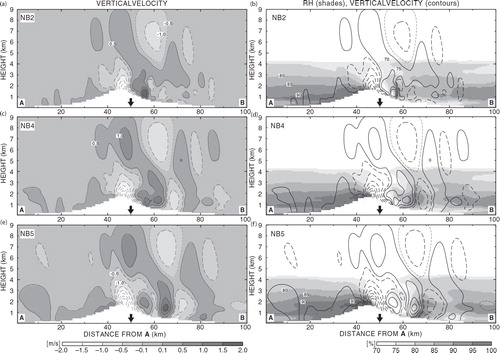
In the NB4 run (c), a relatively weak updraft of 0.5 m s−1 was distributed on the southwestern upslope, but relatively extended in the vertical direction as compared with that found in NB2 (a). The altitudes of the high-RH region (>90%) at 10 km, 20 km, 30 km and 40 km from point A were 1.0 km, 1.3 km, 1.9 km and 2.1 km, respectively (d); the region was relatively extended in the vertical direction as compared with that in the NB2 run (b). On the slope, at 25–35 km, a mixing ratio of cloud water of 0.5 g kg−1 was distributed at altitudes below 2 km (not shown). On the crest, the downdraft was relatively intensified (<−3.0 m s−1) and it extended to the northeastern slope of the island. Two pairs of updraft–downdraft regions developed on the northeastern downstream (c, d). At low altitudes, relatively strong updrafts (1.5 m s−1) and the relatively high RH region (>85%) were located at 55–65 km and 60–70 km, respectively (c, d).
Further strengthening of updrafts was observed on the southwestern slope in the NB5 run (e). An updraft stronger than 1 m s−1 was identified at 1–2 km heights at 35–45 km along the transect. The altitudes of the high-RH (>90%) region at 10 km, 20 km, 30 km and 40 km from point A were extended to 1.0 km, 2.1 km, 2.1 km and 2.5 km, respectively (f). On the southwestern slope, at 25–40 km, a relatively large mixing ratio of cloud water of 1.0 g kg−1 was identified below an altitude of 2 km (not shown). Simultaneously, the relatively high RH (>95%) region was distributed at heights of 1.5–2.2 km at 35–45 km. Related to the intensified updrafts on the southwestern slope, a relatively intense downdraft of −3.5 m s−1 developed and propagated further to northeast downstream, breaking the updraft region at around 60 km. Intense updrafts (2 m s−1) were concentrated at low altitudes at 60–70 km. Similarly to the patterns in the NB2 and NB4 runs (b, d), a relatively high RH (>85%) region was localised on the northeastern side of the island, but farther to the northeast, downstream (63–75 km, f).
4. Terrain effect on rainfall system
Terrain-generating local updrafts/downdrafts are one of the major factors in the evolution of rainfall systems in mountainous regions. This section focuses on the effects of terrain-induced flow fields (specifically, the three types of horizontal and vertical flow fields; see Section 3) on the evolution of a rainfall system (e.g., intensity variations and duration). Furthermore, to understand how the landing location of the system on the terrain affects the system's evolution as its approaches the terrain, two categories of system-passage regimes were investigated: BNW and BW (b and ). In this study, the qr region is the area over which the mixing ratio of rain water (qr ) is >1 g kg−1; the qr region corresponds to the region of predicted rainfall. The generated rainfall system in the experiment with the warm bubble is assumed to propagate under the control of the initiated wind field.
4.1. BNW experiments
4.1.1. Rainfall distributions.
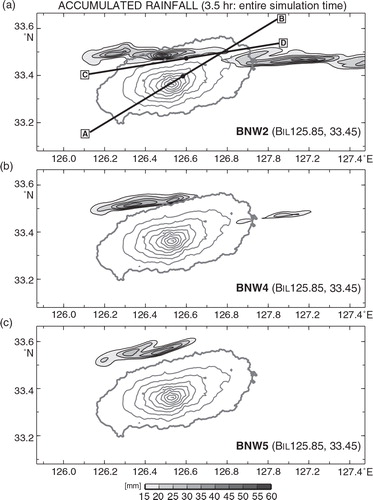
Three experiments with varying flow regimes were conducted in which the initial warm bubble was located off the northwestern shore of the island (BNW2, BNW4 and BNW5). The distributions of accumulated rainfall in each experiment are shown in .
In BNW2 (a), regions with accumulated rainfall >15 mm over 3.5 hr were located on the northern and the eastern sides of the island. Among the three runs, the most intense rainfall accumulation (53 mm) in the broadest rainfall region (126.08°E–127.5°E) was in the BNW2 run. In the 4th quadrant domain of a (33.4°N–33.6°N, 126.0°E–126.7°E), two regions of intense rainfall (>30 mm) occurred off the northwestern and northern sides of the island. In BNW4 (b), the maximum accumulated rainfall of 37 mm occurred off the northwestern shore, with the intense rainfall (>30 mm) off the northwestern shore and near the northern coast of the island. In BNW5 (c), the maximum accumulated rainfall (31 mm) was distributed off the northern shore of the island. Relatively narrow regions of rainfall (>15 mm) occurred in BNW4 in the region 126.12°E–126.65°E and in BNW5 in the region 126.16°E–126.63°E, as compared with those shown in BNW2 (a).
Fig. 4 Accumulated rainfall during the 3.5-hr simulation in the (a) BNW2, (b) BNW4 and (c) BNW5 runs. Contour interval, 5 mm, starting from 15 mm. Thick and thin solid lines in each panel depict the topography of Jeju Island (contour interval, 200 m). The locations of the vertical transects A–B and C–D in Fig. 7a, c and d are indicated in (a). Black dots on the transects in (a), which are the midpoints on the transects, located at 50 km on transect A–B and 43 km on transect C–D, represent the locations of the downward pointing arrows in each panel of .
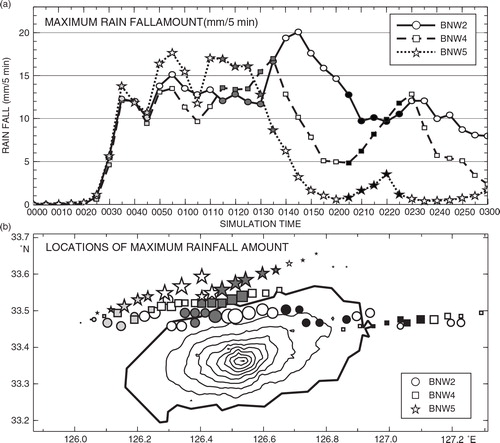
The accumulated rainfall (mm) for the previous 5 min, in 5-min intervals from the initial state of the simulation, is depicted in . Rainfall for the BNW2, BNW4 and BNW5 runs begins off the northwestern shore of the island after 0025 ST. In the BNW2 run, during the period 0130–0145 ST, an increase of the maximum rainfall amount from 11.8 to 20.1 mm was observed. Subsequently, during the period 0210–0235 ST, the maximum rainfall amount decreased to 10 mm, but then increased to 12 mm on the eastern side of the island. Thus, the duration of the maximum rainfall amount exceeding 5 mm per previous 5 min was 150 min, which was the longest rainfall lifetime among the experiments in this study. In the BNW4 run, the maximum rainfall amount was located close to the northern coast of the island, where a maximum rainfall amount of 16.9 mm was recorded along 126.53°E at 0135 ST. From 0135 ST, the rainfall amount decreased rapidly to 5 mm; therefore, the duration of rainfall amounts >5 mm for previous 5 min was 80 min. During the period 0215–0230 ST, off the eastern shore of the terrain, an increase in rainfall was apparent; the increase seems to have been induced by a gravity wave aloft in a region of relatively moist environments at low altitudes, a condition which is similar to that reported by Jiang (Citation2003). In the BNW5 run, maximum rainfall intensities appeared offshore from the northern end of the island. The rainfall reached a 5-min maximum of 17.7 mm offshore the northwestern end of the island (33.56°N, 126.3°E) at 0055 ST. The maximum rainfall amount rapidly decreased offshore from the northeastern end of the island after 0120 ST.
Fig. 5 Temporal variations in rainfall amount in the BNW2, BNW4 and BNW5 runs: (a) Time variation of the maximum accumulated rainfall amount (rainfall per 5 min) for the BNW2, BNW4 and BNW5 runs are depicted with solid, dashed and dotted lines, respectively. (b) The locations of maximum rainfall amount for the BNW2, BNW4 and BNW5 runs are represented as shaded circles, squares and stars, respectively. The grey shading of the symbols represents the time period and is changed every 25 min from 0025 ST; during the periods 0025–0045 ST and 0115–0135 ST, the symbols are shaded light and dark grey, respectively. During the period 0205–0225 ST, the symbols are shaded black. The size of each symbol is weighted to show the amount relative to maximum values. Thick and thin solid lines in (b) depict the topography of Jeju Island (contour interval, 200 m).
4.1.2. Evolution of rainfall systems.
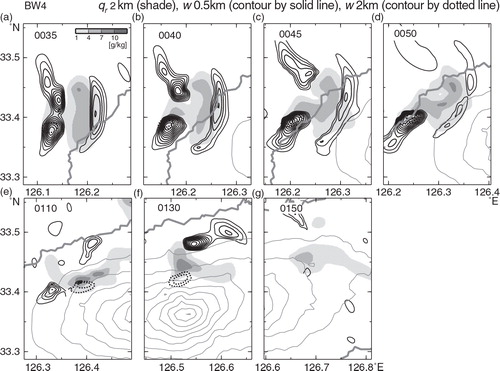
To understand the evolution of the system in detail, the horizontal distributions of updrafts (w) and the mixing ratios of rain water (qr ) are represented in for BNW2. A height of 2 km was selected for examining the horizontal distribution of qr , and for comparisons of observed reflectivity patterns determined in this and previous studies (Lee et al., Citation2010, Citation2012, Citation2014); the 2-km height is suitable for understanding the reflectivity distribution in the mountainous region of Jeju Island. A height of 500 m was selected for observing the terrain-generated local updrafts, as these features are readily observed at this height. To illustrate the vertical structure of vertical winds and RH in the BNW2 run, vertical cross-sections were constructed along transects A–B and C–D (). The locations of the transects are shown in a. The A–B transect is oriented parallel to the prevailing low-altitude southwesterly winds, as shown in . The C–D transect is oriented along the passage of the rainfall system.
Fig. 6 Horizontal distributions of the mixing ratio of rain water (qr , in grey scale) at a height of 2 km and the updraft (w, contours) at a height of 500 m in the BNW2 run: (a)–(e) at 5-min intervals during the period 0035–0055 ST; (f)–(h) at 10-min intervals during the period 0105–0125 ST; and (i)–(l) at 10-min intervals during the period 0140–0210 ST. Regions of w>0.3 m s−1 are contoured by solid lines (contour interval, 0.2 m s−1). Regions of qr >1 g kg−1 are shaded in grey scale (shade interval, 3 g kg−1). The thick and thin grey contour lines represent the coastline and the topography, respectively, of Jeju Island (contour interval, 200 m).
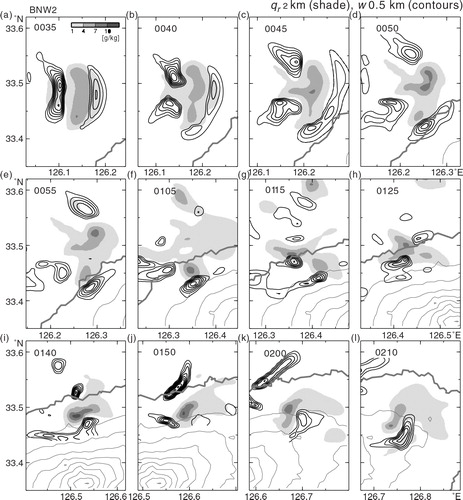
A qr region is located off the northwestern shore of the island from 0035 to 0050 ST (a–d); the horizontal distributions of qr and updrafts are shown every 5 min (). The horizontal distributions of qr and updrafts are shown every 10 min during the passage of the qr region over the northwestern island from 0055 to 0125 ST (e–h) and over the northeastern island from 0140 to 0210 ST (i–l). As shown in a, an elongated qr region (oriented south–north) with a maximum qr =7 g kg−1 was located along longitude 126.15°E at 0035 ST. Updrafts of 0.9 and 1.7 m s−1 are located to the east and west of the qr region, respectively, at the 500 m height. As the horizontal area of updrafts is expanded from 500 m to higher altitudes, the qr region observed at a height of 2 km is hardly corresponded to the updrafts at a height of 500 m. The thick grey contour in indicates the coastline of Jeju Island. During the period 0035–0050 ST (a–d), the qr region approaches near to the island. At 0040 ST (b), two regions of updrafts with velocities >0.5 m s−1 occur in the eastern (33.44°N–33.52°N) and southern (33.41°N) parts of the qr region. At 0045 ST (c),the updraft in the southern part of the qr region intensified to velocities of >1.1 m s−1 between the qr region and the island by 0050 ST (d); in contrast, the updraft in the eastern part of the qr region was hardly distributed at the 500 m height. Subsequently, the updraft further intensified (1.3 m s−1) in the qr region, and the qr region intensified on the northwestern island during the period 0050–0105 ST (d–f). Along transect C–D (a), at 0110 ST, the rainfall system was characterised by an updraft of >6 m s−1 and high RH (>95%), located on the northwestern slope at 20–30 km, at altitudes below 8.5 km. Simultaneously, on the northeastern side of the terrain, high RH (95%) was distributed at 40–60 km along transect C–D (a), and an updraft occurred at 50–60 km along transect A–B (1.5 m s−1; c). During the period 0105–0125 ST (f–h), region of high qr (>4 g kg−1) moved on the northwestern side of the island, and intensified updrafts >1.1 m s−1 occurred in the region 126.3°E–126.43°E on the southern part of the high qr region. At 0140 ST (i), a qr >7 g kg−1 is apparent on the northern side of the island. An intense elongated updraft (>1.1 m s−1) related to the intense qr developed along the latitude (33.46°N) on the northern side of the island (i). At 0150 ST (j), a relatively intense updraft region (>1.1 m s−1) was continuously present on the northern side of the island (126.55°E). Along transect A–B (d), at 0200 ST, the rainfall system was characterised by an intensified updraft of >4 m s−1, located on the northeastern slope of the terrain at 60–70 km, from the surface to a height of 6.5 km. During the period 0150–0210 ST (j–l), the low-level updraft (>1.1 m s−1) gradually intensified ahead of the qr region (j–l). Subsequently, during the period 0210–0235 ST (a–b), the maximum rainfall amount increased to 12 mm/5 min on the eastern side of the island.
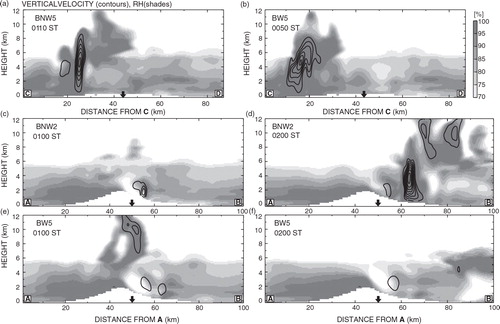
Fig. 7 Vertical distributions of vertical velocity (contours) and relative humidity (RH, shading). (a), (b) Updrafts stronger than 1.0 m s−1 along transect C–D are contoured by solid lines (contour interval, 1.0 m s−1). (c)–(f) Along transect A–B, updrafts stronger than 0.5 m s−1 are contoured by solid lines (contour interval, 0.5 m s−1) and values of RH >70% are depicted in grey. The locations of transects A–B and C–D are shown in a for the BNW2 run and in c for the BW5 run. The midpoints along transects A–B and C–D are represented by thick downward arrows on the horizontal axes of each panel.
In the BNW4 run, the rainfall system, with relatively strong southwesterly winds (8 m s−1; not shown), passed close to the northern coast of the island. An elongated qr region (oriented south–north, maximum qr =4 g kg−1) moved eastward during the period 0035–0045 ST. Simultaneously, updrafts on the eastern side of the qr region gradually extended to the southern side of the qr region, off the northwestern shore of the island. During the period 0050–0110 ST, as the qr region approached closer to the northern side of the island, a relatively high-qr region (>7 g kg−1) simultaneously developed adjacent to the northern coast of the island, and on the northern slope, another updraft developed at low altitudes along 33.46°N; the updraft region (>1.1 m s−1) had intensified and was continuously elongated along the northern side of the island. In the BNW4 run, the generated qr region, with relatively intensified environmental winds at low altitudes, passed off the northern shore of the island (not over the intensified updraft region (1.5 m s−1) on the northern lateral side). Subsequently, the qr region showed rapid dissipation as it moved to the northeastern side of the island. Simultaneously, local updraft of 0.5 m s−1 was apparent on the northeastern side of the terrain (33.5°N, 126.7°E). A similar evolution of the generated qr region was observed in the BNW5 run (not shown). The qr region in BNW5 passed offshore from the northern end of the island with strong southwesterly winds (13 m s−1). During the passage of the qr region (0040–0100 ST), updrafts were further intensified between the qr region and the island (126.2°E–126.4°E). Subsequently, at 0110 ST, relatively intensified qr values of >7 g kg−1 were present offshore from the northern end of the island along 126.45°E. Simultaneously, on the northern side of the island, an elongated region of updrafts of >0.5 m s−1 was observed by 0130 ST. After the qr region passed offshore of the northeastern end of the island, the qr values weakened.
4.2. BW experiments
4.2.1. Rainfall distributions.
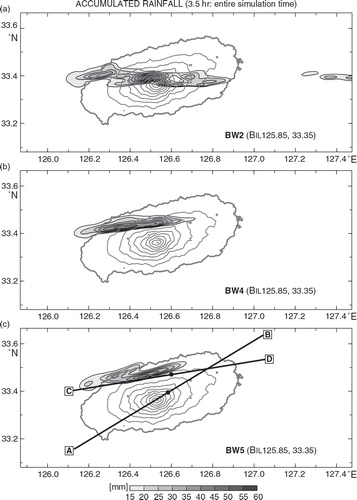
Three experiments (BW2, BW4 and BW5) were initiated with a warm bubble located off the western shore of Jeju Island at 33.35°N, 125.85°E, located 0.1° south of the BNW runs (, b). The distributions of the accumulated rainfalls in the BW runs are shown in . In the BW2 run (a), the accumulated rainfall greater than 15 mm over 3.5 hr was distributed across the central island in the range 33.35°N–33.45°N, 126.08°E–126.88°E. The maximum rainfall of 60 mm was located near the mountain crest. In the region of 33.3°N–33.5°N, 126.0°E–126.6°E (a), intense rainfall (>30 mm) occurred on the western side of the island (126.2°E–126.32°E) and on the mountain crest. In the BW4 run, rainfall was more pronounced on the northern side of the island (33.38°N–33.48°N, 126.13°E–126.7°E) (b), than was predicted in the BW2 run, showing a maximum accumulation of 44 mm on the northwestern slope of the island. In the BW5 run (c), a region of rainfall accumulation >15 mm was located in the region 33.4°N–33.53°N, 126.16°E–126.66°E, with a maximum rainfall of 42 mm on the northern slope of the island.
Fig. 8 Accumulated rainfall amount for 3.5 hr of the entire simulation time in (a) BW2, (b) BW4 and (c) BW5 runs. Contour interval is 5 mm starting from 15 mm. Thick and thin solid lines in each panel depict the topography of Jeju Island (interval: 200 m). The locations of the vertical transects A–B and C–D in b and 7e–f are indicated in (c). Black dots on the lines in (c) showing the midpoints of transect A–B at 50 km and of transect C–D at 43 km represent the locations of the downward pointing arrows in each panel of . Black dots on transect A–B and C–D in (c) are the midpoints of the transects and represent the locations of the downward pointing arrows in each panel of .
The accumulated rainfall (mm) for the previous 5 min, in 5-min intervals from the initial state of BW2, BW4 and BW5 runs, are depicted in . As shown in a, rainfall developed in all three runs, starting at 0025 ST. In the BW2 run, multiple locations of maximum rainfall are distributed across the island (circles, b). During the period 0110–0145 ST (b), the locations of maximum rainfall were distributed on the western slope (approximately 15 mm); then, at 0150 ST, a maximum rainfall of 19.2mm occurred on the crest of the mountain. Until 0220 ST, the maximum rainfall of approximately 15mm was distributed on the southeastern slope; thus, in the BW2 run, the duration of rainfall with amounts of >5mm was 130 min. In the BW4 run, the rainfall system passed on the northwestern slope of the island (rectangles, b), with southwesterly winds of 8 m s−1. During the period 0050–0130 ST, the regions of maximum rainfall were on the northwestern island (b), where terrain-induced updrafts were concentrated at low altitudes (d). Simultaneously, the maximum rainfall gradually increased from 13 to 18mm (a). At 0130 ST, a maximum rainfall of 18.6mm occurred on the northern slope of the island, near 33.44°N, 126.5°E. After 0140 ST, rainfall decreased dramatically on the eastern slope of the island; thus, in the BW4 run, a rainfall of >5mm was maintained for 90 min. Similar to that observed in the BNW2 run (circles, ), the rainfall system in the BW5 run (stars, b) passed on the northern side of the island, but the winds in the BW5 run were relatively strong (13 m s−1). At 0120 ST, the maximum rainfall of 19.2mm occurred on the northern slope of the island (33.48°N, 126.5°E) (b); the rainfall system diminished rapidly from 0130 ST as it passed along the northeastern slope. Therefore, in the BW5 run, the duration of maximum rainfall of >5mm was 70 min.
Fig. 9 Temporal variations in rainfall amount in the BW2, BW4 and BW5 runs: (a) Time variation of the maximum accumulated rainfall amount (rainfall per 5 min) for the BW2, BW4 and BW5 runs are depicted with solid, dashed and dotted lines, respectively. (b) The locations of maximum rainfall amount for the BW2, BW4 and BW5 runs are represented as shaded circles, squares and stars, respectively. The grey shading of the symbols represents the time period and is changed every 25 min from 0025 ST; during the periods 0025–0045 ST and 0115–0135 ST, the symbols are shaded light and dark grey, respectively. During the period 0205–0225 ST, the symbols are shaded black. The size of each symbol is weighted to show the amount relative to maximum values. Thick and thin solid lines in (b) depict the topography of Jeju Island (contour interval, 200 m).
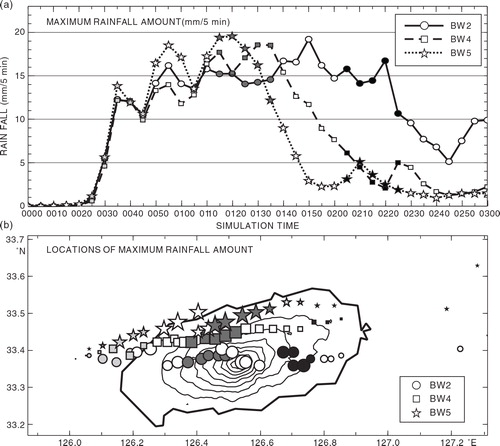
Fig. 10 Horizontal distributions of the mixing ratio of rain water (qr , in grey scale) at a height of 2 km and the updraft (w, contours) at a height of 500 m in the BW4 run: (a)–(d) at 5-min intervals during the period 0035–0050 ST; and (e)–(g) at 20-min intervals during the period 0110–0150 ST. Regions of w>4 m s−1 at a height of 2 km are contoured by dotted lines (contour interval, 2 m s−1). The shaded and contoured regions are as in .
4.2.2. Evolution of rainfall systems.
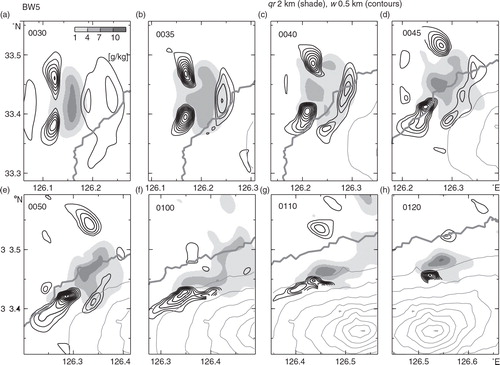
The horizontal distributions of updrafts at a height of 500 m and the mixing ratios of rain water (qr ) at a height of 2 km are illustrated in and 11 for the BW4 and BW5 runs, respectively. As the rainfall system passed at relatively high altitudes in the BW4 run, the updrafts (dotted contour lines with intervals of 2 m s−1, from 4 m s−1) at a height of 2 km are also illustrated.
In the BW4 run, the rainfall system passed on the northwestern slope of the island. shows the horizontal distributions of qr and updrafts at 5-min intervals. At 0035 ST (a), the qr region was located along longitude 126.18°E. During the period 0035–0050 ST (a–d), the qr region moved to the northwestern side of the island, with updrafts forming ahead of the qr region. At 0050 ST (d), the qr region was apparent on the northwestern island in the region 126.25°E–126.37°E, including intense qr (>7 g kg−1). Ahead of the eastward-moving qr region, in the area of terrain-modified moist south–southwesterly winds (c), an updraft of 0.5 m s−1 was distributed at a height of 500 m. During the period 0130–0150 ST (f, g), the qr region moved further east to the area of dry descending air (c, d). Subsequently, the qr intensity decreased to 5 g kg−1, without passing the intense low-level updraft of 1.7 m s−1 on the northern side of the island in the region 126.52°E–126.65°E (f).
Similar to what was observed in run BNW2 (circles, ), the rainfall system in BW5 passed on the northern side of the island (stars, b). shows the horizontal distributions of qr and updrafts in BW run. To illustrate the vertical structure of vertical winds and RH observed in the BW5 run, the vertical transects A–B and C–D were selected from the region depicted in c. The A–B transect is oriented parallel to the prevailing low-altitude southwesterly winds, as shown in . The C–D transect is oriented along the passage of the rainfall system. During the period 0030–0050 ST (a–e), the qr region landed on the northwestern side of the island, with an updraft (0.7 m s−1) developing ahead of the qr region. During the period 0045–0050ST (d, e), a relatively intense updraft exceeding 0.7 m s−1 was identified in the southern part of the qr region, where the terrain-modified south–southwesterly winds converged with the southwesterly winds (e, f). At 0050 ST, along transect C–D (b), the generated rainfall system was located on the northwestern slope of the terrain at 10–23 km, with updrafts of >6 m s−1; on the northern side of the terrain, at 25–40 km, a high-RH region (>90%) was distributed ahead of the rainfall system below an altitude of 4 km. During the period 0100–0110 ST (f, g), the qr intensified to >9 g kg−1 on the northern side of the island, and a low-level intense updraft of >1.3 m s−1 developed in the southern part of the qr region (126.35°E–126.48°E). At 0130 ST (not shown), the qr region located on the northeastern side of the island was dominant at low altitudes, in a region of low RH and downdrafts (e, f), showing the dissipation in qr intensity. Along transect A–B (f), at 0200 ST, when the system was located off the northeastern shore of the island, the dissipated rainfall system apparent at 80–100 km was a dry region (RH<70%) at altitudes below 4 km and a wet region (RH>95%) at altitudes of 4–6 km.
Fig. 11 Horizontal distributions of the mixing ratio of rain water (qr , in grey scale) at a height of 2 km and the updraft (w, contours) at a height of 500 m in the BW5 run: (a)–(e) at 5-min intervals during the period 0030–0050 ST; and (f)–(h) at 10-min intervals during the period 0100–0120 ST. The shaded and contoured regions are as in .
The qr region generated in the BW2 run landed on the northwestern side of the island in an area of moist and weak southwesterly winds (similar to those that prevailed in the NB2 run, not shown). The related updraft region (>0.5 m s−1) was elongated along the northwestern side of the island. At 0050 ST, a region of intense qr (>4 g kg−1) was distributed on the northwestern side of the island. Relatively intense low-level updrafts 1.1 m s−1 were apparent on the western side of the island, in a region of moist southwesterlies (a). At 0100 ST, an intensified qr region with relatively intense updrafts (>2 m s−1) was apparent on the western upslope at a height of 2 km. During the period 0100–0200 ST, the qr region travelled from the western to the eastern slope of the terrain, where prevailing southwesterly winds with high RH (>94%) were observed.
summarised the experiments which were initiated with a warm bubble present off the western shore and off the northwestern shore (i.e., the BW and BNW runs); Pmax (mm/5 min) is the maximum rainfall amount; Lpmax (°N, °E) is the location of Pmax; Awest and Aeast (km2) represent the horizontal area of accumulated rainfall exceeding 20 mm to the west and east, respectively, of longitude 126.6°E; Drain (min) is the duration of rainfall intensities exceeding 5 mm/5 min; and OCwest and OCeast represent whether the rainfall system passes over the convergence zone on the western and eastern sides, respectively, of longitude 126.6°E.
Table 4. Summarised results of experiments with bubble: inter-model comparisons
5. Discussion
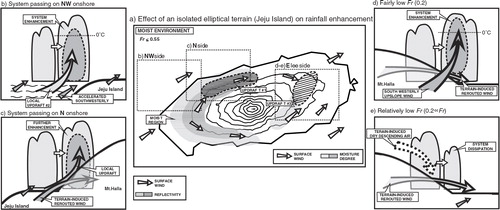
The Discussion focuses on the extent to which our results confirm our initial hypotheses, namely that (1) rainfall systems are enhanced in advance of their arrival onto a terrain (Jeju Island) when the system approaches towards the northern side of the island and (2) rainfall systems are enhanced on the lee side of an island in the case of fairly low Fr. is a 3-dimensional schematic illustrating the effects of terrain (Jeju Island) on the modification of prevailing winds, the formation of related updrafts and downdrafts, and the corresponding evolution of a rainfall system, based on the results of the present study and discussions of the results of previous studies (Lee et al., Citation2010, Citation2012, Citation2014). A discussion of rainfall enhancement in advance of the arrival of the rainfall system on the terrain is presented in Section 5.1. A discussion of rainfall enhancement on the lee side of the terrain is presented in Section 5.2.
Fig. 12 Schematic diagram showing the effects of an isolated elliptically shaped terrain on the distribution of surface moisture and the evolution of rainfall systems in the vicinity of the terrain. (a) Distributions of surface wind (white arrows), moisture content (shading) and updrafts (hatched areas). (b) Terrain-induced rainfall enhancement off the northwestern shore of the terrain. (c) Terrain-induced rainfall enhancement on the northern lateral side of the terrain. (d) Terrain-induced rainfall enhancement on the lee side of the terrain. (e) Terrain-induced rainfall dissipation on the lee side of the terrain. The thick solid line in each panel indicates the topography of Jeju Island. The grey arrows in (b)–(e) indicate low-level winds.
5.1. Enhancement of pre-existing rainfall system on shore
Enhancement of rainfall systems prior to their arrival on a terrain was identified in the results of BNW runs but not in the results of BW runs. The rainfall systems in BNW runs passed off the northwestern shore of the island, while the rainfall systems in BW runs passed off the western shore of the island, shortly landing on the western side of the island.
In both the BNW2 and BNW4 runs, rainfall systems approached the northern side of the island and rainfall enhancement occurred on the northwestern shore of the island. As the distance between a pre-existing rainfall system and Jeju Island decreased, low-level southwesterly winds became concentrated in the region between the rainfall system and the island, resulting in local updraft #2 (b); this pattern was common to both the BNW2 and BNW4 runs. This result is consistent with that of a previous study (Lee et al., Citation2012, Citation2014), which was based on detailed dual–Doppler radar data analyses. Lee et al. (Citation2014) concluded that the concentrated southwesterly winds and the generation of an updraft region between the rainfall system and Jeju Island are crucial for rainfall enhancement during the approach stage; they emphasised that the warm moist updraft region between the system and the island intensifies warm rain below the freezing layer. The locally generated updrafts between a rainfall system and a terrain were similarly investigated by Wang et al. (Citation2005). In their study, southwesterly winds prevailed offshore of the isolated elliptically shaped mountainous region of Taiwan (oriented southwest–northeast) during the rainy season. The approach of a convective line toward the northwestern shore of the island, with an Fr of 0.25, accelerated the southwesterly winds, which were blowing parallel to the coastline, and generated a localised updraft region between the southern edge of the convective line and the high terrain of the island. As a result, the southern part of the convective line intensified significantly, particularly as compared with the northern part. Although the horizontal scale of Jeju Island is small compared with Taiwan, the low Fr values, the acceleration of southwesterly winds blowing parallel to the coastline, and the generation of an updraft region between the precipitation system and the mountainous terrain are common elements to both locations. As an elongated rainfall system approaches an elliptically shaped terrain, the southwesterlies between the system and the terrain accelerate; rainfall is thereby enhanced, both in the approaching rainfall system and onshore, in advance of the arrival of the rainfall system on the terrain. This pattern of enhancement seems strongly related to the shape of the terrain. Jeju Island is oriented from west-southwest to east-northeast, and Taiwan is oriented from southwest to northeast; thus, low-level southwesterlies can flow parallel to the northwestern coastline of both islands. The results of the present study and the related discussions of previous studies emphasise the importance of the shape and orientation of a terrain with respect to prevailing low-level wind directions on the evolution of a pre-existing rainfall system on shore.
In the BNW2 run, the enhanced rainfall system subsequently arrived on the northern side of the island at the updraft area #1 (a, c), that was conducted by terrain-modified go-around air flow (i.e., the flow of air around, rather than over, Mt. Halla; Fig. 12a) (Cwest=0.6×10⁻³ s−1, ). As a result, rainfall accumulation on the northern side of the island (Pmax=20.1 mm/5 min, ) were greater than those predicted in any of the other experiments.
In both the BW4 and BW5 runs, the rainfall systems arrived shortly on the western side of the island. As the systems approached the island, local updrafts (such as those developed in the BNW2 and BNW4 runs) were barely apparent; thus, no rainfall enhancement resulted. Subsequently, the rainfall systems moved from the western to the northern side of the island, with southwesterly winds at low altitudes. As the system passed over local updraft #1 on the northwestern island (a, c; Cwest=0.7×10⁻³ s−1, ), flow blocking caused significant rainfall enhancement. The results show that the maximum rainfall amount was greatest on the northern side of the terrain in the BW4 and BW5 runs, exceeding that in the BNW4 and BNW5 runs in which the rainfall system passes offshore from the northern part of the terrain. Though low-level wind speeds in BW4 and BW5 were stronger than those of BNW2, the continuously generated flow blocking induces separation (a) of relatively weak winds at low altitudes; the upper part of the low-level flow goes over the terrain and generates gravity waves, as similarly reported by Lott and Miller (Citation1997). This wind pattern is consistent with that of a previous case study by Lee et al. (Citation2010), who reported the important role of the isolated steep terrain on Jeju Island in generating moist convergence on the lateral side of the island when southwesterly winds with relatively low Fr prevailed. To improve our understanding of the evolution of a pre-existing rainfall system on shore, it would be necessary to confirm the effects of friction differences between land and sea surfaces on rainfall enhancement near the coastline.
5.2. Enhancement of rainfall system on lee side
The role of basic-state flow on the enhancement of rainfall systems on the lee side of the isolated elliptically shaped terrain of Jeju Island has been noted by Lee et al. (Citation2012) and has been confirmed in this study, especially by the comparisons of the experimental results of runs BNW2 and BW5. The rainfall systems in both BNW2 and BW5 show similar path from the northern to the northeastern lee side of the island, but the evolution of the systems is distinct.
The most intense rainfall over the broadest region occurred in the BNW2 run, not only lateral to (Awest=150 km2, ), but on the lee side (Aeast=173 km2) of the island. The previously enhanced rainfall system moved further to the east, without dissipating on the northeastern downwind slope. As shown in the NB2 run, a weak dry descending air mass was generated near the crest of the mountain. The absence of dry descending air on the downstream side allowed the rainfall system to reach local updraft #3 (a); therefore, rainfall was enhanced on the lee side. The enhanced rainfall was induced by the local updraft and the convergence (Ceast=0.9×10⁻³ s−1 at 33.43°N, 126.7°E; ) of the go-around northwesterly wind (d) from the northern island with the southwesterly wind from the southern slope. The southwesterly wind from the southern island was relatively strong, which transported a plentiful supply of moist air to the updraft region on the eastern slope. Lee et al. (Citation2014) reported that relatively strong southwesterly upslope winds play a role in transporting low-level moist air above the freezing layer, thus enhancing cold hydrometeors. Smolarkeiwicz and Rotunno (Citation1990) investigated the terrain effect of an elliptical terrain with longer length along stream on the flow modification in a dry environment, and they showed that in a low-Fr regime, the terrain-induced convergence is generated over the lee side of the terrain. The local updraft on the lee side of Jeju Island, which is oriented approximately west-southwest to east-northeast, is apparent when southwesterly winds prevail at low altitudes (below 2 km). As the southwesterly winds from the southern island (Fr=0.2) contain moist air and blow over the gentle southeastern slope of the terrain, the local updraft generated on the lee side supplies moist air to higher altitudes from lower altitudes, which causes the pre-existing rainfall system to intensify over the lee side of the elliptically shaped terrain of Jeju Island. Jiang (Citation2003) found that rainfall generated on the lee side of an isolated circular-shaped terrain in a high-Fr regime was related to a gravity wave aloft, rather than to low-level wind convergence: no rainfall generated on the lee side of a circular-shaped terrain in a low-Fr regime. Thus, these results show that southwesterly winds blowing parallel to the long axis of an elliptic terrain (Jeju Island) in a low-Fr regime play an important role in rainfall enhancement on the lee side of the terrain.
In the BW5 run, very little rainfall occurred on the lee side of the island (Aeast=8 km2, ). This result is critically related to the intensification of dry descending air (Weast=−0.8 m s−1, ; e) in the downwind side of northeastern island. Because of the intensely dry descending air, the terrain-induced convergence shifted further downstream (maximum at 33.52°N, 126.8°E), as compared with the convergence in BNW2. When the rainfall system moving eastward from the north to the northeast of the island encounters the intensely dry descending air, the rainfall rapidly dissipates before reaching local updraft #3 (Ceast=1.6×10⁻³ s−1, ; e). Thus, rainfall is absent on the lee side of the island in the BW5 run. This experimental result was similarly confirmed by Lee et al. (Citation2010), who reported both that terrain-generated dry descending air on the lee side and local updrafts on the lateral side of the island act to induce localised intense rainfall on the lateral side of the island when moist southwesterly winds prevail at low altitudes.
The comparison of the BW5 and BNW2 runs illustrates the important roles of both the absence of dry descending air and the presence of a moist updraft on the lee side of Jeju Island in generating rainfall enhancement. In a moist environment with prevailing southwesterly winds at low altitudes, the slightly different wind fields at low altitudes (Fr=0.2–0.55) become a crucial component determining the nature of system evolution on the lee side of the isolated elliptically shaped island; the patterns of rainfall enhancement and dissipation in the two systems result in a two-fold difference in the life-time of rainfall (Drain of 150 min versus 70 min, ). An understanding of these systems dynamics should help improve forecasts of orographic rainfall around Jeju Island when a stationary front is located off the northern shore of the island during the rainy season. Enhancement of the rainfall system on the lee side seems to be a noteworthy phenomenon of an elliptically shaped terrain in a fairly low-Fr regime. Further studies based on both observational data and numerical simulations are necessary to determine how factors such as the height, orientation and size of an elliptically shaped terrain influence rainfall enhancement on the terrain. In addition, results and discussions that are applicable to terrains with more complex topographic features in moist environments will help to improve rainfall forecasts over isolated mountainous terrains.
6. Conclusions
In the present study, a series of idealised experiments using CReSS revealed the effects of the isolated east–west oriented elliptically shaped terrain of Jeju Island on the evolution of a pre-existing rainfall system; that is, rainfall enhancement on the lateral (northwestern) and lee (eastern) sides of the terrain. The significant rainfall enhancement occurs in a moist environment (surface RH, 90%) and under prevailing southwesterly winds at low altitudes, which are well maintained when a stationary front is located off the northern shore of the island. Three wind regimes were selected for the simulation experiments, with Fr=0.2, 0.4 and 0.55. Two spatial regimes were examined for each Fr, one in which an initial warm bubble was located off the northwestern shore and one in which the bubble was located off the western shore of the island.
Overall, results indicate that relatively weak southwesterlies blowing around the steep mountain (height, 2 km) on the island generate two local convergences, one on the northern lateral side and one on the lee side of the island, both in moist environments, thus producing conditions favourable for triggering rainfall enhancement. As an eastward-moving rainfall system approaches the northwestern shore of the island, the southwesterlies at low altitudes accelerate in the region between the system and the terrain, generating a local updraft region; rainfall enhancement thus occurs on the shore in advance of the arrival of the rainfall system on the terrain. The orientation of the prevailing low-altitude southwesterlies parallel to the terrain is a crucial element for the enhancement. Fairly weak southwesterlies at low altitudes allow the enhancement of a rainfall system on the lee side of the terrain due to the convergence of relatively weak go-around northwesterlies from the northern island and relatively strong moist southwesterlies from the southern island, thus producing a relatively long-lived rainfall system. As the southwesterlies strengthen, a dry descending air mass intensifies on the northeastern downwind side, which rapidly dissipates rainfall, resulting in a relatively short-lived rainfall system. A coexisting terrain-generated local convergence, combined with the absence of dry descending air on the downwind side of the terrain, prolongs the lifetime of the rainfall system. The results indicate which key parameters are applicable to terrain-induced effects in a region of environmental moisture and complex topographic features, thus facilitating improved rainfall forecasts over mountainous regions.
7. Acknowledgements
We are grateful to Prof. K. Tsuboki, and Prof. T. Shinoda of the Laboratory of Meteorology of HyARC, Nagoya University, Japan for providing helpful suggestions and comments. This study was supported by the formation of a virtual laboratory for diagnosing the Earth's climate system (VL), defrayed by the Ministry of Education, Culture, Sports, Science and Technology of Japan (MEXT). One of the authors (Keun-Ok Lee) is supported by MEXT, as a doctoral student in the Graduate School of Environmental Studies, Nagoya University, Japan. This research was partly supported by the National Research Foundation of Korea (NRF) through a grant provided by the Korean Ministry of Education, Science & Technology (MEST) in 2014 2014 (No. K20063874). Partly, this work was funded by the Korea Meteorological Administration Research and Development Program under Grant CATER 2012-2071.
References
- Akaeda K. , Reisner J. , Parsons D . The role of meso–scale and topographically induced circulations in initiating a flash flood observed during TAMEX project. Mon. Wea. Rev. 1995; 123: 1720–1739.
- Asselin R . Frequency filter for time integrations. Mon. Wea. Rev. 1972; 100: 487–490.
- Chen C.-S. , Chen W.-S. , Deng Z . A study of a mountain-generated precipitation system in northern Taiwan during TAMEX IOP 8. Mon. Wea. Rev. 1991; 119: 2574–2607.
- Chen G. T.-J. , Huang W.-H. , Wang Y.-M . The relationship of mesoscale convective systems and precipitation over northern Taiwan in Meiyu season. Atmos. Sci. 2001; 29: 21–36.
- Chen G. T.-J. , Yu C.-C . Study of low-level jet and extremely heavy rainfall over northern Taiwan in the Mei-yu season. Mon. Wea. Rev. 1988; 116: 884–891.
- Chiao S. , Lin Y.-L . Numerical modeling of an orographically enhanced precipitation event associated with tropical storm Rachel over Taiwan. Wea. Forecasting. 2003; 18: 325–344.
- Cotton W. R. , Tripoli G. J. , Rauber R. M. , Mulvihill E. A . Numerical simulation of the effects of varying ice crystal nucleation rates and aggregation processes on orographic snowfall. J. climate Appl. Meteorol. 1986; 25: 1658–1680.
- Frame J. W. , Markowski P. M . The interaction of simulated squall lines with idealized mountain ridges. Mon. Wea. Rev. 2006; 134: 1919–1941.
- Frame J. W. , Markowski P. M . Numerical simulations of radiative cooling beneath the anvils of supercell thunderstorms. Mon. Wea. Rev. 2010; 138: 3024–3047.
- Houze R. A. Jr . Orographic effects on precipitating clouds. Rev. Geophys. 2012; 50: RG1001.
- Ikawa M., Saito K. Description of a Nonhydrostatic Model Developed at the Forecast Research Department of the MRI. 1991; MRI Tech. Rep. 28, Meteorological Research Institute.238. Online at: http://www.mri-jma.go.jp/Publish/Technical/DATA/VOL_28/28_en.html.
- Jiang Q . Moist dynamics and orographic precipitation. Tellus A. 2003; 55: 301–316.
- Jou B. J.-D. , Deng S.-M . Structure of a low–level jet and its role in triggering and organizing moist convection over Taiwan: a TAMEX case study. Terr. Atmos. Oceanic. Sci. 1992; 3: 39–58.
- Jou B. J.-D. , Deng S.-M . The organization of convection in a Mei-yu frontal rainband. Terr. Atmos. Oceanic. Sci. 1998; 4: 533–572.
- Klemp J. B. , Wilhelmson R. B . The simulation of three–dimensional convective storm dynamics. J. Atmos. Sci. 1978; 35: 1070–1096.
- Kondo J . Heat balance of the China Sea during the air mass transformation experiment. J. Meteor. Soc. Japan. 1976; 54: 382–398.
- Lai H.-W. , Davis C. A. , Jou B. J.-D . A subtropical oceanic mesoscale convective vortex observed during SoWMEX/TiMREX. Mon. Wea. Rev. 2011; 139: 2367–2385.
- Lee K.-O . Study on Effects of an Isolated Elliptical Terrain (Jeju Island) on Rainfall Enhancement in a Moist Environment. 2013; Nagoya, Japan: PhD Thesis. Nagoya University.
- Lee K.-O. , Shimizu S. , Maki M. , You C.-H. , Uyeda H. , co-authors . Enhancement mechanism of the 30 June 2006 precipitation system observed over the northwestern slope of Mt. Halla, Jeju Island, Korea. Atmos. Res. 2010; 97: 343–358.
- Lee K.-O. , Uyeda H. , Lee D.-I . Microphysical structures associated with enhancement of convective cells over Mt. Halla, Jeju Island, Korea on 6 July 2007. Atmos. Res. 2014; 135–136: 76–90.
- Lee K.-O. , Uyeda H. , Shimizu S. , Lee D.-I . Dual-Doppler radar analysis of the enhancement of a precipitation system on the northern side of Mt. Halla, Jeju Island, Korea on 6 July 2007. Atmos. Res. 2012; 118: 133–152.
- Li J. , Chen Y.-L. , Lee W.-C . Analysis of a heavy rainfall event during TAMEX. Mon. Wea. Rev. 1997; 125: 1060–1082.
- Lin Y.-L . Mesoscale Dynamics. 2007; Cambridge, UK: Cambridge University Press. 630.
- Lin Y.-L. , Farley R. D. , Orville H. D . Bulk parameterization of the snow field in a cloud model. J. Appl. Meteor. 1983; 22: 1065–1092.
- Lin Y.-J. , Pasken R. W. , Chang H.-W . The structure of a subtropical prefrontal convective rainband. Part I: meso-scale kinematic structure determined from dual-Doppler measurements. Mon. Wea. Rev. 1992; 120: 1816–1836.
- Liu A. Q. , Moore G. W. K. , Ksuboki K. , Renfrew I. A . A high-resolution simulation of convective roll clouds during a cold-air outbreak. Geophys. Res. Lett. 2004; 31: L03101.
- Lott F. , Miller M. J . A new subgrid-scale orographic drag parameterization: its formulation and testing. Q. J. R. Meteorol. Soc. 1997; 123: 101–127.
- Louis J. F. , Tiedtke M. , Geleyn J. F . A short history of the operational PBL parameterization at ECMWF. Proceeding of the Workshop on Planetary Boundary Layer Parameterization, Reading. 1981; United Kingdom: ECMWF. 59–79.
- Markowski P. M. , Dotzek N . A numerical study of the effects of orography on supercells. Atmos. Res. 2011; 100: 457–478.
- Murakami M . Numerical modeling of dynamical and microphysical evolution of an isolated convective cloud – The 19 July 1981 CCOPE cloud. J. Meteor. Soc. Japan. 1990; 68: 107–128.
- Murakami M. , Clark T. L. , Hall W. D . Numerical simulations of convective snow clouds over the Sea of Japan; Two-dimensional simulations of mixed layer development and convective snow cloud formation. J. Meteor. Soc. Japan. 1994; 72: 43–62.
- Olafsson H . The impact of flow regimes on asymmetry of orographic drag at moderate and low Rossby numbers. Tellus A. 2000; 52: 365–379.
- Petersen G. N. , Olafsson H. , Kristjansson J. E . Flow in the lee of idealized mountains and Greenland. J. Atmos. Sci. 2003; 60: 2183–2195.
- Reeves H. D. , Lin Y.-L . The effect of a mountain on the propagation of a preexisting convective system for blocked and unblocked flow regimes. J. Atmos. Sci. 2007; 64: 2401–2421.
- Segami A. , Kurihara K. , Nakamura H. , Ueno M. , Takano I. , co-authors . Operational mesoscale weather prediction with Japan spectral model. J. Meteor. Soc. Japan. 1989; 67: 907–923.
- Smith R. B . The influence of mountains on the atmosphere. Adv. Geophys. 1979; 21: 87–230.
- Smith R. B. , Grønås S . Stagnation points and bifurcation in 3-D mountain airflow. Tellus A. 1993; 45: 28–43.
- Smolarkeiwicz P. K. , Rasmussen R. M. , Clark T. L . On the dynamics of Hawaiian cloud bands: island forcing. J. Atmos. Sci. 1988; 45: 1872–1905.
- Smolarkeiwicz P. K. , Rotunno R . Low Froude number flow past three-dimensional obstacles. Part I: baroclinically generated Lee vortices. J. Atmos. Sci. 1989; 46: 1154–1164.
- Smolarkeiwicz P. K. , Rotunno R . Low Froude number flow past three-dimensional obstacles. Part II: upwind flow reversal zone. J. Atmos. Sci. 1990; 47: 1498–1511.
- Tsuboki K. , Sakakibara A . Zima H. P. , etal. Large-scale parallel computing of cloud resolving storm simulator. High performance computing. Proceedings of the Fourth International Symposium on High Performance Computing. 2002; Springer. 243–259.
- Tsuboki K. , Sakakibara A . High-resolution modeling of localized heavy rain associated with mesoscale convective systems during the Baiu season. Proceedings of the First Annual Meeting. 2004; Asia Oceania Geosciences Society: Singapore. 517–518.
- Tsuboki K. , Sakakibara A . Numerical prediction of high-impact weather systems. The Textbook for Seventeenth IHP Training Course in 2007. 2007; Nagoya, Japan: Hydrospheric Atmospheric Research Center, Nagoya University, UNESCO.
- Wang C.-C. , Chen G. T.-J. , Chen T.-C. , Tsuboki K . A numerical study on the effects of Taiwan topography on a convective line during the Mei-Yu season. Mon. Wea. Rev. 2005; 133: 3217–3242.
- Xu W. , Zipser E. , Chen Y.-L. , Liu C. , Liou Y.-C. , co-authors . An orography–associated extreme rainfall event during TiMREX: initiation, storm evolution, and maintenance. Mon. Wea. Rev. 2012; 140: 2555–2574.
- Yoshizaki M. , Kato T. , Tanaka Y. , Takayama H. , Shoji Y. , co-authors . Analytical and numerical study of the 26 June 1998 orographic rainband observed in Western Kyushu, Japan. J. Meteor. Soc. Japan. 2000; 78: 835–856.
8. Appendix
The environmental conditions was designed to represent the environmental conditions of previous studies (Lee et al., Citation2010, Citation2012) that investigated the mechanism of orographically enhanced intense rainfall on the elliptical steep terrain of Jeju Island during the rainy season (June to mid–July). Previous studies considered that warm moist southwesterly winds are well maintained at low altitudes when a stationary front is located off the northern shore of Jeju Island, and that these winds play an important role in triggering the intensification of rainfall systems in the vicinity of the island. Furthermore, CitationLee (2013) reported that in the last 10 yr (2003–2012), the largest rainfall amounts on the island accumulated when southwesterly winds prevailed at low altitudes during the rainy season; the maximum rainfall was localised on the northern side of the island.
Accordingly, in this study, we showed that rainfall enhancement on the northern side of Jeju Island occurs when southwesterly winds are dominant at low altitudes, and are gradually redirected to westerly above 2 km, with a gradual increase in wind speed. The speed of southwesterly wind at low altitudes in Lee et al. (Citation2012) and Lee et al. (Citation2010) was approximately 5 and 10 m s−1, respectively (with Fr of 0.2 and 0.55, respectively). The effect of the different wind speeds at low altitudes on the evolution of the system on the lee side of the island was discussed by Lee et al. (Citation2012). The atmospheric environment on the mountain on Jeju Island (elevation, 2 km) is relatively stable when the island is located to the south of a stationary front; in these circumstances, the calculated Fr value in the environment of the island is generally low, rarely supercritical. Considering the wind distribution of the previous studies, three categories of Fr were designed: 0.2, 0.4 and 0.55; the detailed wind distributions are shown in . From the surface to a height of 2 km, the wind speed is designed to gently increase with height and is then set as constant above 2 km: 15 m s−1 at heights of 2.5–4.5 km and 20 m s−1 at heights of 5–8 km. The southwesterly wind is designed to be gently redirected westerly above a height of 2 km, which can bring the rainfall system to the eastern (lee) side of the island.
Table 5. Vertical profiles of initial temperature (T), relative humidity (RH) and wind used in experiments. One full barb and half barb denote 5 and 2.5 m s−1, respectively.
In both of the previous studies, temperatures (T) in the range of 296–301 K and relative humidities (RH) in the range of 88–90% were observed at the surface. Based on these environmental conditions, the basic-state T and RH used at each level of the model are shown in . To reproduce the warm and moist environment at low altitudes, the surface T was set to 299 K and the lapse rate at heights of <3 km was set to the moist adiabatic lapse rate for stable air conditions (N=0.011 s−1). The RH was set to 90% at heights <2 km and gradually decreased with altitude.