
Abstract
A comparison between two mesoscale models, Colorado State University Regional Atmospheric Modeling System (RAMS) version 4.4 coupled with the Land-Ecosystem–Atmosphere Feedback Model (LEAF2) and Penn State/NCAR's Mesoscale Model (MM5) coupled with NOAH Land Surface Model, was conducted in order to assess the sensitivity of forecasted planetary boundary layer (PBL) variables to anomalous initial volumetric soil moisture conditions. The experiments were conducted using three synoptic events: June 11, 17 and 22, 2006. For each event, one control run and six additional simulations were completed using RAMS and MM5. In each of the events, initial volumetric soil moisture was increased and decreased by 0.05, 0.10 and 0.15 m3m−3. Each of the events was individually analysed. Precipitation generally increased and decreased with enhanced and reduced soil moisture, respectively. Overall, RAMS simulations presented a greater sensitivity and variability in precipitation and PBL parameters. It was found that equivalent potential temperature, vertical wind velocities, and latent and sensible heat flux were helpful in explaining precipitation accumulation and distribution.
1. Introduction
The sensitivity of planetary boundary layer (PBL) parameters to varying conditions of soil moisture (SM) has become the focus of attention of many modelling studies dealing with short-term, regional, land–atmosphere processes (e.g. Houser et al., Citation1998; Fennessy and Shukla, Citation1999; Douville et al., Citation2001; Findell and Eltahir, Citation2003; Quintanar et al., Citation2008; Leeper et al., Citation2011). Modifications of SM have been shown to affect the response of numerical models when forecasting boundary layer variables such as evaporation and transpiration rates, Bowen ratio (ratio between sensible and latent heat fluxes), convective precipitation, vertical winds and equivalent potential temperature (θ e ) (e.g. Beljaars et al., Citation1996; Eltahir, Citation1998; Findell and Eltahir, Citation2003; Quintanar et al., Citation2008; Leeper et al., Citation2011; Mahmood et al., Citation2011).
Numerical experiments set in early spring and summer have revealed that increases in SM enhance the availability of water vapour throughout the PBL and the probabilities of clouds and convection due to the increase of moist static stability (Eltahir, Citation1998; Quintanar et al., Citation2008). Under drier conditions, however, most of the incoming solar radiation is partitioned into sensible heat flux. Large Bowen ratios are conducive of thermal turbulences and convection, which can homogenise and deepen the PBL improving the potential for cloud formation (Ek and Mahrt, Citation1994; Ek and Holstag, Citation2004).
Recent modelling studies of land–atmospheric interactions have revealed that 3-D wind plays a more important role in convection inhibition and suppression than previously thought (Quintanar et al., Citation2008). Although SM-induced circulations are not likely to produce heavy precipitation (Baker et al., Citation2001), sharp horizontal gradients of SM have been shown to produce turbulence and enhance land and sea breeze type circulations (Ookouchi et al., Citation1984). It has also been shown that strong backing winds or unidirectional winds with strong vertical shear can suppress convective processes. On the other hand, moderate veering through the atmosphere has been shown to enhance convection. Although the effect of SM on low-level winds has only been addressed by a limited number of studies (e.g. Ookouchi et al., Citation1984; Sutton et al., Citation2006), recent experiments have shown that significant drying of the environment can enhance the probability of veering winds patterns with vertical speeds of up to 10 m s−1, thus enhancing the convection potential (Quintanar et al., Citation2008).
Recently, Quintanar et al. (Citation2008) conducted a Penn State/NCAR's Mesoscale Model (MM5) model-based study in which modifications of the initial conditions of SM resulted in variations of the precipitation patterns, Bowen ratio, vertical velocities and θ e . Quintanar et al. (Citation2008) examined three synoptic events with varying synoptic forcing occurring on June, 2006. Several simulations were conducted in which initial SM was increased and decreased by 0.05, 0.10 and 0.15 m3m−3. Three-member wet and dry ensembles were constructed and analysed with respect to control (CTRL) runs for each study period. Quintanar et al. (Citation2008) suggested that vertical velocities and θ e were good indicators of precipitation. While a small Bowen ratio was needed, it was not a sufficient indicator for forecasting precipitation. Quintanar et al. (Citation2008) showed that decreases of SM were conducive to decreased precipitation while wet experiments increased precipitation slightly, but less than anticipated.
Here, a comparative study is conducted in order to examine the response of PBL to changes in SM using the MM5 version 3 and the Regional Atmospheric Modeling System (RAMS) (Pielke et al., Citation1992; Cotton et al., Citation2003) version 4.4. The MM5 and RAMS have been widely used for the examination of land–atmospheric interactions (e.g. Pitman et al., Citation2004; Weaver, Citation2004; Quintanar et al., Citation2008, Citation2009; Douglas et al., Citation2009). Specifically, the primary objective is to assess relative differences in response of various PBL variables due to the use of different models. These differences were noted in the paper by analysing responses of precipitation, wind, equivalent potential temperature, and latent and sensible heat fluxes. The paper does not attempt to attribute and quantify exact sources of differences since they are generally linked to different model physics parameterisation scheme options provided by the MM5 and RAMS, their complex interactions and, more importantly, are within the limits of the model uncertainties. Moreover, such an attempt is beyond the scope of this paper.
A limited number of studies have assessed the response of each model when forecasting various PBL processes (e.g. Cox et al., Citation1998; Patra et al., Citation2000; Zhong and Fast, Citation2003). Cox et al. (Citation1998) conducted a study in which four state-of-the-art atmospheric models were compared for nine climate “theatres” throughout the globe: the RAMS, the MM5, the Navy Operational Regional Atmospheric Prediction System and the Relocatable Window Model. They found that the RAMS performed slightly better than the MM5. Zhong and Fast (Citation2003) showed, through a multimodel intercomparison of the RAMS, the MM5 and the Meso-Eta, that the RAMS and the MM5 forecasting errors were surprisingly similar when forecasting PBL processes. The RAMS and the MM5 managed to accurately capture terrain-induced circulations and valley-induced divergence and convergence at very high resolutions (Zhong and Fast, Citation2003). A more recent study conducted by Pirovano et al. (Citation2007) revealed that the strongest discrepancies between the models occurred within the PBL where the processes were terrain-driven. When forecasting wind circulation and temperature profile, the RAMS and the MM5 performed similarly in agreement with observations while the RAMS presented a bias towards greater wind intensity (Pirovano et al., Citation2007).
To the authors’ knowledge, this is the first study in which MM5 and RAMS responses to modified initial SM conditions were compared. This is a follow-up of Quintanar et al. (Citation2008) experiments and complimentary to Quintanar and Mahmood (Citation2012). The results of this study will be useful for future applications of both models under a variety of land surface conditions including various levels of SM.
The paper is organised as follows. Section 2 describes the models’ initialisation parameters, numerical assumptions and initial and boundary conditions. This section also provides a detailed description of the experimental design and the synoptic events in question. Section 3 presents the analysis of each individual event and the overall tendencies of each model. The aforementioned was accomplished by examining wet and dry ensemble runs with respect to CTRL simulations. Finally, section 4 provides concluding remarks.
2. Study area and methodology
The study region was centred over western Kentucky, US (), which provided an ecological, physiographical and climatologic transition zone. It is bordered by the Mississippi river to the west, the Appalachian Mountains to the east, a relatively dry Midwest region to the north, and a wetter region to the south (Quintanar et al., Citation2008). The models’ domains consisted of a single 160×120 grid-point mesh with 12 km horizontal grid spacing and 31 vertical levels. Since this study is a follow-up of Quintanar et al. (Citation2008, Citation2009), we have used the same horizontal resolution of the latter to capture the evolution of smaller mesoscale features. The simulation domain area was increased for the current study, with respect to Quintanar et al. (Citation2008) experiments, in order to allow for better assimilation of initial boundary conditions, to reduce edge effects and thus, to minimise errors.
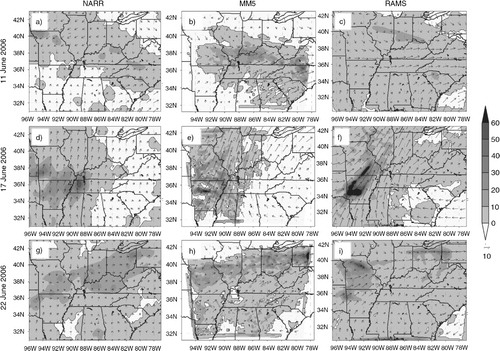
Fig. 1 NARR, MM5, and RAMS CTRL experiments 12-hour precipitation accumulation and horizontal wind velocities centred at 0000 UTC for each event.
As noted above, the experiments were conducted by using the MM5 and the RAMS. The aforementioned mesoscale models consist of 3-D, primitive, non-hydrostatic equations with terrain-following vertical coordinates. The MM5 and the RAMS also provide multiple parameterisation options for turbulent mixing, advection, lateral and vertical boundary conditions, soil and vegetation, convection, and short- and long-wave radiation. Despite numerous similarities, each model was initialised with unique physics and convective parameterisations given their availability. summarises some of the differences among the models applications with respect to initialisation, parameterisations and grid structures.
Table 1. Summary of model specifications and parameterisations
The RAMS and the MM5 were initialised with a modified-Kuo (Tremback, Citation1990) and Kain-Fritsch convection parameterisation schemes (Kain and Fritsch, 1993; Kain, Citation2004), respectively, due to the restrictions in the model options. In this version of the RAMS, only two options are available for the treatment of convection processes: Kuo scheme (Tremback, Citation1990) and no parameterisation for the treatment of convection processes. The latter can be permissible for simulations with horizontal grid spacing less than 4 km. Kuo (Citation1974) scheme has been widely used for deep-cumulus parameterisation in large-scale and mesoscale models due to its simplicity and non-demanding computational requirements (Baik et al., Citation1991). The Kuo deep-cumulus convection relies on the notion that cumulus heating and moisture of large-scale circulation is proportional to the temperature and water vapour mixing ratio difference between the environment and the parcel (Kuo, Citation1974; Tremback, Citation1990; Baik et al., Citation1991). The resulting estimations of vertical velocities, momentum and moisture differences can be used in order to compute vertical transport of sensible heat, horizontal momentum and moisture among other deep cumuli quantities (Kuo, Citation1974).
In contrast, MM5 uses a version of the Kain-Fritsch cumulus convective parameterisation (Kain and Fritsch, Citation1993; Kain, Citation2004) that includes shallow convection. This scheme is a mass flux parameter scheme that approximates the properties of convective clouds using the Lagrangian parcel method and vertical momentum dynamics (Kain, Citation2004). Kain-Fritsch parameterisation has proven superior to Kuo and modified-Kuo schemes for convective events such as frontal precipitation, monsoon systems and tropical weather (Kuo et al., Citation1996; Pereira et al., Citation1999; Yang et al., Citation2000; Saleeby and Cotton, Citation2004). Yang et al. (Citation2000) suggested that Kain-Fritsch scheme offers superior skill over Kuo since it provided better estimates of the effects of convection at the mesoscale, while Kuo and modified-Kuo schemes better represent the large-scale effect of convective systems.
RAMS (Pielke et al., Citation1992; Cotton et al., Citation2003; Pielke, Citation2013) and MM5 (Hong and Pan, Citation1996-MRF scheme) use comparable representations of the PBL and surface-layer turbulence. The differences in the parameterisations in the models are within the range of representations used by operational and research numerical weather prediction models [e.g. see Appendix B in Pielke (Citation2013)]. This is true not only of the turbulence parameterisation but the deep-cumulus convection algorithms also.
The RAMS and the MM5 were coupled with Land Ecosystem–Atmosphere Feedback model (LEAF2; Walko et al., Citation2000) and NOAH Land Surface Model (NOAH-LSM; Chen and Dudhia, Citation2001), respectively, in order to account for the heat and moisture exchange between the soil, vegetation, canopy, surface water and atmosphere.
The initial and lateral boundary conditions were provided by 1°×1° NCEP Final Global Data Analysis System (FNL; http://dss.ucar.edu/datasets/ds083.2/). The lateral boundary conditions were nudged every 6 hours. FNL dataset provides SM information at four layers: 0–0.1 m, 0.1–0.4 m, 0.4–1.0 m and 1.0–2.0 m. SM was initialised at the beginning of each simulation and prognosed at every time step based on the processes involved in water exchanged, like precipitation, evaporation and transpiration. Unlike the NOAH-LSM, the LEAF2 initialisation does not take into account grid-point variations of SM. The RAMS LEAF2 initialises SM homogeneously across the domain at each defined layer despite changes and variations at the sub-grid level.
In each of the sensitivity experiments, SM was uniformly changed (e.g. by 0.05 m3m−3) throughout the models’ domain in order to preserve horizontal and vertical gradients of moisture. The modifications of SM were consistent with Quintanar et al. (Citation2008) experimental design. As noted previously, initial volumetric SM was increased and decreased by 0.05, 0.10 and 0.15 m3m−3 with respect to the initial SM in the CTRL run (i.e. from the FNL dataset) for all of the events examined. Unlike previous studies in which SM was simply multiplied by a factor larger or smaller than unity in order to introduce horizontal and vertical moisture gradients, fixed values were added and subtracted from the initial values of SM in order to avoid model induced mesoscale circulations (Ookouchi et al., Citation1984; Quintanar et al., Citation2008). Experiments in which SM was increased are referred to as WP05, WP10 and WP15. On the other hand, dry experiments are referred to as DP05, DP10 and DP15. The simulations were integrated over a 24-hour period initialised at 1200 UTC for each study period. The set of experiments was conducted with both mesoscale models.
Current simulations did not include spin-up time for a number of reasons. First, simulation period was short (24 hours). Second, we have conducted a number of tests with and without spin-up time for these events (e.g. Quintanar et al., Citation2009, Quintanar and Mahmood, Citation2012). We found, for these particular events, model spin-up did not improve the simulations when compared to the simulations with no spin-up. As a result, and since we are using the same events, no model spin-up was considered for the present simulations. Third, we have successfully adopted this approach in several of our follow-up studies (e.g. Leeper et al., Citation2011; Sen Roy et al., 2011). Fourth, an unintended benefit was that we have obtained additional efficiency in computational time. In addition, a detailed discussion of benefits and limitations of using month- or year-long spin-up time for this type of experiment was presented in Quintanar et al. (Citation2008).
Given the initial high SM conditions over the southeastern region of the US during June of 2006, no minimum value of soil wetness was required for the study. In contrast, upper boundaries of SM were enforced for the wet experiments. The field capacity of the soil in the area is 0.40 m m−3 and wilting point is 0.067 m m−3. The changes were sufficient to allow the soil to become dry and saturated, which was expected to have significantly different effects on PBL depth and evolution (Leeper et al., Citation2009, Citation2011; Mahmood et al., Citation2011). Wetter soils have been shown to be conducive to producing shallower PBL, while a drier environment has been shown to enhance turbulent mixing and thus PBL depth (Quintanar et al., Citation2008).
Simulated precipitation was verified with the North American Regional Reanalysis (NARR; Messinger et al., Citation2006). NARR data was selected for verification purposes since, unlike other global model reanalyses, orographically corrected precipitation is assimilated into the dataset providing better estimates of hydrologic variables such as SM and land surface fluxes (Luo et al., Citation2005).
Six simulations were conducted for three precipitation events in June 2006. For each event the effect of the SM modifications on θ e , 3-D vertical wind, latent and sensible heat fluxes (LE and H), and precipitation and horizontal wind were analysed. The results were grouped in dry and wet experiments.
2.1. Synoptic events
Three synoptic events were examined during late spring and early summer of 2006: 11, 17 and 22 June. The events were typical given the seasonal variations of the region and presented various degrees of synoptic forcing ranging from weak to strong. Despite apparent similarities among the events, they presented varying synoptic forcing and convective activities, which could allow us to better examine the influence of SM on various synoptically driven convective events and response of the models.
The 11 June event was characterised by a stationary front extending through Nebraska, Missouri, western Kentucky, Tennessee and North Carolina on 11 June at 1200 UTC. Throughout the simulation period, this frontal boundary remained stationary until 12 June at 0600 UTC after which a low-pressure system developed over central Kentucky. The low-pressure system had a cold front extending westward into Missouri and Nebraska. The system progressed eastward, located over Virginia on 12 June at 0900 UTC. The cold front had been displaced southward. Through the Midwest and Kentucky, winds were from the north and temperatures were decreasing. The system produced significant precipitation with some regions experiencing up to 30 mm. The 11–12 June event was a moderate synoptically driven event as defined by Quintanar et al. (Citation2008).
The 17–18 June event was influenced by strong warm moist air advection from the Gulf of Mexico. A six-day drying period preceded this event due to the presence of a high-pressure system over Eastern US. A low-pressure system was located over northern Michigan at 0000 UTC on 18 June. The system was accompanied by a cold frontal boundary extending from Wisconsin through Oklahoma. Strong south winds with speeds of up to 8 m s−1 helped advection of warm moist air into the southeastern region. As a result of the interaction with the cold front, precipitation developed along the frontal boundary with convective clusters found as far as Kentucky. This event produced significant amounts of precipitation over western Kentucky exceeding 40 mm. This event was identified as highly enhanced by synoptic features and circulation.
Conversely, the 22 June event was weakly influenced by the synoptic setting. A stationary boundary extended from Colorado to Iowa, where the surface low was located at 1200 UTC 22 June. To the east of this feature, a warm front was present extending through Ohio. By 1200 UTC 23 June, a cold front had developed in association with an occluded low over the Canadian province of Quebec. The cold frontal boundary extended through the Great Lakes. The precipitation event over Kentucky was enhanced by the presence of warm-air advection from the Gulf of Mexico. Lower level wind speeds during this event ranged from calm to 5 m s−1. The event produced significant precipitation over the region of study with recorded amounts of 25 mm.
3. Results
a–i show 12-hour accumulated precipitation for all CTRL simulations. While both models managed to capture the overall synoptic circulation for all three events, the distribution and accumulation of precipitation varied with respect to NARR data (see a–i). On 11–12 June, MM5 produced significantly more precipitation than NARR. MM5 positioned precipitation maxima – exceeding 40 mm – extending from southern Indiana into northern Kentucky (see b). On the contrary, RAMS produced a large area of light precipitation up to 10 mm over most of the domain (c). It produced a precipitation maxima extending from central Illinois to southwestern Ohio with 12-hour accumulations not exceeding 20 mm. Based on the visual inspection, both models have limited success in accurately positioning the rainfall for the 11–12 June event.
For the June 17–18 event, MM5 estimated precipitation amounts ranging from 20 to 40 mm over most of Alabama, Missouri, Illinois and western Kentucky. A precipitation maximum exceeding 50 mm was located over northeastern Arkansas. The MM5 resolved a maximum slightly to the southwest of the observed precipitation core (compare d). Furthermore, RAMS produced precipitation maxima, exceeding 60 mm, extending from central Arkansas to southeastern Missouri. For this event, both models simulated precipitation structures similar to those observed, although maximum precipitation was higher (than observed). The models also captured the strong low-level warm-air advection of 17–18 June.
On 22–23 June, MM5 simulated light precipitation, ranging from 0 to 10 mm, over most of the domain. The model estimated multiple precipitation maxima extending from central Illinois to northern Ohio and to Pennsylvania. This simulation produced significantly more precipitation than NARR with maxima exceeding 60 mm. NARR reported an accumulation maximum less than 20 mm for these areas. The RAMS simulated a precipitation maximum over northern Missouri with accumulations exceeding 50 mm. The RAMS also estimated a small accumulation over northwestern Arkansas and northern Ohio, not observed on NARR. Overall, both models resolved the light precipitation of less than 10 mm over most of the domain. They captured the spatial distribution of precipitation relatively well for all three events with some discrepancies in the location and intensity of the precipitation maxima.
3.1. Sensitivity of MM5 and RAMS to SM modifications
As noted above, six simulations were conducted for each study period in which θ e , 3-D vertical wind field, latent (LE) and sensible heat flux (H), precipitation and horizontal wind were analysed. All of the aforementioned variables were also examined by Quintanar et al. (Citation2008) since they were shown to be good indicators of precipitation development. Stability is analysed using θ e as an indicator for moist static energy (Pielke, Citation2001; Quintanar et al., Citation2008; Leeper et al., Citation2011; Mahmood et al., Citation2011). Quintanar et al. (Citation2008) demonstrated that θ e was more sensitive to SM variations than the lifted condensation level (LCL) and the convective available potential energy. In addition, LE and H were also explored by Quintanar et al. (Citation2008) by using Bowen ratio (H/LE). Large LE coupled with horizontal gradients of SM and a lifting mechanism can generate deep-cumulus convection (Betts et al., Citation1996; Pielke, Citation2001; Quintanar et al., Citation2008). Finally, vertical velocities were examined as a lifting mechanism for deep convection and a good indicator of precipitation rate (Quintanar et al., Citation2008).
3.2. 11–12 June 2006
3.2.1. Precipitation and horizontal wind.
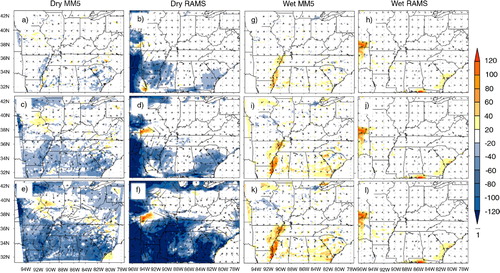
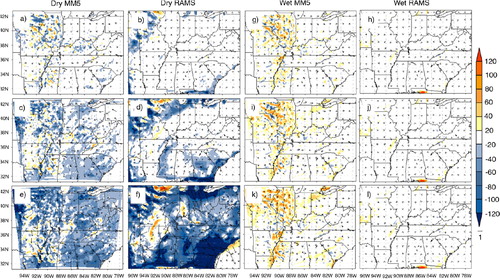
a–l summarises the precipitation differences between each experiment and CTRL simulations. The MM5 presented little variation among dry experiments (a, c and e). It was also true for wet experiments (g, i and k). Overall, both dry and wet experiments produced higher precipitation. In addition, dry experiments, DP10 and DP15 in particular (c and e), produced locally up to 15 mm higher precipitation. Precipitation presented less sensitivity to SM for wet experiments than for dry ones. This occurred due to already wet condition of the CTRL (as noted before).
Fig. 2 MM5 and RAMS CTRL 12-hour precipitation accumulation difference (EXP minus CTRL) and horizontal wind velocities (m s−1) centred at 0000 UTC 12 June for DP05 (a, b), DP10 (c, d), DP15 (e, f), WP05 (g, h), WP10 (i, j) and WP15 (k, l).
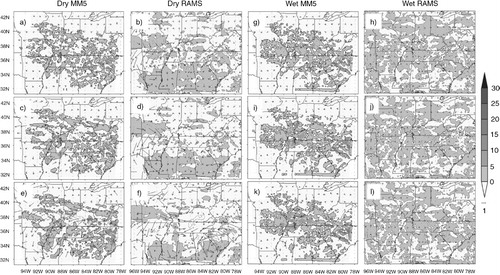
Like the MM5, the RAMS dry experiments for 11–12 June presented little variation among each other with respect to precipitation. DP05 and DP10 (b and d) presented local increases of precipitation up to 5 mm with respect to CTRL. SM decreases of up to 0.15 m3m−3 resulted in decreased precipitation (compared to CTRL) over some areas (f). An increase of SM enhanced precipitation development. WP05, WP10 and WP15 produced precipitation accumulations up to 5 mm greater with respect to CTRL for most of the domain (h, j and l).
Modified SM did not produce significant variation for MM5 simulations wind fields. Both dry and wet experiments presented little to no variations of wind speeds with respect to CTRL. Only DP15 (e) presented some wind speed differences over northern Missouri and central Kentucky (also area of precipitation difference). Altered SM-induced low-level horizontal wind field differences for the RAMS experiments were minimal for all experiments.
3.2.2. Equivalent potential temperature.
a–l presented the differences between averaged θ e for dry and CTRL and wet and CTRL simulations over a 12-hour period centred at 0000 UTC on 12 June. The θ e -averaged values were shown as a vertical cross-section at 37°N latitude extending from 94°W to 78°W longitude. This latitude was selected because it encompassed the regions of strongest precipitation to the west of the domain and little to no precipitation to the east for all three synoptic events in question (). The cross-sections were examined through 900–200 hPa.
Fig. 3 MM5 EXP minus CTRL and RAMS EXP minus CTRL cross-sections for DP05 (a, b), DP10 (c, d), DP15 (e, f), WP05 (g, h), WP10 (i, j) and WP15 (k, l) 12-hour average θ e (negative values contoured, K) and horizontal wind velocities (m s−1) for 37°N latitude centred at 0000 UTC on 12 June. Pressure levels are shown in millibars.
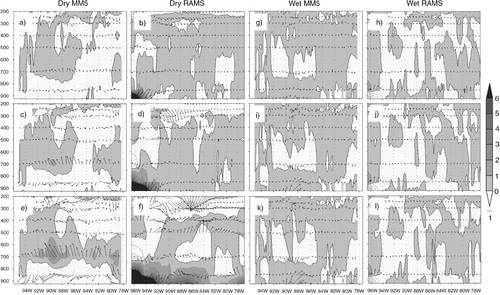
The MM5 dry experiments did not produce any differences from CTRL runs at the lower troposphere. Differences between θ e for DP05 and DP10 and CTRL were largely less than 1 K. For the DP15 experiment, on the contrary, simulated θ e values were up to 4 K greater than CTRL and the maximum difference was located around 700 hPa (e). This height represented the upper boundary of the PBL. In contrast, wet experiments presented little to no variation with respect to CTRL. All three experiments, compared to CTRL, simulated lower θ e (less than 1 K) for most of the domain. All wet experiments produced higher θ e than the CTRL simulation at the lower troposphere between 94°W and 84°W collocated with the precipitation maximum.
RAMS DP05, DP10 and DP15 experiments simulated θ e values exceeding 6 K, compared to CTRL, over the western region of the domain and in the lower troposphere (b, d and f). The positive maxima were located between 96°W and 94°W for all three dry experiments with negative values right on top of them for the DP10 and DP15 experiment. On the contrary, wet experiments produced significantly lower θ e for this area (h, j and l). However, increased lower tropospheric θ e up to 1 K compared to CTRL could be found between 94°W and 86°W.
3.2.3. Vertical wind.
a–l demonstrated the responses of vertical wind due to changes in SM. The MM5 DP05, DP10 and DP15 simulations showed increased vertical wind velocities at around 88°W (a, c and e). DP05 produced the strongest vertical motions over Kentucky with respect to CTRL exceeding 0.12 m s−1 at the upper levels. The vertical wind maximum extended from the surface to 250 hPa. This feature generally corresponded with the region in which MM5 produced the highest precipitation accumulation. Increase of SM also produced regions of increased vertical velocities with respect to CTRL (g, i and k). Although the increase of vertical velocities due to increased SM was not as pronounced as for the dry experiments, this feature was observed for all wet experiments. Vertical wind maxima difference between the experiment and CTRL ranged from 0.02 to 0.08 m s−1 and were located at 88°W, where the maximum precipitation difference on the cross-section was located.
Fig. 4 MM5 EXP minus CTRL and RAMS EXP minus CTRL cross-sections for DP05 (a, b), DP10 (c, d), DP15 (e, f), WP05 (g, h), WP10 (i, j) and WP15 (k, l) 12-hour average vertical and horizontal wind velocities (m s−1) for 37°N latitude centred at 0000 UTC on 12 June. Pressure levels are shown in millibars.
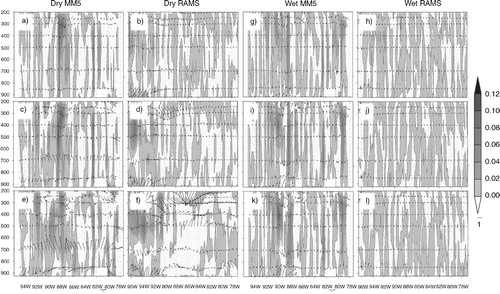
On the other hand, RAMS DP05, DP10 and DP15 simulated a vertical velocity maximum over the western portion of the domain with respect to CTRL (b, d and f). The maxima were located between 96° and 94°W. As seen in MM5 wet experiments, RAMS WP05, WP10 and WP 15 produced regions where vertical wind velocities were enhanced by increases in SM (h, j and l). A 0.08 m s−1 maximum was observed at 94°W and extending from 500 to 300 hPa. Not much difference among the RAMS wet experiments was observed.
3.2.4. Latent heat flux.
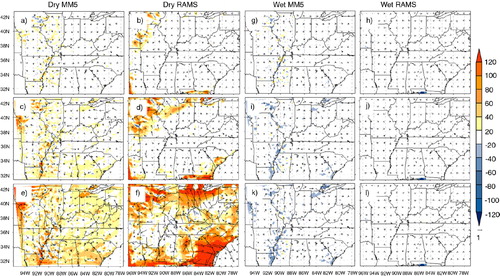
a–l summarised 12-hour averaged LE sensitivity experiments minus CTRL simulations centred at 0000 UTC on 12 June. Decreases in SM were conducive of decreased LE for MM5 dry simulations (a, c and e). Figures showed that decrease of SM by 0.05 m3 m−3 did not have a significant effect on the surface LE. There were small isolated areas where LE was 40–80 Wm−2 lower compared to CTRL (a). Decreases of SM by 0.10 and 0.15 m3m−3 produced regions where LE was up to 120 Wm−2 lower compared to CTRL (c and e). On the contrary, increases in SM resulted in increased LE up to 120 Wm−2 along the Mississippi/Arkansas border, South Carolina and Georgia (g, i and k).
Fig. 5 MM5 EXP minus CTRL and RAMS EXP minus CTRL for DP05 (a, b), DP10 (c, d), DP15 (e, f), WP05 (g, h), WP10 (i, j) and WP15 (k, l) 12-hour average latent heat fluxes (Wm−2) and horizontal wind velocities (m s−1) centred at 0000 UTC on 12 June.
RAMS dry simulations produced lower LE compared to CTRL in most of the domain with differences larger than 120 Wm−2. In contrast, like MM5 wet experiments, little changes can be observed between WP05, WP10 and WP15 and compared to CTRL. There were small isolated areas where LE was up to 120 Wm−2 greater compared to the CTRL.
3.2.5. Sensible heat flux.
a–l showed the H differences between experiments and CTRL simulations. The differences in general mirror the LE patterns. For MM5 dry simulations, decreases in SM resulted in increased H. DP05 produced small areas of H differences that exceeded 40 Wm−2 compared to CTRL. As SM was further decreased, the differences between the DP10 and DP15 and CTRL exceeded 120 Wm−2 for both experiments. Increases of SM had little impact on H for WP05, WP10 and WP15 (see g, f and k). RAMS dry experiments were more sensitive to increases in SM than MM5's simulations. RAMS dry experiments simulated increased H over the western and southern section of the domain with values exceeding 120 Wm−2 compared to CTRL. Wet experiments show little or no changes in H.
Fig. 6 MM5 EXP minus CTRL and RAMS EXP minus CTRL for DP05 (a, b), DP10 (c, d), DP15 (e, f), WP05 (g, h), WP10 (i, j) and WP15 (k, l) 12-hour average sensible heat fluxes (Wm−2) and horizontal wind velocities (m s−1) centred at 0000 UTC on 12 June.
3.3. 17–18 June 2006
3.3.1. Precipitation and horizontal wind.
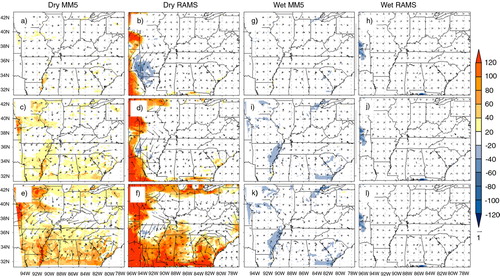
MM5 dry and wet experiments for the 17–18 June event are summarised in a–l. Overall, the DP05, DP10 and DP15 dry experiments displaced the location of precipitation maxima with respect to CTRL simulations over the western sector of the domain. Accumulation differences between the experiments and CTRL exceed 15 mm at some locations. Again, despite drying of soils, initial wet conditions throughout the simulation domain allowed the atmosphere to respond in a manner that produced precipitation. Increased SM in MM5 also altered the distribution of precipitation.
Fig. 7 MM5 and RAMS CTRL 12-hour precipitation accumulation difference (EXP minus CTRL) and horizontal wind velocities (m s−1) centred at 0000 UTC 18 June for DP05 (a, b), DP10 (c, d), DP15 (e, f), WP05 (g, h), WP10 (i, j) and WP15 (k, l).
Similar to MM5, SM decreases were conducive to an overall decrease in precipitation and a displacement of the maximum in the RAMS simulations. The DP05 dry experiment displaced precipitation over northern Missouri and southern Arkansas. This experiment produced up to 60 mm less accumulated precipitation than CTRL over western Arkansas and southeastern Missouri. All dry experiments presented increased precipitation over Alabama, Mississippi, Tennessee, Kentucky and Indiana of up to 15 mm. Both wet and dry experiments showed locations of moderate precipitation maxima compared to CTRL. Despite the similarities among the simulations with regards to the displacement of precipitation, overall, dry experiments produced less precipitation than the wet ones.
The MM5 and RAMS horizontal low-level wind fields were not very sensitive to increased or decreased SM with the exception of RAMS DP15 (f). In these sensitivity experiments, relatively higher wind speeds could be found over Ohio, eastern Kentucky, South Carolina and Georgia (f; ~37–42°N 82–84°W and ~32–35°N 80–85°W).
3.3.2. Equivalent potential temperature.
The θ e response to SM modifications for both models is presented in a–l. The MM5 dry simulations suggest 1–2 K increases in θ e , largely between 750 and 400 hPa (a, c and e). The wet experiments also largely produced increased θ e values of 1–2 K in low levels and above 400 hPa. The primary difference between the dry and wet MM5 experiments was the distribution of enhanced θ e vertically throughout the atmosphere for the latter.
Fig. 8 MM5 EXP minus CTRL and RAMS EXP minus CTRL cross-sections for DP05 (a, b), DP10 (c, d), DP15 (e, f), WP05 (g, h), WP10 (i, j) and WP15 (k, l) 12-hour average θ e (negative values contoured, K) and horizontal wind velocities (m s−1) for 37°N latitude centred at 0000 UTC on 18 June. Pressure levels are shown in millibars.
In the RAMS dry simulations, lowering of SM resulted in higher θ e values near the surface with respect to CTRL (b, d and f). Regions of increased θ e as compared with CTRL can be observed over the western region of the domain for DP05 and DP10. On the other hand, DP15 presented a strong θ e gradient from 900 to 700 hPa from 86°W to 78°W. In this experiment, the eastern region in the simulation domain near the surface of DP15 domain was characterised by values of θ e greater than 6 K with respect to CTRL, while the western section was characterised by θ e values between 1 and 4 K greater than CTRL. A negative θ e difference was found on top of the largest θ e positive difference. Increases in SM resulted in θ e variations of less than 1 K over the study region. Overall, decreases in SM resulted in increased θ e throughout the middle-troposphere for MM5 and RAMS, while increases in SM produced little variation.
3.3.3. Vertical wind.
a–l summarises the 3-D modelled vertical wind changes between each sensitivity experiment and the CTRL simulation. Examinations of each MM5 simulation reveal that for this event, decreases of SM contributed to increased vertical wind speeds (a, c and e). MM5 DP05 produced the strongest vertical wind with vertical motions of up to 0.12 m s−1 with respect to CTRL and located at 92°W (a). This strong column of velocities extended up to 300 hPa. Increase of SM resulted in increased vertical velocities for all wet simulations with maxima greater than 0.12 m s−1 located at 92°W (g, i and k), where a precipitation maximum can be found at 37°N (e). However, compared to dry experiments, longitudinal extent of these large vertical velocities differences were much greater for wet experiments.
Fig. 9 MM5 EXP minus CTRL and RAMS EXP minus CTRL cross-sections for DP05 (a, b), DP10 (c, d), DP15 (e, f), WP05 (g, h), WP10 (i, j) and WP15 (k, l) 12-hour average vertical (negative values contoured) and horizontal wind velocities (m s−1) for 37°N latitude centred at 0000 UTC on 18 June. Pressure levels are shown in millibars.
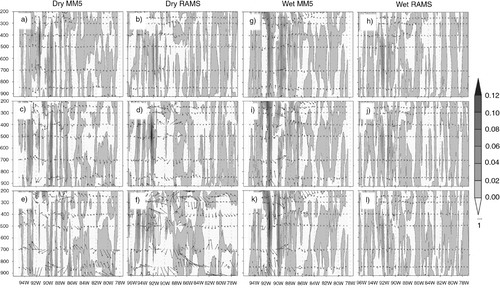
Fig. 10 MM5 EXP minus CTRL and RAMS EXP minus CTRL for DP05 (a, b), DP10 (c, d), DP15 (e, f), WP05 (g, h), WP10 (i, j) and WP15 (k, l) 12-hour average latent heat fluxes (Wm−2) and horizontal wind velocities (m s−1) centered at 0000 UTC on 18 June.
Furthermore, RAMS-DP10 produced regions of strong vertical velocities exceeding 0.12 m s−1 (d). Little variation is observed among the wet experiments with respect to vertical speeds and maxima differences locations. Both wet and dry experiment positioned a vertical velocity maximum with respect to CTRL at approximately 92°W with the exception of DP15 (f). Overall, decreases of up to 0.10 m3 m−3 in SM initial conditions enhanced vertical wind speeds for MM5 and RAMS. Subsequently, increases of SM also resulted in enhanced vertical wind speed for MM5 greater than 0.12 m s−1.
3.3.4. Latent heat flux.
Impacts of SM modifications on LE simulations are presented in a–l. As expected for MM5, lowering of SM resulted in decreased LE through the study region compared to CTRL. As seen in a, 0.05 m3m−3 decrease of SM reduced LE more than 100 Wm−2 with respect to CTRL over the western region of the simulation domain (a, c and e). Compared to CTRL, MM5 DP10 and DP15 experienced a similar amount of reduction in LE throughout most of the domain (c and e). MM5 wet experiments were generally characterised by positive LE greater than 100 Wm−2 compared to CTRL (g, i and k).
For RAMS, CTRL experiment produced up to 120 Wm−2 greater LE compared to DP05, DP10 and DP15 sensitivity experiments over large regions (b, d and f). These maxima shifted with the experiments and were mainly located over the eastern portion of the domain for DP15. RAMS WP05, WP10 and WP15 presented little sensitivity to changed SM (h, i and l). These wet experiments produced very small localised areas of LE up to 60 Wm−2 greater than CTRL.
Fig. 11 MM5 EXP minus CTRL and RAMS EXP minus CTRL for DP05 (a, b), DP10 (c, d), DP15 (e, f), WP05 (g, h), WP10 (i, j) and WP15 (k, l) 12-hour average sensible heat fluxes (Wm−2) and horizontal wind velocities (m s−1) centered at 0000 UTC on 18 June.
Overall, dry experiments decreased LE with respect to CTRL. This is expected since, typically, lower SM results in higher amounts of the radiative energy partitioned into sensible heat flux. Increases in SM enhanced LE for MM5 of up to 100 Wm−2, while little impact was noted for RAMS.
3.3.5. Sensible heat flux.
a–l shows impacts of SM modifications on H simulations by the MM5 and the RAMS. H under the MM5 dry experiments, particularly DP10 and DP15, were relatively sensitive to initial SM differences compared to CTRL (a, c and e). DP05 produced small regions along the Mississippi River and the Missouri–Illinois border, in which the experiment estimated greater H than CTRL. Decreases in SM resulted in regions where DP10 and DP15 experienced H greater than 120 Wm−2 with respect to CTRL. Wet MM5 experiments produced little to no variation of H with respect to CTRL (g, i and k). The WP05, WP10 and WP15 experiments estimated up to 40 Wm−2 less H compared to CTRL over a narrow area along the Mississippi River (~90–92°W).
RAMS DP05, DP10 and DP15 increasingly estimated larger areas of greater H with respect to CTRL (b, d and f). Wet simulations did not result in any notable changes in H compared CTRL.
Overall, compared to MM5, RAMS had greater sensitivity to decreases of SM when resolving H. However, RAMS simulated no changes in H for wet experiments while MM5 simulations found a decrease of up to 60 Wm−2 with respect to CTRL.
3.4. 22–23 June 2006
3.4.1. Precipitation and horizontal wind.
Both an increase and a decrease of SM initial conditions enhanced precipitation for the MM5 and RAMS simulations (a–i). As explained before, this has occurred for different reasons. MM5 DP05, DP10 and DP15 experiments simulated a region of increased precipitation over Indiana and northern Ohio (~40°N, 83–86°W) (a, c and e). These maxima were co-located with regions of decreased precipitation compared to CTRL. Wet experiments also simulated increased precipitation (g, i and k). However, visual inspection suggested that under wet experiments, the region was dominated by small pockets of precipitation differences.
Fig. 12 MM5 and RAMS CTRL 12-hour precipitation accumulation difference (EXP minus CTRL) and horizontal wind velocities (m s−1) centred at 0000 UTC 23 June for DP05 (a, b), DP10 (c, d), DP15 (e, f), WP05 (g, h), WP10 (i, j) and WP15 (k, l).
Compared to CTRL, RAMS dry simulations reduced precipitation maximum located over northern Missouri (b, d and f). However, these experiments also produced large areas with precipitation greater than CTRL, with accumulated differences greater 15 mm in some areas. In addition, RAMS DP15 experiment also notably enhanced precipitation over the southern part of the domain. RAMS wet experiments on the other hand, were less sensitive to SM changes: accumulated precipitation differences between the experiments and CTRL did not exceed 5 mm over the simulation domain.
MM5 wet and dry experiments simulated small differences in low levels of horizontal wind velocities between the experiments and the CTRL. However, RAMS DP10 and DP15 produced strong circulation over the region of maximum precipitation displacement (i.e. northern Missouri and Arkansas) with respect to CTRL. Low-level maximum wind speed differences were 1.0, 3.0 and 3.2 m s−1 for the DP05, DP10 and DP15 experiments, respectively. Increase of SM did not have notable impacts on the low-level horizontal wind velocities.
3.4.2. Equivalent potential temperature.
a–l show the difference between the dry and wet experiments and CTRL. MM5 DP05 experiment did not produce θ e greater than 2 K compared to CTRL (a). DP10 and DP15 simulated θ e values 3 and 6 K greater than CTRL (c and e). These θ e maxima were found at around 700 hPa and positioned across 92°W to 80°W. They marked the top of the PBL layer, which is characterised by strong differences of θ e . Wet experiments, in contrast, did not produce significant differences of θ e values with respect to CTRL and among each other (g, i and k). Overall, increases in SM resulted in θ e changes less than 1 K compared to CTRL.
Fig. 13 MM5 EXP minus CTRL and RAMS EXP minus CTRL cross-sections for DP05 (a, b), DP10 (c, d), DP15 (e, f), WP05 (g, h), WP10 (i, j) and WP15 (k, l) 12-hour average θ e (negative values contoured, K) and horizontal wind velocities (m s−1) for 37°N latitude centred at 0000 UTC on 18 June. Pressure levels are shown in millibars.
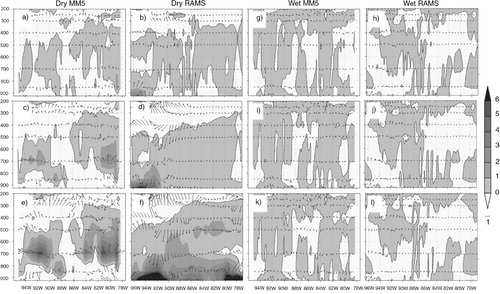
Decreases in SM resulted in notably modified θ e for the RAMS dry experiments compared to CTRL (b, d and f). DP05 and DP10 produced regions of increased θ e at 900 hPa between 96° and 92°W with respect to CTRL (b and d). In addition, compared to CTRL, DP15 also simulated up to 6 K greater θ e values for lower troposphere (f). Maximum differences of θ e for the RAMS DP10 and DP15 were collocated with precipitation maximum over the western part of the domain. An increase of SM produced little difference between wet experiments and CTRL and among them (h, j and l).
Overall, decreases in SM resulted in enhanced θ e from lower through mid-levels of the atmosphere for MM5 and RAMS. On the contrary, increases of SM produced θ e temperature increases less than 1 K in both models.
3.4.3. Vertical wind.
Decreases in SM produced increased vertical wind velocities at 84°W (not shown). This feature could be seen in DP10 and DP15, which produced vertical winds velocities greater than 0.08 and 0.10 m s−1, respectively, compared to CTRL. On the other hand, increases of SM increased vertical wind velocities for WP05 (not shown). Further increases of SM did not result in increased vertical wind velocities for WP10 and WP15, although the event experienced increases of up to 0.04 m s−1versus CTRL. These increases were co-located with increased precipitation.
Vertical wind estimated by RAMS wet and dry experiments responded somewhat similarly to MM5 simulations (not shown). DP05 simulated vertical wind velocity maxima between 700 and 400 hPa at 93° and 91°W. Decreases in SM resulted in increased vertical velocities for the eastern section of the domain for DP15. DP15 produced vertical wind velocities 0.04 m s−1 greater than CTRL between 81° and 78°W. These areas were collocated with high-precipitation areas. However, increase in SM also resulted in increase in vertical velocities greater than 0.06 m s−1 compared to CTRL for the WP05, WP10 and WP15 experiments. These maxima were located between 94° and 90°W.
Overall, decreases and increases of SM initial conditions resulted in increased vertical wind velocities for both models. These changes were associated with the location of maximum precipitation.
3.4.4. Latent heat flux.
The MM5 dry experiments revealed that decreases in SM resulted in an overall decrease of LE (not shown). For DP10 and DP15, LE differences are up to −120 Wm−2 compared to CTRL. While the MM5 wet simulations produced higher LE compared CTRL. However, magnitudes of these differences were not very large.
Similarly, RAMS dry experiments produced large regions of negative LE over the eastern and western edges of the domain (not shown). Overall, decreases of SM resulted in decreases less than 120 Wm−2 with respect to CTRL for DP10 and DP15. Response to increased SM was negligible under RAMS simulations.
Overall, in terms of magnitude and spatial distribution, RAMS was more sensitive compared to MM5 under decreased SM. This condition largely reverses under wet experiments.
3.4.5. Sensible heat flux.
Under MM5 dry experiments, H increased (up to 120 Wm−2) with decreasing SM while for MM5 wet experiments decreases in H could only be found over a few confined areas. Similar results were found for RAMS wet experiments. However, similar to the previous cases, RAMS was more sensitive to a decrease in SM.
4. Discussions and concluding remarks
This study assessed the response of two mesoscale models due to modified SM conditions. The study was conducted using the RAMS and the MM5 coupled with the LEAF2 and the NOAH-LSM, respectively. Three synoptic events were examined for June of 2006. The events presented varying synoptic forcing which ranged from weak to strong for 22–23 June, 11–12 June and 17–18 June, respectively. The suite of experiments for both mesoscale models consisted of six single simulations in which initial SM was increased (wet) and decreased (dry) from 0.05 to 0.15 m3 m−3 with a 0.05 m3 m−3 interval. There were a total of 42 simulations for both models. These included six CTRL simulations. Precipitation, θ e , 3-D wind velocities, and latent and sensible heat fluxes were examined for each event.
4.1. Key findings with regard to precipitation
Each CTRL simulation was compared with respect to NARR in order to assess the performance of each mesoscale model when simulating precipitation. Qualitatively, better agreement was noted between the models than to observations, with an overall overestimation. The RAMS and MM5 simulated a precipitation maximum extending from Illinois to North Carolina (E–W along ~38°W) for the event of June 11–12 (b and c). Only MM5 managed to capture the observed maximum over North Carolina (a). In addition, overall, eastern extent of simulated precipitation resembled NARR data while western extent was further west compared to the NARR data. Both models failed to accurately position the observed precipitation maximum over Illinois and Indiana observed on June 17–18. RAMS and MM5 simulated greater precipitation accumulation over north central and south central Arkansas and Missouri, respectively. They were located west of observed precipitation. For June 22–23, the MM5 and RAMS generally captured the precipitation spatial distribution although it was more widespread compared to NARR observations.
It was also evident from both sets of experiments that latent and sensible heat flux, vertical wind and equivalent potential temperatures were key variables linked to development of precipitation. Location and amount of precipitation under various SM conditions were collocated with changes in vertical motion, heat fluxes and equivalent potential temperatures. More specifically, for example, modified SM allowed vertical transfer of latent (moisture) and sensible heat fluxes, which eventually led to precipitation. These findings are in line with our theoretical understanding of mesoscale precipitation development (e.g. Pielke, Citation2001; Findell and Eltahir, Citation2003; Taylor and Ellis, Citation2006; Hohenegger et al., 2009; Senevirante et al., Citation2010) and previous findings from our own studies (Quintanar et al., Citation2008, Citation2009; Quintanar and Mahmood, Citation2012).
Like Quintanar et al. (Citation2008) and Quinatanar and Mahmood (Citation2012), increases in SM conditions initially increased precipitation for all three events. Dry experiments presented the larger changes in precipitation accumulation and spatial distribution with respect to the CTRL runs for both RAMS and MM5. They were also consistent with other studies (e.g. Gallus and Segal, Citation2000; Jones and Brunsell, 2009). It was found in the observation and model-based studies that dry or wet condition could provide both negative (Taylor and Ellis, Citation2006) or positive feedback (e.g. Jones and Brunsell, 2009). Findell and Eltahir (Citation2003) noted that wet condition could result in higher equivalent potential temperature (moistening of atmosphere) leading to lowering of level of free convection (LFC) to the top of the PBL height and initiation of convection. We suggest that these were the primary mechanisms for increased precipitation for wet condition.
On the other hand, under dry SM condition here and as suggested by Findell and Eltahir (Citation2003), a growing PBL and its increasing height associated with increased sensible heat flux allowed PBL top to reach the LFC leading to convection development and precipitation. Of course, if soil is too dry then this assertion does not hold (e.g. Senevirante et al., Citation2010).
Previously, Quintanar and Mahmood (Citation2012) analysed simulations from the MM5 to further understand the mechanisms that led to changes in precipitation. They have reported that differences between PBL and LCL and between PBL and LFC became smaller with convective development. However, these changes were not as large as shown by Findell and Eltahir (Citation2003). It was suggested that larger synoptic influence (versus localised convective events) removed some of these signatures (Quintanar and Mahmood, Citation2012).
As noted before, both models were less sensitive to increases of SM when simulating precipitation because the domain was already too wet for CTRL condition. This is also consistent with findings of Quintanar et al. (Citation2008, Citation2009) and Quintanar and Mahmood (Citation2012). During each event, the initial SM conditions were relatively high ranging from 0.28 to 0.36 m3m−3 for most of the domain (not shown). Note the average field capacity through the region is 0.42 m3m−3. Thus, increases beyond this threshold were not considered by the models. In contrast, decreases in initial SM allowed the soil to become drier, further affecting the response of the models. Since, soil was wet initially, drying provided sufficient instability through enhanced sensible energy partitioning.
In addition, despite differences in estimation of precipitation, fluxes and vertical wind under different SM conditions, both models generally agreed in terms of magnitude and direction (increased, decreased) of their responses due to SM changes. Thus, models’ accuracy or uncertainty is comparable. Moreover, these agreements between MM5 and RAMS provide further confidence in our previous understanding of land surface coupling linked to SM changes.
A summary of differences in modelled quantities, by the MM5 and the RAMS, of equivalent potential temperatures, energy fluxes and vertical wind are given below.
4.2. Key findings with regard to equivalent potential temperature
A decrease of SM resulted in increased θ e for both MM5 and RAMS experiments at low- and mid-levels of the atmosphere. For MM5, the θ e differences maxima between the experiments and CTRL were located at 700 hPa. On the other hand, RAMS dry experiments presented the largest changes between 900 and 700 hPa. Overall, decreases of SM did not produce significant variations of θ e near the surface for MM5 dry experiments while RAMS produced significant increases of θ e near the surface between 94°W and 91°W for all events with respect to CTRL. However, MM5 and RAMS simulations were not very sensitive to increases of SM with regard to θ e . Again, as noted above, this is linked to high initial SM condition.
4.3. Key findings with regard to vertical wind
Overall, decreases in SM were conducive to increased vertical wind speeds. This was observed in both mesoscale models for all three events examined. However, moderate increases of SM also produced increased vertical wind speeds. This phenomenon was observed for all events simulated by MM5. RAMS was less sensitive to increase of SM compared to MM5.
4.4. Key findings with regard to latent and sensible heat flux
Decreased SM resulted in decreased LE and increased H, and vice versa. Both models were more sensitive to drying of soils than wetting. As noted above, it was linked to high initial SM. In addition, the RAMS simulations of LE and H were more sensitive to drying and less sensitive to wetting compared to the MM5.
In summary, this comparative study has improved our understanding of the differences in model (i.e. MM5 and RAMS) sensitivity to SM modifications of precipitation and precipitation-related variables. We recommend additional comparative studies that include other mesoscale models under variety of conditions and with a number of different model initialisation data sets to further understand and quantify relative model sensitivity.
Acknowledgements
The authors would like to thank two anonymous reviewers for their valuable comments which helped to improve this paper. This work is funded by the USDA grant #58-6445-6-068. It also benefitted from an NSF grant #UKRF 3048032200-07-248 and an NSF-EPSCoR grant. R.A. Pielke Sr. received support through the University of Colorado in Boulder (CIRES/ATOC) and from NSF Grant AGS-1219833.
Related Research Data
References
- Baik J , deMaria M , Rahman S . Tropical cyclone simulations with the Betts convective adjustment scheme. Part III: comparisons with the Kuo convective parameterization. Mon. Wea. Rev. 1991; 119: 2889–2899.
- Baker R. D , Lynn B. H , Boone A , Tao W. T , Simpson J . The influence of SM, coastline curvature, and land-breeze circulation on sea-breeze-initiated precipitation. J. Hydrometeor. 2001; 2: 193–211.
- Beljaars A. C. M , Viterbo P , Miller M. J , Betts A. K . The anomalous rainfall over the United States during July 1993: sensitivity to land surface parameterization and SM anomalies. Mon. Wea. Rev. 1996; 124: 362–383.
- Betts A. K , Ball J. H , Beljaars A. C. M , Miller M. J , Viterbo P. A . The land surface–atmosphere interaction: a review based on observational and global perspectives. J. Geophys. Res. 1996; 101: 7209–7225.
- Chen C , Cotton W. R . The physics of the marine stratocumulus-capped mixed layer. J. Atmos. Sci. 1987; 44: 2951–1977.
- Chen F , Duhia J . Coupling and advanced land surface-hydrology model with the Penn State-NCAR MM5 modeling system part I: model implementation and sensitivity. Mon. Wea. Rev. 2001; 129: 569–585.
- Cotton W. R , Pielke R. A , Walko R. L , Liston G. E , Tremback C. J , co-authors . RAMS 2001: current status and future directions. Meteorol. Atmos. Phys. 2003; 82: 5–59.
- Cox R , Bauer B. L , Smith T . A mesoscale model intercomparison. Bull. Am. Meteorol. Soc. 1998; 79: 265–283.
- Douglas E. M , Beltran-Przekurat A , Niyogi D , Pielke Sr R. A , Vorosmarty C. J . The impact of agricultural intensification and irrigation on land–atmosphere interactions and Indian monsoon precipitation—A mesoscale modeling perspective. Glob. Planet. Chang. 2009; 67: 117–128.
- Douville H , Chauvin F , Broqua H . Influence of SM on the Asian and African Monsoons. Part I: mean monsoon and daily precipitation. J. Clim. 2001; 14: 2381–2403.
- Dudhia J . Numerical study of convection observed during the winter monsoon experiment using a mesoscale two-dimensional model. J. Atmos. Sci. 1989; 46: 3077–3107.
- Ek M , Holstag A. A. M . Influence of SM on boundary layer development. J. Hydrometeor. 2004; 5: 86–99.
- Ek M , Mahrt L . Daytime evolution of relative humidity at the boundary layer top. Mon. Wea. Rev. 1994; 122: 2709–2721.
- Eltahir E. A. B . A soil moisture–rainfall feedback mechanism: theory and observations. Water Resour. Res. 1998; 34: 765–776.
- Fennessy M. J , Shukla J . Impact of initial soil wetness on seasonal atmospheric prediction. J. Clim. 1999; 12: 3167–3180.
- Findell K. L , Eltahir E. A. B . Atmospheric controls on soil moisture–boundary layer interactions. Part I: framework development. J. Hydrometeor. 2003; 4: 552–569.
- Gallus W. A Jr. , Segal M . Sensitivity of forecasted rainfall in a Texas convective system to soil moisture and convective parameterization. Weather Forecast. 2000; 15: 509–525.
- Hohenegger C , Brockhaus P , Bretherton C. S , Schär C . The soil moisture–precipitation feedback in simulations with explicit and parameterized convection. J. Clim. 2009; 22: 5003–5020.
- Hong S.-Y , Pan H.-L . Nonlocal boundary layer vertical diffusion in a medium-range forecast model. Mon. Wea. Rev. 1996; 124: 2322–2339.
- Houser P. R , Shuttleworth W. J , Famiglietti J. S , Gupta H. V , Syed K. H , co-authors . Integration of SM remote sensing and hydrologic modeling using data assimilation. Water Resour. Res. 1998; 34: 3405–3420.
- Jones A. R , Brunsell N. A . A scaling analysis of soil moisture-precipitation interactions in a regional climate model. Theor. Appl. Climatol. 2009; 98: 221–235.
- Kain J. S . The Kain-Fritsch convective parameterization: an update. J. Appl. Meteorol. 2004; 43: 170–181.
- Kain J. S , Fritsch M . Convective parameterization for mesoscale models: the Kain-Fritsch scheme. Meteorol. Monogr. 1993; 24: 165–170.
- Kuo H. L . Further studies of the parameterization of the influence of cumulus convection on large-scale flow. J. Atmos. Sci. 1974; 31: 1232–1240.
- Kuo Y.-H , Reed R. J , Liu Y . The ERICA IOP 5 storm. Part III: mesoscale cyclogenesis and precipitation parameterization. Mon. Wea. Rev. 1996; 124: 1409–1434.
- Leeper R , Mahmood R , Quintanar A. I . Near-surface atmospheric response to simulated changes in land-cover vegetation fraction, and soil moisture over Western Kentucky. Publ. Climatol. 2009; 62: 41.
- Leeper R , Mahmood R , Quintanar A. I . Influence of karst landscape on planetary boundary layer atmosphere: a Weather Research and Forecasting (WRF) model-based investigation. J. Hydrometeorol. 2011; 12: 1512–1529.
- Luo Y , Berbery E. H , Mitchell K. E . The operational Eta model precipitation and surface hydrologic cycle of the Columbia and Colorado Basins. J. Hydrometeor. 2005; 6: 341–370.
- Mahmood R , Leeper R , Quintanar A. I . Sensitivity of planetary boundary layer atmosphere to historical and future changes of land use/land cover, vegetation fraction, and soil moisture in Western Kentucky, USA. Glob. Planet. Change. 2011; 78: 36–53.
- Messinger F , DiMego G , Kalnay E , Mitchell K , Shafran P. C , co-authors . North American regional reanalysis. Bull. Am. Meteorol. Soc. 2006; 87: 343–360.
- Ookouchi Y , Segal M , Kessler R. C , Pielke R. A . Evaluation of soil moisture effect on the generation and modification of mesoscale circulation. Mon. Wea. Rev. 1984; 112: 2281–2292.
- Patra P. K , Santhanam M. S , Potty K. V. J , Tewari M , Rao P. L. S . Simulation of tropical cyclones using regional weather prediction models. Curr. Sci. 2000; 79: 70–78.
- Pereira Fo A. J , Crawford K. C , Stensrud D. J . Mesoscale precipitation fields. Part II: hydrometeorology modeling. J. Appl. Meteorol. 1999; 38: 102–125.
- Pielke R. A . Influence of the spatial distribution of vegetation and soils on the prediction of cumulus convective rain. Rev. Geophys. 2001; 39: 151–177.
- Pielke R. A , Cotton W. R , Walko R. L , Tremback C. J , Lyoons W. A , co-authors . A comprehensive meteorological modeling system – RAMS. Meteorol. Atmos. Phys. 1992; 49: 69–91.
- Pielke Sr R. A . Mesoscale Meteorological Modeling. 3rd ed . 2013; San Diego, USA: Academic Press. 709.
- Pirovano G , Coll I , Bedogni M , Alessandrini S , Costa M. P , co-authors . On the influence of meteorological input on photochemical modeling of a severe episode over a coastal area. Atmos. Envion. 2007; 41: 6445–6464.
- Pitman A. J , Narisma G. T , Pielke Sr R. A , Holbrook N. J . Impact of land cover change on the climate of southwest Western Australia. J. Geophys. Res. 2004; 109: 18109.
- Quintanar A. I , Mahmood R . Ensemble forecast spread induced by soil moisture changes over mid-south and neighbouring mid-western region of the USA. Tellus A. 2012; 64
- Quintanar A. I , Mahmood R , Loughrin J , Lovanh N. C . A coupled MM5-NOAH land surface model-based assessment of sensitivity of planetary boundary layer variables to anomalous soil moisture conditions. Phys. Geogr. 2008; 29: 54–78.
- Quintanar A. I , Mahmood R , Motley M. V , Yan J , Loughrin J , co-authors . Simulation of boundary layer trajectory dispersion sensitivity to soil moisture conditions: MM5 and Noah-based investigation. Atmos. Environ. 2009; 43: 3775–3785.
- Sen Roy S , Mahmood R , Quintanar A. I , Gonzalez A . Impacts of irrigation on dry season precipitation in India. Theor. Appl. Climatol. 2011; 104: 193–207.
- Saleeby S. M , Cotton W. R . Simulation of the North American monsoon systems. Part I: model analysis of the 1993 monsoon season. J. Clim. 2004; 17: 1997–2018.
- Senevirante S. I , Corti T , Davin E. L , Hirschi M , Jaeger E. B , co-authors . Investigating soil-moisture climate interactions in a changing climate: a review. Earth Sci. Rev. 2010; 99: 125–161.
- Sutton C , Hamill T. M , Warner T. T . Will perturbing SM improve warm-season ensemble forecasts? A proof of concept. Mon. Wea. Rev. 2006; 134: 3174–3188.
- Taylor C. M , Ellis R. J . Satellite detection of soil moisture impacts on convection at the mesoscale. Geophys. Res. Lett. 2006; 34: 03404.
- Tremback C. J . Numerical Simulation of a Mesoscale Convective Complex: Model Development and Numerical Results.
- Tremback C. J . Numerical Simulation of a Mesoscale Convective Complex: Model Development and Numerical Results.
- Weaver C. P . Coupling between large-scale atmospheric processes and mesoscale land-atmosphere interactions in the U.S. Southern great plains during summer. Part I: case studies. J. Hydrometeor. 2004; 5: 1223–1246.
- Yang M , Chien F , Cheng M . Precipitation parameterization in a simulated Mei-Yu front. TAO, . 2000; 11(2): 393–422.
- Zhong S , Fast J . An evaluation of the MM5, RAMS, and Meso-Eta models at sub-kilometer resolution using VTMX field campaign data in the Salt Lake Valley. Mon. Wea. Rev. 2003; 131: 1301–1321.