
Abstract
Lake Surface Water Temperature (LSWT) observations are used to improve the lake surface state in the High Resolution Limited Area Model (HIRLAM), a three-dimensional numerical weather prediction (NWP) model. In this paper, satellite-derived LSWT observations from the Moderate Resolution Imaging Spectroradiometer (MODIS) and the Along-Track Scanning Radiometer (AATSR) are evaluated against in-situ measurements collected by the Finnish Environment Institute (SYKE) for a selection of large- to medium-size lakes during the open-water season. Data assimilation of these LSWT observations into the HIRLAM is in the paper Part II. Results show a good agreement between MODIS and in-situ measurements from 22 Finnish lakes, with a mean bias of −1.13°C determined over five open-water seasons (2007–2011). Evaluation of MODIS during an overlapping period (2007–2009) with the AATSR-L2 product currently distributed by the European Space Agency (ESA) shows a mean (cold) bias error of −0.93°C for MODIS and a warm mean bias of 1.08°C for AATSR-L2. Two additional LSWT retrieval algorithms were applied to produce more accurate AATSR products. The algorithms use ESA's AATSR-L1B brightness temperature product to generate new L2 products: one based on Key et al. (Citation1997) and the other on Prata (Citation2002) with a finer resolution water mask than used in the creation of the AATSR-L2 product distributed by ESA. The accuracies of LSWT retrievals are improved with the Key and Prata algorithms with biases of 0.78°C and −0.11°C, respectively, compared to the original AATSR-L2 product (3.18°C).
1. Introduction
Lake surface temperature observations collected by space-borne thermal sensors are increasingly being used in climate- and weather-related investigations (e.g. Schneider et al., Citation2009; Duguay et al., Citation2011, Citation2012a, Citation2013; Kheyrollah Pour et al., Citation2012). Knowledge of Lake Surface Water/Ice-Snow Temperature (LSWT/LIST) is important for coupling the lake surface with the atmosphere in order to better represent exchanges of heat and moisture. Satellite remote sensing platforms can provide the LSWT/LIST observations required for this purpose. As thermal sensors are limited in terms of temporal consistency due to the presence of cloud cover, which hinders surface observations, a scientific priority is to seek the best combination of tools such as space-borne observations, in-situ measurements, and numerical models to optimize the information content of LSWT/LIST data using data assimilation methods.
The Moderate Resolution Imaging Spectroradiometer (MODIS) aboard NASA's Aqua and Terra Earth Observation System (EOS) satellites (2000–present) and the Along-Track Scanning Radiometer (AATSR) onboard the European Space Agency (ESA) environmental satellite ENVISAT (2002–2012) have been two of the main sensors providing land and lake surface temperature observations since 2000. The MODIS sensor, launched on Terra (EOS AM, 18 December 1999) and Aqua (EOS PM, 4 May 2002), scans the Earth surface at ±55° viewing angle from nadir in 36 bands with 16 thermal infrared (TIR) bands located in the 3–15 µm range. MODIS-derived Level 2 surface temperature products (MOD/MYD 11-L2, Collection 5, each pixel is 1 km×1 km in size) have been validated in various studies over lakes against in-situ measurements acquired during the open-water season. The reported accuracies vary depending on the evaluation method employed (i.e. direct LSWT measurements with thermometers at some depth near the surface or non-contact, skin, LSWT measurements with TIR radiometers) and the observational periods (i.e. hourly, daytime, nighttime or average daily). Biases of −0.22°C for daytime and −0.39°C for nighttime observations have been reported for MODIS-Terra over Lake Tahoe (California/Nevada, USA) during 2002–2005 (Hook et al., Citation2007) and a bias of 0.1°C for nighttime observations in 2000–2008 (Schneider et al., Citation2009). A validation study conducted over the same lake by Hulley et al (Citation2011) showed a bias of −0.21°C and 0.064°C for daytime and nighttime observations (2002–2010 period), respectively, for both MODIS-Aqua/Terra L2 products. Crosman and Horel (Citation2009) reported a bias of −1.5°C between MODIS L2 (combined daytime and nighttime observations) and in-situ water temperature measurements from Great Salt Lake (Utah, USA) obtained at a depth of 0.5 m. The larger bias from the study of Crosman and Horel (Citation2009) is expected since their in-situ measurements correspond to a bulk water temperature (0.5 m depth) rather than a surface (skin) temperature which is the quantity retrieved from MODIS and measured with TIR radiometers deployed in the field (e.g. Hook et al., Citation2007; Schneider et al., Citation2009; Hulley et al., Citation2011).
The AATSR, which operated on the ENVISAT satellite until April 2012, crossed the equator at 10:00 A.M. local time for the descending orbit. AATSR acquired data in seven bands from visible to infrared with TIR bands centred at 10.85 and 12 µm. The sensor scanned the Earth with a dual view (i.e. forward view at an angle of around 55° and the nadir view at an angle of around 21.7°). The nominal spatial resolution of the AATSR is 1 km for the nadir view and 1.5 km×2 km for the forward view. Coll et al. (Citation2009) evaluated the accuracy of LSWT retrieved with the algorithm of Prata (Citation2002) (described in Section 2.1.2), based on AATSR Level-1B (L1B) brightness temperature observations over Lake Tahoe between July–December 2002 and July 2003. The authors reported an average bias of −0.17°C and standard deviation (SD) of 0.37°C for both daytime and nighttime observations.
The purpose of this study is to assess the accuracy of a relatively new Level 3 (L3) LSWT product (referred to here onward as UW-L3 LSWT), generated from the combination of Terra and Aqua (MOD/MYD11_L2) observations, as well as ESA's current AATSR-L2 data product and two new AATSR-L2 products derived from algorithms proposed by Key et al. (Citation1997) and Prata (Citation2002), which make use of an improved lake mask over Finland. The acronym UW-L3 (University of Waterloo-Level 3) is used to describe the MODIS LSWT product utilized in this paper as it differs from the L3 product distributed by NASA. The UW-L3 LSWT/LIST product has previously been compared with surface water/ice temperature outputs from 1-D lake models (Kheyrollah Pour et al., Citation2012; Cheng et al., Citation2014). Kheyrollah Pour et al (Citation2012) showed a good agreement between daily averaged MODIS-derived and simulated [using Canadian Lake Ice Model (CLIMo)] LSWT/LIST for different depths in Great Bear Lake and Great Slave Lake, Northwest Territories, Canada, [mean bias error (MBE) of less than 1°C] when compared over a full annual cycle or broken down into open-water and ice-cover seasons. Cheng et al (Citation2014) evaluated MODIS temperature observations with in-situ [snow and ice temperatures measured by an ice mass balance buoy (SIMB)] and simulated snow/ice model (HIGHTSI) LIST in three ice-cover seasons (2009–2012). They showed that MODIS observations agree with SIMB (R=0.9, MBE=−3.1°C) and HIGHTSI (R=0.9, MBE=3.2°C) results. This study differs from previous investigations since it is the first time that the UW-L3 LSWT product is evaluated against in-situ LSWT/LIST measurements.
The study area for this investigation covers a large domain, which encompasses many lakes in Finland ( and ), and therefore addresses the need of continuous lake temperature measurements to improve the forecast of weather phenomena in this region. This paper is the first of a series of two articles that describe our recent efforts aimed at improving the treatment of lake surface state in the HIgh Resolution Limited Area Model (HIRLAM) numerical weather prediction (NWP) system. In the study described herein, in-situ measurements of lake water temperature collected by the Finnish Environment Institute [Suomen Ympäristökeskus (SYKE)] are compared to MODIS- and AATSR-derived LSWT products to investigate the bias of satellite observations for a selection of large to medium-size lakes in Finland. SYKE and satellite-derived LSWT observations are then applied in the analysis of the HIRLAM NWP system (Undén et al., Citation2002; Eerola Citation2013) in the Part II paper (Kheyrollah Pour et al., Citation2014) using the optimal interpolation (OI) method. Part II develops the OI method and discusses analysis results of time-series of observed, analyzed and predicted LSWT, and ice cover obtained by applying MODIS/AATSR/SYKE observations and a lake parameterization scheme, the FLake model (Mironov, Citation2008; Mironov et al., Citation2010).
Fig. 1 Location of lakes within the HIRLAM domain over Northern Europe and selected lakes (dark blue) from SYKE's in-situ measurement sites in Finland.
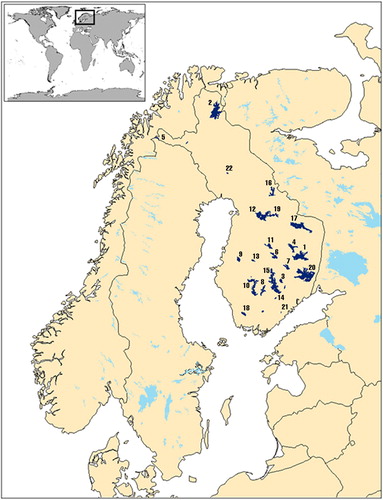
Table 1. List of 22 selected Finnish lakes with coordinates, mean depth and statistics of the evaluation results for MODIS
2. Data and methods
2.1. Satellite observations
The reliability of MODIS and AATSR LSWT products was assessed using in-situ water temperature measurements from Finnish lakes. The MODIS UW-L3 daily averaged product was evaluated against SYKE observations from 22 lakes over five open-water seasons (2007–2011), as well as during an overlapping period (2007–2009) along with AATSR-L2 products. Being onboard of two satellite platforms (Aqua and Terra), MODIS provides a greater temporal coverage than AATSR (Soliman et al., Citation2012).
2.1.1. MODIS LSWT.
MODIS-Aqua and Terra Land Surface Temperature (LST) and Emissivity (MYD/MOD 11-L2, Collection 5, 1 km) products were acquired from the NASA Land Processes Distributed Active Archive Center (LP DAAC) for the period 2007–2011. The products are generated with the generalized split window approach (Wan and Dozier, Citation1996) using the MODIS sensor radiance data (MYD/MOD021KM), the geolocation (MYD/MOD03), the atmospheric temperature and water profile (MYD/MOD07_L2), the cloud mask (MYD/MOD35_L2), the quarterly land cover (MYD/MOD12Q1), and the snow cover (MYD/MOD10_L2) products. The Land/Lake surface temperature retrieval in a MODIS swath is made by using L1B radiance data in thermal bands 31 and 32 on land or inland water, under clear-sky conditions with a confidence of ≥66% over lakes (Wan et al., Citation2004).
MODIS UW-L3 LST (Soliman et al., Citation2012; Duguay et al., Citation2012b) and LSWT/LIST products (Kheyrollah Pour et al., Citation2012) are generated from Aqua and Terra MYD/MOD 11-L2 data. A new algorithm was developed to create products at various temporal resolutions (daily, weekly, and monthly) from the combination of MODIS data from the Aqua and Terra satellites, which were not available otherwise. The Aqua and Terra satellite platforms follow the same orbit within 3 hours of each other. However, at higher latitudes, it is possible to monitor the same location from both sensors within an hour, considering different viewing angles. In such case, it is feasible to combine observations from both sensors in each pixel during an hour. For the daily averaged UW-L3 product, observations are separated into either a daytime bin (from 6 A.M. to 6 P.M.) or a nighttime bin (from 6 P.M. to 6 A.M. of the next day), not by solar angle such as the number of hours of daylight and darkness. To ascertain a balance between daytime and nighttime observations in the creation of the daily averaged product, pixels must contain at least one daytime observation and one nighttime observation for a daily value to be calculated. For the geographical region of interest, two sets of data are produced, one containing the average of all daytime observations and the other containing those of all nighttime observations. Then, the intermediate sum of all MODIS-Aqua/Terra daytime/nighttime observations for each pixel is calculated. These values are averaged together to produce the final surface temperature average with equal weighting between daytime and nighttime values. Daytime average, nighttime average, daily average and the number of clear-sky observations (counts) are recorded in separate images for each pixel during the period of interest as GEOTIFF files (GEOTIFF refers TIFF data format, which contains geographic information embedded within the TIFF file).
The Equal-Area Scalable Earth Grid (EASE-Grid), Lambert's Equal-Area Azimuthal projection is the projection selected for the UW-L3 product, based on a sphere datum with a radius of 6371.228 km. Each domain is split into approximately square tiles, which are re-projected to the EASE-Grid projection. The EASE-Grid projection consists of a set of three equal-area projections and developed at the National Snow and Ice Data Center (NSIDC) for the distribution of snow and ice products. It is intended to be a flexible tool for users of global scale gridded data. The re-projection is carried out by first calculating the projection coordinates of each observation, and then by using linear interpolation to calculate a value for the centre of each EASE-Grid cell. Tiles of the selected regions of interest are then projected onto the target grid with the desired output resolution (1 km for this study) by averaging all pixels that fall into the target grid cell. Local time is calculated for each EASE-Grid cell using UTC acquisition time and longitude of MODIS L2 products with an accuracy of±15 minutes.
2.1.2. AATSR LSWT.
The current AATSR-L2 (land and lake) product distributed by ESA is generated from AATSR-L1B data based on the algorithm of Prata (Citation2002). The basic algorithm for the retrieval of surface temperature is:1 where a
0, b
0, and c
0 are coefficients that depend on the surface type (including lakes), viewing angle, and atmospheric water vapour. T
11 and T
12 represent the brightness temperature values in channels 11 and 12, respectively. The L2 algorithm expresses the surface temperature as a nearly linear combination of the brightness temperatures in each channel using only the nadir view (θ<21.7°); therefore the equation is modified as:
2 where the index n depends on the incident angle θ as follows:
3 where m is an empirical constant. Coefficients for [eq. (2)] were determined for 13 different land cover classes including lakes, in which two separate sets of coefficients are specified for each class. For the lake class, different coefficients are given for day and night. However, in this study, only day coefficients are used due to the AATSR morning overpass for Finnish lakes (a
0=−0.0005, b
0=2.4225, c
0=−1.4344). The algorithm operates using a low-resolution (0.5°×0.5°) map of land cover classes. Due to this coarse-resolution land cover type map, the algorithm misses many small to medium-size lakes. These lakes are often confounded with land. As a result, evaluation of this product was only possible for 11 of the 22 lakes monitored by SYKE.
To improve the currently available AATSR-L2 product, two additional algorithms were implemented from ESA's AATSR-L1B brightness temperature data using a finer resolution lake mask in order to minimize the possibility of land contamination (mixed land-water pixels) within the 1 km spatial resolution pixels of the AATSR satellite sensor (i.e. identify pure lake water pixels located as close as possible to the in-situ water temperature measurement sites). For this purpose, the Global Lakes and Wetlands Database (GLWD) data (~1 km2 resolution) was applied over satellite images as the lake mask (Lehner and Doell, Citation2004) when selecting the pixels on each lake for evaluation.
More specifically, algorithms presented in Key et al. (Citation1997) and Prata (Citation2002) were applied on the AATSR-L1B product to derive new AATSR-L2 products (AATSR-L2-PR; PR stands for Prata Revised and AATSR-L2-NCC; NCC referring to the Norwegian Computing Center), and then evaluated against SYKE observations for the month of August 2009. The Prata algorithm described above [eq. (2)] was used to derive LSWT for each pixel from top-of-the-atmosphere cloud-free, calibrated and navigated day and night AATSR-L1B brightness temperatures. Regression coefficients for LSWT have been developed by analysis of a set of in-situ radiometric measurements made in a previous study on Lake Tahoe in 1999. The anticipated accuracy of the algorithm is ±0.3°C (Prata, Citation2002).
In addition to the AATSR-L2-PR, AATSR-L2-NCC was generated following the algorithm proposed by the Key et al. (Citation1997) for the ATSR sensor (the predecessor of AATSR). For surface temperature retrieval, Key's algorithm uses both nadir and forward viewing angles, and is expressed as follows:4 where a
0, b
0, c
0, d
0 and e
0 are coefficients derived for different temperature ranges (T
11<240 K, 240 K <T
11<260 K, T
11>260 K) rather than the defined seasons to provide greater flexibility of the algorithm (a
0=−0.56158, b
0= 2.23152, c
0=−0.91817, d
0=−0.40756, and e
0= 0.09610).
The Key algorithm has previously been implemented by Amlien and Solberg (Citation2003) and Solberg et al (Citation2011) as part of a snow processing chain for snow surface temperature retrieval as well as temperature of melting snow in mountainous areas of southern Norway using ESA's AATSR-L1B data. As snow, water and ice have similar emissive properties, the same approach was used for the retrieval of LSWT. The AATSR-L1B data are geo-corrected and corrected for radiometric drift. Similar to the generation of the AATSR-L2-PR product, a lake mask was also applied, defining the regions of surface temperature retrieval. The mask was produced from vector data provided by SYKE containing all large Finnish lakes. The lake mask was then eroded using a 3×3 kernel so that the lakes in the mask were somewhat smaller than the actual lakes. This was done in order to avoid evaluating mixed pixels, containing fractions of water and land along shorelines.
2.2. In-situ lake water temperature measurements
There are 187 888 lakes in Finland with a surface area larger than 500 m2. The lakes cover 9% of the land surface. SYKE regularly measures lake water temperature at 32 sites on a selection of these lakes. The water temperature measurements are recorded every morning at 8.00 A.M. local time, close to shore and at a depth of 0.2 m below the water surface. In this study, 22 observation sites were utilized. The selection of sites was based on the location of in-situ measurements to be compared with the satellite-derived LSWT pixel values. The measurements from SYKE are either made automatically (13 stations) or manually and are performed only during the open-water season (ice-free conditions) (Rontu et al., Citation2012). The in-situ lake water temperature observations from SYKE were also assimilated into HIRLAM experimental model runs in paper Part II (Kheyrollah Pour et al., Citation2014). The location of the lakes is shown in and the coordinates are listed in .
2.3. Evaluation of satellite-derived LSWT products
The lakes were selected on the basis of their size and the ability to select a pure pixel (1 km×1 km) from the satellite images. Pixels were chosen manually over each lake considering only lake water and to avoid land contamination. Since most of the in-situ measurements are made close to the shore, it was not possible to select pixels at exactly the same location as the SYKE measurements. Therefore, it is expected that a systematic error will result from the comparison between the satellite-derived LSWT observations (middle of the lake) and the in-situ water temperatures (closer to shore, which is warmer than middle of the lake in early spring and colder in autumn).
The MBE, root mean squared error (RMSE), and SD were calculated from the comparison of the satellite-derived LSWT from MODIS and AATSR and in-situ water temperature measurements from SYKE for the various time periods and sites described in the previous section. Before discussing the evaluation results, a few general remarks are needed with regards to the accuracy of the in-situ and the satellite observations.
The LSWT values within each satellite pixel represent an average value over a 1 km2 area while the in-situ water temperature measurements are limited spatially (i.e. point observations).
The in-situ measurements were usually taken close to shore or sometimes on a river channel connected to the lake (see the location of in-situ and satellite pixels in ). The MODIS and AATSR pixels were chosen as close as possible to the location of SYKE observations, but far enough to prevent land contamination. Therefore, the satellite pixels and in-situ measurements are not from the exact same location.
The in-situ measurements represent the lake water temperature taken at 0.2 m below the water surface. The satellite observations, however, provide a ‘skin’ temperature of the lake water surface. Since the outgoing and incoming long-wave radiation as well as sensible and latent heat fluxes add or remove heat directly from the top few microns of the lake surface, the water temperature across the sub-layer (~2 mm) tends to be colder than the bulk temperature.
SYKE lake water temperature measurements are made every morning at 8.00 A.M. local time, which is not the exact time as the satellite overpasses over the studied lakes.
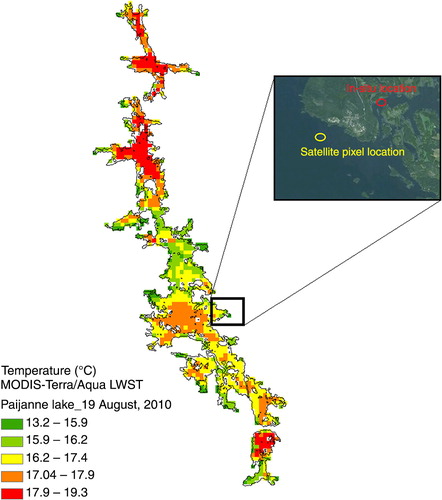
Fig. 2 Map showing combined MODIS-Aqua/Terra LSWT of Lake Päijänne (August 19, 2010) and the location of MODIS and SYKE observations used for comparison.
3. Results
3.1. Comparison between MODIS UW-L3 product and in-situ measurements
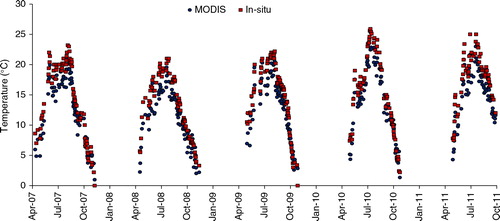
The quality of the daily averaged UW-L3 MODIS LSWT product was evaluated against SYKE temperature recordings for 22 lakes over the open-water season from 2007 to 2011. The MBE, RMSE and the number of observations (n) for each site are summarized in . The MBE values for all 22 lakes show a minimum of −0.25°C for Lake Tussu and maximum of −1.87°C for Lake Inari, and the RMSE cover the range of 1.98–2.39°C for Lake Konnevesi and Lake Pielinen, respectively. A temperature map produced from the combination of MODIS-Aqua/Terra data on August 19, 2010 and the time series of LSWT from MODIS and SYKE data for Lake Päijänne (2007–2010) are shown in and , respectively, as an example of one site. Lake Päijänne was chosen to show a case when the location of the in-situ measurement and the satellite pixel selected are not close to each other (). On August 19, 2010, Lake Päijänne had a mean LSWT of 16.2°C (LSWTmin=13.2°C and LSWTmax=19.3°C) as retrieved from MODIS-Aqua/Terra, over the entire lake. The selected pixel (61.613 N, 25.282 E) from MODIS on the same day had a temperature value of 16.8°C, which was recorded to be 20.1°C by SYKE. Due to the same limitation, Lake Päijänne and Lake Inari, both have the largest MBE of −1.84 and −1.87°C (SD=1.46 and 1.36°C), respectively ().
Fig. 3 Time-series of MODIS-Aqua/Terra LSWT versus SYKE at Lake Päijänne during open-water season (2007–2011).
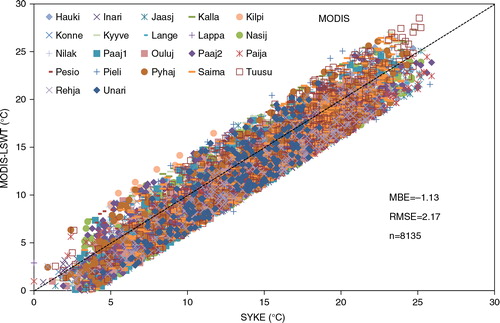
shows a scatterplot of the MODIS-derived LSWT and in-situ measurements along a 1:1 relation line for all 22 sites during open-water season. The MBE is −1.13 and RMSE 2.17°C for 8135 observations available for comparison (). Results from the analysis of all lake sites reveal that MODIS LSWT observations are on average colder than the in-situ measurements with a negative bias (MODIS minus in-situ).
Fig. 4 Scatter plot of MODIS-Aqua/Terra LSWT in comparison with SYKE water temperature data for all 22 Finish lakes during (2007–2011).
3.2. Comparison between MODIS UW-L3 and ESA AATSR-L2 products relative to in-situ measurements
Daily averaged MODIS UW-L3 and AATSR-L2 LSWT products were both evaluated against in-situ measurements and contrasted between each other during the open-water season for 3 yr. MODIS LSWT observations were selected for 11 lakes for which AATSR-L2 data were also available during an overlapping period (2007–2009) (see ). MODIS provided 2733 LSWT observations in total in contrast to only 569 for the AATSR-L2 product. MODIS provides more observations than AATSR-L2 since it is onboard of both the Aqua and Terra satellites, and the sensor covers a larger swath on the Earth's surface.
Fig. 5 Scatter plot of MODIS-Aqua/Terra (a), AATSR-L2 LSWT in comparison with SYKE water temperature data (b) for 11 Finish lakes during open-water period (2007–2009).
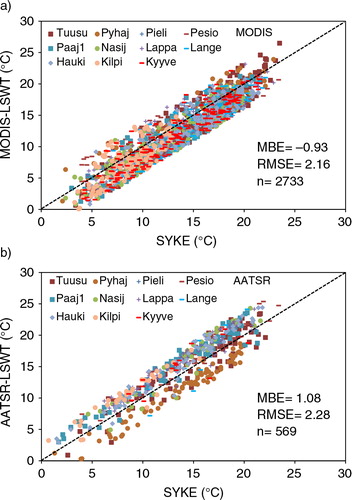
Overall, the MODIS LSWT observations are colder (MBE=−0.93 and RMSE=2.16°C) and AATSR-L2 warmer (MBE=1.08 and RMSE=2.28°C) when evaluated against in-situ measurements. In a, most of the paired observations (dots) are located below the 1:1 relation line showing the cold bias of MODIS observations and, in b, many of the paired observations (dots) are located above the line indicating the warm bias of the ESA AATSR-L2 product.
3.3. Comparison between AATSR-L2-NCC, AATSR-L2-PR, and ESA AATSR-L2 products relative to in-situ measurements
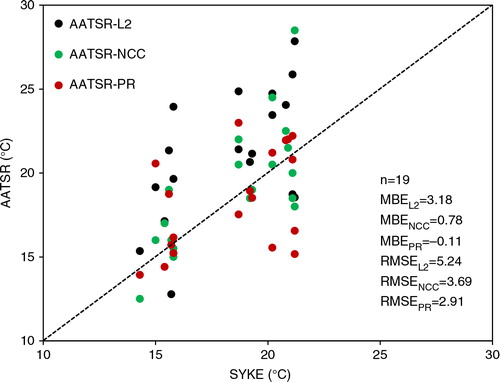
ESA's AATSR-L2 product and the new products based on the Key (AATSR-L2-NCC) and Prata (AATSR-L2-PR) algorithms with the finer resolution lake mask were evaluated against SYKE water temperature measurements during the month of August 2009 for a selection of nine lakes, when overlapping data were available for all three sets of satellite products (). LSWT products generated from both the Key and Prata algorithms provide comparable results when evaluated against SYKE water temperature measurements with MBE (RMSE) of 0.78 (3.69°C) and −0.11 (2.91°C), respectively (). A MBE of 3.18 (RMSE: 5.25°C) was calculated for the AATSR-L2 product over the same time period and number of lake sites. The evaluation results show small biases for both the Prata and Key algorithms when compared to in-situ observations, in contrast to the larger positive bias of the original AATSR-L2 product ().
Fig. 6 Comparison between AATSR-derived LSWT (AATSR-L2, AATSR-L2-NCC and AATSR-L2-PR products; see text for details) and SYKE in-situ water temperature measurements for nine lakes during open-water season (August 2009).
4. Discussion
Results reveal a good agreement between daily averaged UW-L3 MODIS-Aqua/Terra data and in-situ observations for the 22 lakes examined with an overall average bias of ~ −1°C. The UW-L3 MODIS-Aqua/Terra and ESA's AATSR-L2 products were also compared for a selection of 11 lakes for an overlapping time period (2007–2009). AATSR-L2 showed a positive MBE of 1.08°C (SD=2°C) over these lakes most likely due to the utilization of a coarse spatial resolution land cover type map (0.5°×0.5°). Because of this, entire lakes or lake sections may not be classified into the proper land cover type in ESA's AATSR-L2 product (Noyes et al., Citation2006, Citation2007). Open-water lake temperatures are colder than that of land usually from the beginning of April until August at high latitudes. Water has a higher heat capacity than land and therefore requires more energy to heat up and cool down. Therefore, mix of land and lake in each pixel can result in warmer temperatures within each 1 km×1 km pixel of the AATSR-L2 product. In addition, MODIS LSWT values were derived using daytime and nighttime acquisitions from Aqua and Terra, while AATSR LSWT observations were available mostly at daytime. This also provides a further explanation for the different biases calculated for the two LSWT products.
In order to produce a more accurate AATSR dataset, in which land contamination effects would be minimized, the two new algorithms (Key and Prata algorithms described earlier) were applied along with the GLWD lake mask with the objective of improving the accuracy of LSWT product from AATSR. The newly developed AATSR products as well as ESA's original L2 product were evaluated against in-situ measurements during August 2009, when overlapping data were available. The new AATSR products provide comparable results with MBE of 0.78°C (SD=3.61°C) and MBE of −0.11 (SD=2.91°C), with the implementation of the Key and Prata algorithms, respectively.
In a previous study, Kheyrollah Pour et al (Citation2012) compared the UW-L3 MODIS-Aqua/Terra product against LSWT (open-water season) and LIST (ice season) simulated with two 1-D lake models for two large Canadian lakes, Great Bear and Great Slave lakes. The authors found a mean bias of the same order of magnitude (~−1°C) as the one from this study. Crosman and Horel (Citation2009) also reported a bias of −1.5°C when comparing MODIS-Terra L2 (combined daytime and nighttime observations) against in-situ water temperature measurements (at a depth of 0.5 m) from Great Salt Lake (Utah, USA). Smaller biases are expected when comparison is only during daytime or nighttime and when in-situ observations are of surface water (skin) temperature measured with TIR radiometers (e.g. Hook et al., Citation2007; Schneider et al., Citation2009; Hulley et al., Citation2011).
Similar to the present study, the limitation of ESA's AATSR-L2 product over lake regions has also been recognized by Coll et al. (Citation2009) and Hulley et al (Citation2011). The authors applied the Prata algorithm to AATSR-L1B data acquired over Lake Tahoe (California/Nevada, USA). Coll et al. (Citation2009) calculated a bias of −0.178 K during July–December 2002 and July 2003 for day and night observations, while Hulley at al. (2011) reported a mean bias of −0.326 K for the period 2000–2010. The biases reported in these two studies are close to the bias of −0.11°C calculated herein, which also used the Prata algorithm to generate a new AATSR-L2 product (i.e. AATSR-L2-PR).
The lakes selected for evaluation of the satellite-based LSWT products in this study ranged in depth between 3 and 22 m. No particular relation was found between the mean depth and the magnitude of the biases calculated for the different lakes (R=−0.116 and p=0.607). This could be due to the location of in-situ measurement sites, which are always located in the shallow section of the lakes, compared to the 1 km2 satellite pixels that needed to be selected further from the shore to avoid possible land contamination. However, in some instances, the large distance between the location of in-situ observations and satellite pixels can affect the statistics. Lake Päijänne and Inari are two examples that showed larger biases (MBE=−1.84 and SD=1.46°C and MBE=−1.87 and SD=1.36°C, respectively) due to the large differences between in-situ and pixel locations. Evaluation of the satellite products using in-situ surface water temperature measurements collected by buoys at the same location as the satellite pixels, further from shore, would provide a closer correspondence (smaller bias) between the two sets of observations.
In addition to lake depth, the shape of the lakes of this study may also have had an impact on the accuracy of the retrieved LSWT when selecting the satellite pixels. Most of the lakes in Finland tend to be irregular in shape. They have arisen during post-glacial times and were formed mostly during glacier movement and scraped of rocks and soils (e.g. Tikkanen, Citation2002; Hakala, Citation2004). Lake Päijänne is an example of a very irregular lake (MBE=−1.84 and RMSE=2.35°C for MODIS versus in-situ). Lake Pyhäjärvi, on the other hand, is an example of a more regular shaped lake and its bias was less than 1°C (MBE of −0.79, RMSE: 2.04°C and SD=1.88°C for MODIS versus in-situ). The shape and lakeshore topography are important factors that influence the mixing of lakes (Imboden and Wüest, Citation1995). Some irregular shaped lakes may not undergo complete mixing in the spring or fall if there is not enough wind action as the irregular shape/lakeshore topography may block the wind and affect the mixing, resulting in a complex circulation pattern. Moreover, it is more challenging to select a pure pixel in an irregular shaped lake with many small islands, which could be missed in the 1 km2 lake shape files applied over thermal images.
5. Conclusions
The accuracy of MODIS UW-L3 and AATSR-L2 products was assessed as a step prior to performing data assimilation experiments in the HIRLAM NWP model using LSWT as a surface state variable (Kalle Eerola, personal communication, 2014; Kheyrollah Pour et al., Citation2014). To create an AATSR LSWT product that can be used with greater confidence in HIRLAM analysis, algorithms presented by Key et al. (Citation1997) and Prata (Citation2002) were applied to AATSR-L1B brightness temperature data, which had the effect of reducing the LSWT biases to 0.79 and −0.11°C, respectively. Based on the results presented in this study, the MODIS UW-L3 and the improved AATSR-L2 (Key algorithm) products were selected for integration into HIRLAM analysis using the OI data assimilation method in paper Part II (Kheyrollah Pour et al., Citation2014). During the data assimilation process, the statistical properties of the observational error are taken into account in the interpolation as well as in the preceding quality control of observations. During these experiments, all lake observations were assumed to have similar statistical properties. The assumed observational error SD was set to 1.5°C for both in-situ and remotely sensed LSWT observations. Observations were used to correct the background provided by FLake model or by previous analysis in HIRLAM. The quality control of the observations is performed prior to the actual analysis in two consequent phases: first observations are tested against the background, and then each observation is compared to the surrounding observations (see Part II).
The satellite products evaluated in this research are a promising source of LSWT data for the description of lake surface state in HIRLAM and are expected to improve the NWP results as they can provide frequent surface temperature measurements of many lakes over large geographical areas. In the near future, ESA's Sentinel-3 with two satellites (first Sentinel-3 is expected to be launched in 2014, followed by the second one in 2014–2015), in addition to the two MODIS sensors already in orbit, should generate increased interest in the assimilation of satellite-derived LSWT products in operational NWP models. However, cloud cover is known to significantly impact its full utilization in NWP models. In this study, we took advantage of the short time interval between MODIS-Aqua and Terra acquisitions by combining them together and therefore increasing the number of observations. Further studies are still needed to assess the quality of the cloud cover masks used in the satellite retrieval algorithms (e.g. errors due to undetected thin clouds). In the present study, the outliers of LSWT due to the presence of undetected cloud cover were removed from the database by monitoring the error and quality control values calculated in each pixel. However, more robust algorithms are needed in order to improve the quality of cloud cover masks from MODIS, AATSR and future satellite missions.
6. Acknowledgements
This research was supported by European Space Agency (ESA-ESRIN) Contract No. 4000101296/10/I-LG (Support to Science Element, North Hydrology Project) and a Discovery Grant from the Natural Sciences and Engineering Research Council of Canada (NSERC) to C. Duguay, as well as a NSERC postgraduate scholarship to H. Kheyrollah Pour. We thank the reviewers for valuable comments and suggestions that helped improve the original manuscript.
Related Research Data
References
- Amlien J , Solberg R . A comparison of temperature retrieval algorithms for snow covered surfaces. Proceedings of the International Geoscience and Remote Sensing Symposium. 2003; France: Toulouse. IEEE, 2, 842–844. DOI: 10.1109/IGARSS.2003.1293938.
- Cheng B , Vima T , Rontu L , Kontu A , Kheyrollah Pour H , co-authors . Evolution of snow and ice temperature, thickness and energy balance in Lake Orajärvi, northern Finland. Tellus A. 66, 21564, DOI: 10.3402/tellusa.v66.21564 . 2014
- Coll C , Hook S. J , Galve J. M . Land surface temperature from the Advanced Along-Track Scanning Radiometer: validation over inland waters and vegetated surfaces. IEEE Trans. Geosci. Rem. Sens. 2009; 47: 350–360.
- Crosman E. T , Horel J. D . MODIS-derived surface temperature of the Great Salt Lake. Rem. Sens. Environ. 2009; 113: 73–81.
- Duguay C. R , Brown L. C , Kang K.-K , Kheyrollah Pour H . Lake ice. Arctic report card 2011. 2011. Online at: http://www.arctic.noaa.gov/report11/lakeice .
- Duguay C. R , Brown L. C , Kang K.-K , Kheyrollah Pour H . [Arctic]. Lake ice. [In State of the Climate in 2011]. Bull. Am. Meteorol. Soc. 2012a; 93(7): 152–154.
- Duguay C. R , Brown L. C , Kang K.-K , Kheyrollah Pour H . [Arctic]. Lake ice. [In State of the Climate in 2012]. Bull. Am. Meteorol. Soc. 2013; 94(7): 156–158.
- Duguay C. R , Soliman A , Hachem S , Saunders W . Circumpolar and regional land surface temperature (LST) with links to geotiff images and netCDF files. 2012b; PANGAEA, Canada: Data Publisher for Earth & Environmental Science, University of Waterloo.
- Eerola K . Twenty-one years of verification from the HIRLAM NWP system. Weather Forecast. 2013; 28: 270–285. http://dx.doi.org/10.1175/WAF-D-12-00068.1 .
- Hakala A . Meromixis as a part of lake evolution – observations and a revised classification of true meromictic lakes in Finland. Boreal Environ. Res. 2004; 9: 37–53.
- Hook S. J , Vaughan R. G , Tonooka H , Schladow S. G . Absolute radiometric inflight validation of mid infrared and thermal infrared data from ASTER and MODIS on the Terra Spacecraft using the Lake Tahoe, CA/NV, USA, automated validation site. IEEE Trans. Geosci. Rem. Sens. 2007; 45(6): 1798–1807.
- Hulley G. C , Hook S , Schneider P . Optimized split-window coefficients for deriving surface temperatures from inland water bodies. Rem. Sens. Environ. 2011; 115: 3758–3769.
- Imboden D. M , Wüest A , Lerman A , Imboden D. M , Gat J. R . Mixing mechanisms in lakes. Physics and Chemistry of Lakes. 1995; Berlin Heidelberg, New York: Springer-Verlag. 83–138. Chap. 4.
- Key J. R , Collins J. B , Fowler C , Stone R. S . High-latitude surface temperature estimates from thermal satellite data. Rem. Sens. Environ. 1997; 61(2): 302–309.
- Kheyrollah Pour H , Duguay C. R , Martynov A , Brown L. C . Simulation of surface temperature and ice cover of large northern lakes with 1-D models: a comparison with MODIS satellite data and in-situ measurements. Tellus A. 2012; 64: 17614.
- Kheyrollah Pour H , Rontu L , Duguay C. R , Eerola K , Kourzeneva E . Impact of satellite-based lake surface observations on the initial state of HIRLAM. Part II: Analysis of lake surface temperature and ice cover. Tellus A. 2014; 66: 21395. DOI: 10.3402/tellusa.v66.21395. (in press).
- Lehner B , Doell P . Development and validation of a global database of lakes, reservoirs and wetlands. J. Hydrol. 2004; 296: 1–22.
- Mironov D . Parameterization of 658 Lakes in Numerical Weather Prediction.
- Mironov D . Parameterization of 658 Lakes in Numerical Weather Prediction.
- Noyes E , Corlett G , Remedios J , Kong X , Llewellyn-Jones D . An accuracy assessment of AATSR LST data using empirical and theoretical methods. Proceedings of the ENVISAT Symposium 2007. 2007; Switzerland: Montreux. European Space Agency, SP-636, P6. Online at: http://hdl.handle.net/2381/3719 .
- Noyes E , Good S , Corlet G , Kong X , Remedios J , Llewellyn-Jones D . AATSR LST Product Validation. Proceedings of the Second Working Meeting on MERIS and AATSR Calibration and Geophysical Validation (MAVT-2006). 2006; Italy Switzerland: Frascati. European Space Agency, SP-615. Online at: https://earth.esa.int/workshops/mavt_2006/papers/25_noyes.pdf .
- Prata F . Land Surface Temperature Measurement from Space: AATSR Algorithm Theoretical Basis Document.
- Prata F . Land Surface Temperature Measurement from Space: AATSR Algorithm Theoretical Basis Document.
- Prata F . Land Surface Temperature Measurement from Space: AATSR Algorithm Theoretical Basis Document.
- Prata F . Land Surface Temperature Measurement from Space: AATSR Algorithm Theoretical Basis Document.
- Tikkanen M . Long-term changes in lake and river systems in Finland. Fennia. 2002; 180(1–2): 31–42. Helsinki. ISSN 0015-0010.
- Tikkanen M . Long-term changes in lake and river systems in Finland. Fennia. 2002; 180(1–2): 31–42. Helsinki. ISSN 0015-0010.
- Undén P , Rontu L , Järvinen H , Lynch P , Calvo J , co-authors . The HIRLAM-5 Scientific Documentation. 2002. Online at: http://hirlam.org .
- Wan Z , Zhang Y , Zhang Q , Li Z.-L . Quality assessment and validation of the MODIS global land-surface temperature. Int. J. Remote Sens. 2004; 25(1): 261–274.
- Wan Z , Dozier J . A generalized split-window algorithm for retrieving land surface temperature from space. IEEE Trans. Geosci. Rem. Sens. 1996; 34(4): 892–905.