
Abstract
In this study, the wintertime cyclone/anticyclone activity and its variability over China are examined based on the National Centers for Environmental Prediction/National Center for Atmospheric Research (NCEP/NCAR) reanalysis data from 1948 to 2007. The climatology of the source, path and lysis regions for cyclones/anticyclones is investigated using an automatic tracking algorithm. Apparent asymmetries in source, lysis and path regions are observed between cyclones and anticyclones.
The 1948–2007 data exhibit an upward trend in the annual number and a downward trend in the cyclone and anticyclone intensity. The leading empirical orthogonal function (EOF) mode of the cyclone transit counts (CTC) for the 1948–2007 period indicates an increase in cyclone activity over northeastern East Asia since the late 1970s that becomes significant in the mid-1980s. The first EOF mode of the anticyclone transit counts (ATC) is a monopole over northern East Asia, centred west of Lake Baikal, which has increased since 1970. The CTC variability dominates the ATC variability, which corresponds well with the storm track variability.
Two distinct variability modes in the upper tropospheric jets over East Asia are also observed. The first mode describes an oscillation in the subtropical jet position; the second mode describes the polar-front jet strength variation. Moreover, the second mode is closely linked to the cyclone/anticyclone activity variability.
1. Introduction
China is located in the low- to mid-latitudes in East Asia. Moreover, China is heavily influenced in winter by both extratropical cyclones and anticyclones (cyclones and anticyclones hereafter) that arise from baroclinic instability in the atmospheric westerlies. Severe winter cyclones may be associated with low visibility, snowstorms and precipitation (Chen et al., Citation2013) while anticyclones give situations with more stagnant clear air, which is subjected to radiative cooling and can reach very low temperatures (Zhu et al., Citation2000). As such, cyclone and anticyclone studies have always been a subject of fundamental importance to meteorologists. However, most past cyclone and anticyclone studies over China have been based on poor-quality datasets spanning short time periods and subjective methods using weather charts (e.g. Chen et al., Citation1991; Zhu et al., Citation2000). Currently, high-quality datasets encompassing longer time periods are available due to improved global observing systems and more advanced data-assimilation techniques [e.g. the National Centers for Environmental Prediction/National Center for Atmospheric Research (NCEP/NCAR) and the European Centre for Medium-Range Weather Forecasts (ECMWF), reanalysis datasets]. Objective methods for detecting and tracking cyclones/anticyclones based on automatic numerical algorithms have also been developed over the past two decades (Murray and Simmonds, Citation1991; Hodges, Citation1994; Simmonds and Keay, Citation2000), which provide objective, reproducible results and permit rapid analysis of vast quantities of data. The main objective of this study is to utilise these advancements to obtain updated cyclone/anticyclone climatology over China.
There has been an increasing concern regarding future cyclone/storm-track activity changes associated with global warming due to increasing greenhouse gas concentrations. Numerical modelling is an important research tool for exploring this topic. However, substantial uncertainties exist among different modelling studies. Some models predict a decrease in the total number of cyclones with an increase in the number of more intense cyclones. Moreover, some models indicate a poleward shift in the storm tracks, whereas other studies suggest no substantial hemispheric cyclone characteristic changes; however, pronounced regional changes are predicted (Konig et al., Citation1993; Lambert, Citation1995; Zhang and Wang, Citation1997; Bengtsson et al., Citation2006 and the references therein). The uncertainties may be related to differences in model parameterisations, internal variability and different methods for identifying cyclones (Bengtsson et al., Citation2006). Given the large differences between general circulation model storm activity predictions with global warming, an examination of the extent to which changes have occurred in the observations is warranted. McCabe et al. (Citation2001), among others, found that using the NCEP/NCAR reanalysis data, cyclone frequency has increased in high latitudes and decreased in middle latitudes for Northern Hemisphere winters during the 1959–1997 period, which supports previous studies (e.g. Serreze et al., Citation1997), whereas the storm intensity [defined as the local Laplacian of the mean sea-level pressure (SLP) at each cyclone centre] has increased in both regions. However, the cyclone activity changes are not spatially uniform and exhibit apparent regional characteristics. The North Atlantic storm track has been intensifying (measured by the cyclone central pressure gradient or the strength of the variance of the meridional wind perturbations) and shifting northward and downward (Kushnir et al., Citation1997; Geng and Sugi, Citation2001; Nie et al., Citation2008). The Pacific storm track has an opposite trend, that is, intensifying and shifting southward. These changes began in the late 1970s (Chang and Fu, Citation2002; Nakamura et al., Citation2002; Nie et al., Citation2008; Zhang et al., Citation2012) in the North Atlantic and the entire Northern Hemisphere.
Using the NCEP/NCAR reanalysis data, Sorteberg and Walsh (Citation2008) demonstrated that cyclone activity (using the accumulated positive vorticity anomalies) entering the Arctic in the 1948–2002 period has an upward trend in all seasons, with the winter trend being the smallest. Simmonds et al. (Citation2008) explored cyclone behaviour in the Arctic based on different reanalysis datasets and different time periods. They obtained mixed results depending on the particular dataset and time period considered. How cyclone/anticyclone activity over China responds to climate change is another interesting question. Chang et al. (Citation2006), Xu et al. (Citation2006), Gao (Citation2007), Wang et al. (Citation2009a), and Wang and Chen (Citation2010) found that the East Asia winter monsoon has weakened since the mid-1980s in response to global warming. How the cyclone/anticyclone activity responds to this weakening is a fundamental question for understanding and predicting weather and climate in China. Most previous studies have focused on cyclone activity in northern China and its effects on spring dust storms (Wang and Li, Citation2003; Yao et al., Citation2003; Wang and Guo, Citation2005; Wang et al., Citation2007a, Citationb); little work has been conducted on wintertime cyclone activity. Wang et al. (Citation2009b) studied cyclone activity using the ECMWF 40 yr Reanalysis (ERA-40) data for the 1958–2001 period by tracking SLP minima over East Asia (25°N–60°N; 80°E–140°E). Based on the SLP climatology (1971–2000) for East Asia, they used seasonally dependent tercile thresholds to identify cyclones throughout the year. Wang et al. (Citation2009b) found that the highest cyclone frequency occurs in spring, whereas the lowest frequency occurs in winter. Moreover, winter cyclone frequency was low from 1958 to the mid-1970s, increased until the mid-1980s and, subsequently, decreased again. However, the annual mean cyclone intensity (defined as the minimum pressure in each cyclone centre) had a decreasing trend. The work of Wang et al. (Citation2009b) is interesting and demonstrates that a closer examination of cyclone features is needed in this region. Our present work extends Wang et al. (Citation2009b) in the following aspects. First, in addition to cyclone frequency and intensity, we consider more cyclone activity aspects, including cyclogenesis, cyclolysis, path and lifespan, which are also important factors affecting weather and climate in China. Second, the present study considers anticyclones. Cyclones and anticyclones often appear simultaneously and characterise mid-latitude weather. Few earlier hemispheric-scale studies have focused on anticyclones (e.g. Jones and Simmonds, Citation1994; Sinclair, Citation1996; Hoskins and Hodges, Citation2002; Pezza et al., Citation2007; Ioannidou and Yau, Citation2008). However, to our knowledge, no systematic research on wintertime anticyclones in China has been conducted. Therefore, new wintertime anticyclone activity results in China are anticipated from this research. Third, the mechanism for cyclone/anticyclone activity changes are explored based on large-scale background flow changes, namely, the polar-front and subtropical jets over East Asia.
The remainder of this paper is organised as follows. The next section introduces the data and methodology used for diagnosis. The cyclone/anticyclone activity climatology, such as cyclone/anticyclone genesis, lysis, path, intensity and lifespan, are discussed in Section 3. Cyclone/anticyclone activity interannual variability and possible mechanisms are presented in Sections 4 and 5, respectively. The results are discussed in Section 6, and conclusions are provided in Section 7.
2. Data and methodology
The 6-h 2.5°×2.5° gridded NCEP/NCAR reanalysis data (Kalnay et al., Citation1996) for 59 winters (December through February, DJF) from 1948 to 2007 are used in this study.
The NCEP/NCAR reanalysis product is the longest available dataset at a 6-h sample rate. The dataset is freely accessible from the NOAA–Cooperative Institute for Research in Environmental Sciences (CIRES) Climate Data Center, Boulder, Colorado (more information available online at http://www.cdc.noaa.gov/). An additional motivation is that a comparison with other reanalyses (Hodges et al., Citation2003, Citation2011) generally exhibited only slight differences in the tracking statistics for many fields in the lower troposphere of the Northern Hemisphere.
The cyclones/anticyclones studied in this paper form, diminish, or pass through China. The analysis of cyclone/anticyclone features, such as the genesis, lysis, path and intensity, is restricted to cyclones within the Chinese region. Analysis of other features, such as regionally averaged transit counts (see below for definitions) and upper tropospheric jets, is based on a larger area in East Asia that contains China.
There are two primary approaches to study storm (cyclone/anticyclone) activity or tracks that are widely accepted in the literature. The first approach examines storm tracks in a Eulerian framework in which the storm tracks are defined as the geographically localised maxima in the bandpass transient variance. The second approach identifies individual storms in a Lagrangian framework and follows each storm from its cyclogenesis (anticyclogenesis) to its cyclolysis (anticyclolysis). Chang et al. (Citation2002) provided details on the merits and shortcomings of the two approaches. In this paper, we primarily use the second approach; the first approach is only used for comparisons.
The cyclone/anticyclone trajectories are estimated using a feature-tracking algorithm developed by Hodges (Citation1994, Citation1995, Citation1996 and Citation1999). This algorithm can be applied to a range of meteorological variables at different vertical levels to identify and track features. Instead of SLP (McCabe et al., Citation2001; Simmonds et al., Citation2008; Wang et al., Citation2009b; Flocas et al., Citation2010), we use 6-h relative vorticity at 850 hPa (ξ850) to identify tracks of synoptic lows and highs. Planetary background waves with wavenumbers of less than five are filtered. A spline technique for spheres is used to smooth the data. Local ξ850 maxima greater than or equal to 1.0×1.0−5 s−1 are considered as possible cyclones; only trajectories that last for at least 48 h and travel further than 1000 km are selected as true storm tracks. The anticyclones are detected in the same manner except that the threshold local minimum ξ850 for anticyclones is −1.0×1.0−5 s−1. Moreover, ξ850 is chosen to identify synoptic tracks because it is better able to focus on smaller spatial scales and is less influenced by the background state than SLP, which is more commonly used (Mailier et al., Citation2006). Systems with a circulation around maximum/minimum relative vorticity can often be located in the early life-cycle stages, long before the associated minimum/maximum surface pressure is detectable (Sinclair Citation1994, Citation1997). Relative vorticity is also more directly associated with variables that cause damage, that is, wind (through circulation) and precipitation (through vertical motion). Relative vorticity could introduce noise because it resolves mesoscale structures, such as fronts. However, this possibility does not appear to be a problem at the relatively low horizontal resolution (T63) of the NCEP/NCAR reanalysis. Furthermore, ξ850 has also been used in other studies (e.g. Ioannidou and Yau, Citation2008; Donohe and Battisti, Citation2009; Mesquita et al., Citation2010).
As in Mailier et al. (Citation2006), the transit count of cyclone/anticyclone tracks is used to represent local cyclone/anticyclone frequency, which is defined as the number of cyclone/anticyclone tracks crossing the local meridian within ±10° latitude from the grid point per winter. The magnitude of the 850-hPa vorticity is used as a measure of storm intensity.
Identifying and tracking cyclones/anticyclones is very challenging. Here, only one tracking scheme and one set of reanalysis data are used. However, some uncertainty exists in the presented results. The cyclone/anticyclone features, such as the frequency, density, intensity, tracks and lifespan, and climatology or trends depend largely on the datasets, tracking algorithms and specific cyclone/anticyclone definitions. Simmonds and Keay (Citation2000), Bengtsson et al. (Citation2004), Simmonds et al. (Citation2008), Meaquita et al. (Citation2009), Zhao and Zhao (Citation2011) and Neu et al. (Citation2013) have provided an in-depth discussion on these issues.
3. Cyclone/anticyclone activity climatology
3.1. Genesis, lysis and path
For the 59 winters from 1948 to 2007, 1430 (1217) cyclones (anticyclones) are detected that affect China. Among them, 52% (49%) of the cyclones (anticyclones) are generated outside of China and 48% (51%) are generated within China.
Mongolia ① and its neighbouring regions, including Northeast China ○2, constitute a primary cyclone source region. The secondary maximum of cyclogenesis is concentrated on the Jianghuai area ○5. In addition, the Xinjiang area ○4, North China ○3 and eastern Southwest China ○6 are primary cyclone source regions (a, the circled numbers represent different regions). In contrast, Mongolia and its neighbouring regions is a main anticyclone source region, with its centre in eastern Mongolia. Another main anticyclogenesis centre stretches southeastward from eastern Northwest China across Shanxi-Henan-Hubei province to Jianghuai valley (d). The New Siberia area is also an anticyclone source region.
Fig. 1 Genesis regions (a) and (d), trajectories (b) and (e), and lysis locations (c) and (f) of cyclones (left panel) and anticyclones (right panel). The circled numbers correspond to ○1 Mongolia, ○2 Northeast China, ○3 North China, ○4 Northwest China, ○5 Central/Southeast China and ○6 Southwest China, divided by terrain and horizontal and vertical lines.
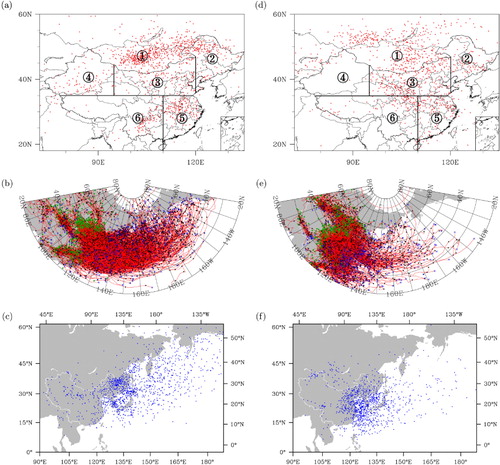
The cyclones move predominantly eastward and northeastward; their lyses are broadly distributed across East Asia and the entire North Pacific with a maximum centred on Northeast China, the Far East, and the Korean Peninsula (b and 1c). The anticyclones tend to move predominantly southeastward, and their lyses are concentrated near East Asia and the neighbouring West Pacific (e and 1f).
The synoptic-scale storm systems are stratified according to their genesis regions, as noted by Flocas et al. (Citation2010). Mongolia cyclones/anticyclones refer to cyclones/anticyclones originating in Mongolia and its neighbouring area (○1) (a1 and a2). As shown previously, nearly half of all cyclones/anticyclones that affect China form in this area. Mongolia cyclones move predominantly eastward and partially southeastward; their lysis region is broadly distributed over East Asia and the entire North Pacific with a high density over Northeast China and the Far East. Unlike Mongolia cyclones, which are distributed over all of Mongolia, Mongolia anticyclones are primarily concentrated in eastern Mongolia and extend to Lake Baikal and New Siberia. Another difference is that Mongolia anticyclones move predominantly southeastward; their lysis region is primarily limited to northeastern East Asia.
Fig. 2 Cyclone genesis (red dots) and lysis (blue dots) originating in ○1 Mongolia (a1), ○2 Northeast China (b1), ○3 North China (c1), ○4 Northwest China (d1), ○5 Central/Southeast China (e1) and ○6 Southwest China (f1). (a2)–(f2) The same except for the anticyclones. The number of cyclones or anticyclones and their corresponding percentages (in round brackets) are listed in the upper-right corners.
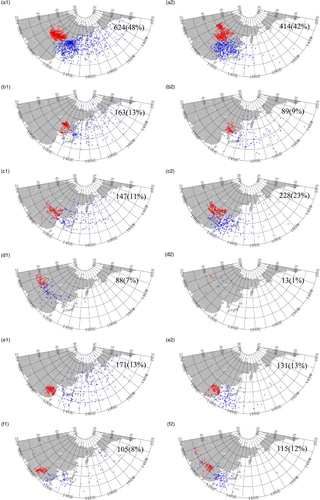
Northeast China cyclones and anticyclones form in Northeast China (○2). In total, 163 (89) cyclones (anticyclones) are detected in this area, constituting 13% (9%) of all cyclones (anticyclones). Both cyclones and anticyclones can move across the entire North Pacific, with more cyclones than anticyclones reaching the eastern Pacific (b1 and b2).
Northern China cyclones/anticyclones refer to cyclones and anticyclones that are first detected in North China and eastern Northwest China (○3). In total, 147 (228) cyclones (anticyclones) are detected, representing 11% (23%) of all cyclones (anticyclones). North and Northeast China cyclones have similar paths. However, the North China anticyclone paths are mainly limited to East Asia and its neighbouring seas (c1 and c2).
Northwest China cyclones/anticyclones form in Xinjiang province (○4). In total, 88 Northwest China cyclones are detected, or 7% of the total, typically moving downstream across North China. Only 13 Northwest China anticyclones are detected, corresponding to 1% of all detected anticyclones. These anticyclones move northward (d1 and d2).
Central/Southeast China cyclones/anticyclones are first detected in the Yangtze-Huaihe River valley and its neighbouring area (○5). In total, 171 cyclones are detected in the 59 winters, representing 13% of all detected cyclones. These cyclones tend to move across the North Pacific and Northeast Asia. Moreover, 131 anticyclones, corresponding to 13% of the total, form in this area. The lysis is mostly limited to the western West Pacific (e1 and e2).
Southwest China cyclones/anticyclones form in SouthwestChina (○6). The cyclones, typically referred to as southwest vortex lows, are concentrated in eastern Southwest China; the anticyclones are focused on northeastern Southwest China (f1 and f2). In total, 105 (115) cyclones (anticyclones), representing 8% (12%) of the total, are detected. Most Southwest China cyclones diminish in East China, the Korean and Japanese Islands, and their neighbouring seas. In some extreme cases, the cyclone storms can reach the Aleutian Islands. This observation corresponds well with the findings of Meaquita et al. (Citation2009). In contrast, the tracks of anticyclones generated in this area are limited only to East Asia and its neighbouring seas.
3.2. Transit counts
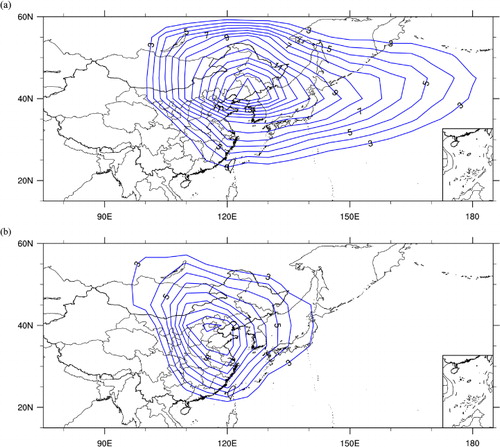
Cyclone and anticyclone transit count (ATC) contours are shown in to better describe the cyclone/anticyclone activity. The cyclone transit count (CTC) contours (a) are oriented in an east–west direction with a maximum centred near southern Northeast China, which corresponds with the fact that cyclone tracks spread broadly in the east–west direction (shown above) and southern Northeast China is the most frequently cyclone-influenced region. However, the ATC contours (b) are circular and centred near Shandong-Henan-Hebei province, which again corresponds with the facts that the anticyclone tracks are highly concentrated in East Asia and its neighbouring coast and that the Shandong-Henan-Hebei area is the most frequently anticyclone-influenced region. All of the above-mentioned aspects are well reflected in the two transit-count contour figures.
Fig. 3 Contours of CTCs (a) and ATCs (b) related to China (see text for explanation) per winter. The contour interval is one.
3.3. Lifespan and intensity
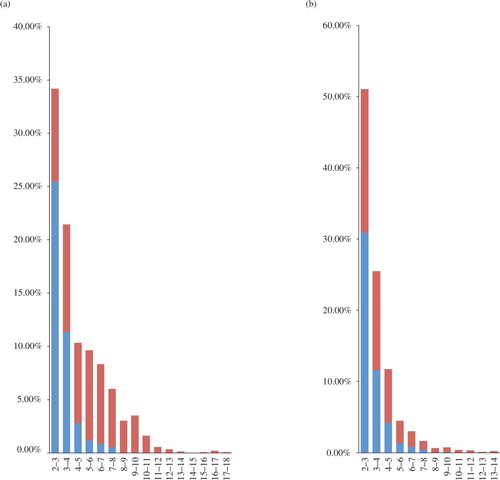
shows the cyclone and anticyclone percentages against their lifespans and intensities. The cyclone and anticyclone percentages decrease rapidly for increased lifespans, decreasing slower for cyclones than anticyclones. This finding suggests an asymmetry between cyclones and anticyclones. Compared to cyclones, anticyclones generally have shorter lifespans. Approximately 95% of the detected anticyclones have lifespans of less than 1 week, that is, only 5% of the mobile anticyclones have reached a lifespan as blocking highs which usually live more than 1 week and even longer than 2 weeks sometimes; whereas 85% of the cyclones have lifespans of less than 1 week. also illustrates that of the long-lifespan cyclones/anticyclones, strong intensity (red column) cyclones or anticyclones are more common than weak intensity (blue column) cyclones or anticyclones. This feature is more apparent in cyclones. Here, we define the stronger/weaker cyclones/anticyclones using their rank number. For example, all cyclones are sorted according to their maximum intensity; the median intensity is marked as the reference intensity. Cyclones in which the maximum intensity is greater (less) than the reference intensity are treated as stronger (weaker) cyclones. This same procedure is also used for anticyclones.
Fig. 4 Percentage of cyclones (a) and anticyclones (b) as a function of their lifespans. The red and blue column parts represent the stronger and weaker cyclones and anticyclones, respectively, in each lifespan range. The x-axis is in days. (Here, we define the stronger/weaker cyclones/anticyclones using their rank number. For example, all cyclones are sorted according to their maximum intensity; the median intensity is marked as the reference intensity. Cyclones in which the maximum intensity is greater (less) than the reference intensity are treated as stronger (weaker) cyclones. This same procedure is also used for anticyclones.)
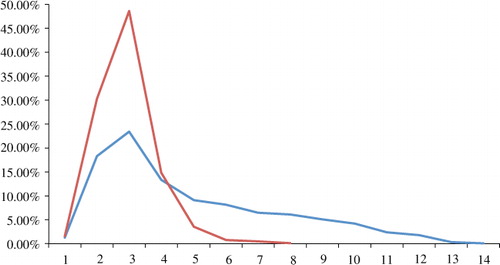
illustrates the relationship between frequencies and intensities. Both cyclones and anticyclones have peak frequencies for an absolute strength greater than or equal to 3×10⁻⁵ s−1 and less than 4×10⁻⁵ s−1, respectively. The frequency decrease with increasing intensity is considerably slower for cyclones than anticyclones, suggesting that there are more strong cyclones than anticyclones.
Fig. 5 Percentage of cyclones (blue curve) and anticyclones (red curve) as a function of their absolute maximum intensities. The x-axis is in 10−5 s−1.
4. Cyclone/anticyclone variability
Frequency and intensity are two important quantities that influence weather and climate. Here, we examine the variability in frequency and intensity for the 59 winters considered.
4.1. Trend in numbers and intensities of the cyclones/anticyclones
Both the seasonal cyclone (blue solid curve) and anticyclone (red dashed curve) numbers have a similar evolution for the 59 winters (a). A downward trend is clearly observed before the 1970s, whereas an upward trend is apparent after 1970. Finally, a slight downward trend begins after the mid-1980s. This synchronicity for cyclones and anticyclones was also noted by Pezza et al. (Citation2007) for cyclones and anticyclones in the Southern Hemisphere, indicating that cyclones and anticyclones are often counterparts that are generated simultaneously from baroclinic instability in the westerlies. Moreover, many years of more (less) baroclinicity could result in more (less) cyclones and anticyclones. This hypothesis is verified in the following section.
Fig. 6 Interannual variations in number (a) and average maximum intensity (b) of cyclones (blue solid curves) and anticyclones (red dashed lines) affecting China.
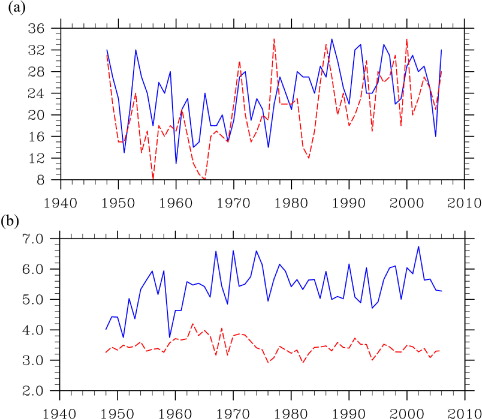
b presents the temporal evolution of the winter-mean cyclone (blue solid curve) and anticyclone (red dashed curve) intensity, respectively. Here, the winter-mean intensity is defined as follows. First, the maximum intensity of each cyclone (anticyclone) is obtained by sorting its intensity over its lifespan. Then, the average is taken to determine the cyclone (anticyclone) maximum winter intensity. An upward trend in strength is observed before the early 1970s for cyclones, after which a downward trend is observed. The averaged maximum anticyclone strength increases slightly before the mid-1960s. Then, the strength decreases in an oscillatory manner until the mid-1970s, remaining constant thereafter.
4.2. Variability in the transit counts and storm tracks
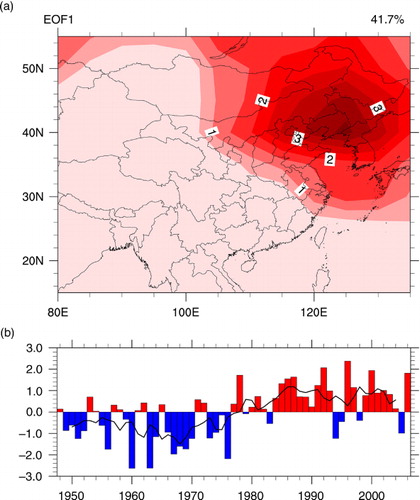
presents the climatological mean and variance of the CTC in East Asia. Cyclones most frequently influence northeast China, which corresponds with the result shown in a. We use empirical orthogonal functions (EOFs) to analyse the factors (the seasonal cycle of all variables is removed for the EOF analysis in this paper) to quantify the cyclone spatial and temporal variability (). Higher-order EOFs are calculated. The robustness is checked using the North test (North et al., Citation1982), and it was found that it was not possible to separate the second mode from the third mode. (The same result was also found for the anticyclones) The first CTC spatial EOF mode (loading field) is a monopole pattern over northeast East Asia and centred over Northeast China (a), accounting for 41.7% of the total explained variance. The corresponding time series indicates that the CTC over northeast East Asia increases beginning in 1976; a significant increase occurs after the mid-1980s (b, the black curve is the filtered time series after a 5-yr running mean), which agrees with the seasonal cyclone number trend. This finding suggests that the frequency of cyclones influencing Northeast China has gradually increased since the mid-1980s.
Fig. 7 Climatological mean (a) and variance (b) of the transit count for wintertime cyclones from 1948 to 2007. The contour intervals are two.
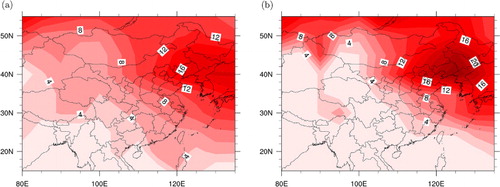
Fig. 8 EOF1 of CTCs for the 1948–2007 period in East Asia: (a) spatial mode/loading field and (b) normalised time series (bars). The black curve is the filtered time series after a 5-yr running mean. The contour interval is 0.5 in (a).
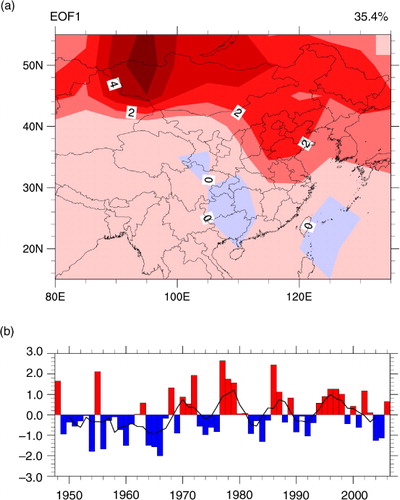
presents the climatological mean and variance of the ATC in East Asia. The anticyclones most frequently affect northwest of East Asia, the region southeast of Lake Baikal, and North China. presents the leading EOF (loading field) and corresponding time series for the ATC. The leading EOF explains 35.4% of the total variance. The EOF mode is a monopole over northern East Asia and centred over the northwest region (a). Anticyclone activity is weak over northern East Asia before 1970, whereas after 1970, the decadal variability is apparent with no significant trend observed (b).
Fig. 9 Climatological mean (a) and variance (b) of the transit count for wintertime anticyclones from 1948–2007. The contour intervals are two in (a) and five in (b).
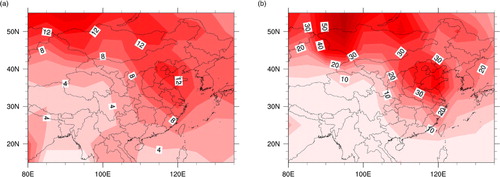
Fig. 10 EOF1 of ACTs for the 1948–2007 period in East Asia: (a) spatial mode/loading field and (b) normalised time series (bars). The black curve is the filtered time series after a 5-yr running mean. The contour interval is one in (a).
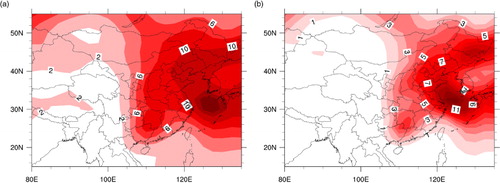
The transit count measures only the local frequency of cyclones/anticyclones passing through a fixed region. The transit count fails to describe the cyclone/anticyclone storm strength. presents the climatological mean and variance of the two- to seven-day bandpass-filtered 850-hPa meridional winds. The bandpass filter does not discriminate between lows and highs. Moreover, the resulting magnitudes from the filtering process have contributions from both the frequency and amplitude of the selected waves. The bandpass filter is a popular and useful measure for storm tracks. Furthermore, it is of interest to relate these magnitudes to the track data, which is simple and unique property. Therefore, one cannot expect a one-to-one correspondence between the fluctuations in these two storm track measures. The meridional wind at 850 hPa is closely related to the low-level pressure field. Additionally, as noted in Section 2, SLP-based parameters can be significantly affected by the background state variability. This effect is not as apparent with relative vorticity, and low wave numbers have been filtered to confidently avoid potential errors.
Fig. 11 Climatological mean (a) and variance (b) of the two- to seven-day bandpass-filtered 850-hPa meridional wind variance for the 1948–2007 period. The contour intervals are 2 m2/s2 in (a) and 1 m4/s4 in (b).
presents the first EOF mode of the meridional wind variance and the corresponding time series at 850 hPa (similar results are obtained at other higher levels). The meridional winds are filtered with the bandpass filter (2 to 7 d) before the EOF analysis. The EOF mode and corresponding time series are generally similar to the CTC EOF mode (), indicating that the cyclone variability dominates the anticyclone variability. provides details of the correlation between the CTC/ATC and storm tracks. The raw correlation between the principal component (PC) of the storm track at 850 hPa and the CTC PC is 0.62, which is statistically significant at the 99% confidence level. Here, the autocorrelation effect on the time series (PCs) is considered when determining the correlation coefficient between different PCs. Moreover, the significance levels are assessed using the ‘effective’ number of degrees of freedom (Pyper and Peterman, Citation1998). In contrast, the ATC PC has a correlation coefficient of 0.28 with the PC of the storm tracks at 850 hPa (statistically significant at the 95% confidence level). The result is similar to the CTC if the cyclone and anticyclone counts are added together and the total transit counts (C&ATC) are calculated. Therefore, we conclude that the cyclone variability dominates the storm variability, and the first CTC EOF mode accurately depicts the storm track variability.
Fig. 12 EOF1 of the two-to seven-day bandpass-filtered 850-hPa meridional wind variance for the 1948–2007 period in East Asia: (a) spatial mode/loading field and (b) normalised time series (bars). The black curve is the filtered time series after a 5-yr running mean. The contour interval is 0.25 m2/s2 in (a).
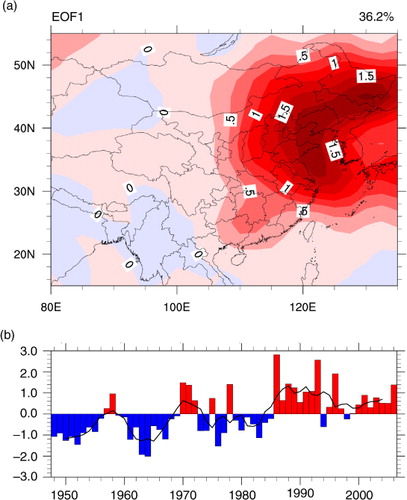
Table 1. Correlation between the first mode of variability for storm tracks (ST) at 850 hPa and the leading modes of variability for the CTC, ATC and C&ATC
5. Relation to upper tropospheric jets
It has been widely accepted that extratropical cyclones/anticyclones owe their growth and development to vertical shear associated with atmospheric jets (Charney, Citation1947 and Eady, Citation1949). In this section, we examine the variation of the jets over East Asia between 1948 and 2007 and its potential relationship with the cyclone/anticyclone activity variations.
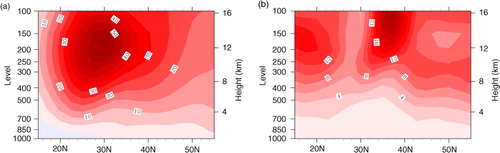
presents the climatological mean and variance of the tropospheric zonal mean zonal winds (ZMZWs) over East Asia (80–120°E). The strong sub-tropical jet (centred at 30°N and 200 hPa) is a pronounced feature over East Asia. Moreover, the polar-front jet is hinted by the weak local maximum centred at 40–45°N and 300 hPa (a). The two regions of maximum variance (b), centred near 18 and 35°N, may be caused by the north–south shift in the sub-tropical jet.
Fig. 13 Climatological mean (a) and variance (b) of the wintertime zonal mean (80–120°E) zonal wind for the 1948–2007 period. The contour intervals are 5 m/s in (a) and 2 m2/s2 in (b).
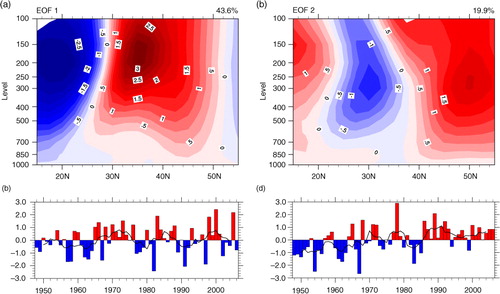
presents the first two EOF modes of the ZMZWs in the troposphere of East Asia (100–1000 hPa and 15–55°N) and the corresponding time series. The first EOF mode (a), which is significantly stronger than the second EOF mode, explains 43.6% of the total variance and represents the north–south shift of the sub-tropical jet, as indicated by the ZMZW variance in b. Before the mid-1960s, the subtropical jet shifts equatorward and then shifts poleward until the mid-1970s. Thereafter, the subtropical jet exhibits interannual variability and no apparent decadal variability (b). The second EOF mode (c) is a triple with a negative anomalous centre over the sub-tropics and two positive centres over the tropics and high latitudes. Compared with the first EOF mode, the second EOF mode is weak and explains only 19.9% of the total variance. Although this second mode fails to pass the North test (North et al., Citation1982), it is considered robust because it appears as a persistent mode when rotated EOFs are calculated. This result is independent of whether the first four, six, or even 10 EOFs of the ZMZW are rotated, which account for 85.6, 93.6 and 97.5% of the total variance, respectively (data not shown). The second mode describes a sub-tropical jet pulsation. When the subtropical jet core is strong (weak), the wind along the two flanks is weak (strong). The wind variation on the northern flank may be related to the variation in the polar-front jet, which is the strongest of the three poles. The polar-front jet weakens before the 1970s and strengthens after the mid-1980s (d).
Fig. 14 Spatial mode/loading field of EOF1 (a) and EOF2 (c) for the ZMZWs (80–120°E) in the wintertime East Asia troposphere (100–1000 hPa and 15–55°N) for the 1948–2007 period. The contour intervals are 0.25 m/s. The corresponding normalised time series (bars) are also shown (b) and (d). The black curve is the filtered time series after a year running mean.
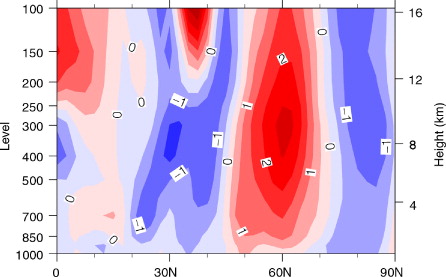
To further confirm that the triple-like variability pattern of the ZMZW exists, the composite difference of the ZMZWs is calculated between the periods of 1984–2003 and 1964–1983. The difference map () displays a triple-like pattern over the tropics through the high latitudes; an increase in the polar-front jet is clearly observed. However, some noticeable differences exist compared with c. Therefore, we conclude that the triple-like variability pattern revealed by the second EOF mode of the ZMZW occurs in the real atmosphere. Moreover, the polar-front jet has increased in strength since the mid-1980s, which could lead to more baroclinic disturbances over northern East Asia.
Fig. 15 Composite differential map between 1984–2003 and 1964–1983 for the ZMZW (80–120°E). The contour interval is 0.5 m/s.
To strengthen the aforementioned argument, the relationships between the upper tropospheric jets and cyclone/anticyclone activity are examined. The two leading CTC and ATC EOFs describe much of the variability in cyclone/anticyclone frequency over northern East Asia. We expect these modes to be related to the second ZMZW EOF mode. provides evidence of this relationship. The correlation coefficient between the ZMZW PC2 (second EOF time series) and the CTC (ATC) PC1 is 0.50 (0.38) at the 99% confidence level. The same result is also observed for the summed C&ATC.
Table 2. Correlation between the two modes of variability for the ZMZWs and the leading modes of variability for the CTC, ATC and C & ATC
Not only the CTC and ATC but also the storm tracks at different levels are closely related to the second ZMZW EOF mode. Generally, the polar-front jet is more highly correlated with storm tracks at 300 and 850 hPa than at 500 hPa (data not shown).
Furthermore, the EOF analysis is only applied to the ZMZWs in latitude-height cross sections rather than the zonal winds on a particular level, for example, 200 hPa, because results from the EOF analysis of the ZMZWs can describe the jet variability (the north–south direction shifts) at not only a particular level but also other levels. In other words, the results describe the vertical shear shift of the zonal winds in the north–south direction. Moreover, the EOFs of 200-hPa horizontal zonal winds are also calculated, demonstrating that the leading variability pattern corresponds well with the zonal mean results. Furthermore, baroclinic theory relates the growth of synoptic systems to not only the vertical westerly shear but also static stability. The leading EOF mode of the Eady growth rate in the lower tropospheric polar-jet also has a similar increase in strength over northern East Asia beginning in the mid-1980s (data not shown, see more details in Chen Citation2013). The results presented here remain unchanged even when the static stability is included in the analysis (data not shown). For other cases (Walland and Simmonds, Citation1999; Lim and Simmonds, Citation2009), the static stability does play an important role in determining extratropical cyclone/anticyclone behaviour.
6. Discussion
The present work both agrees and disagrees with the work of Chen et al. (Citation1991). Both studies identified Mongolia and Northeast China as the main cyclone source regions. These areas are located on the lee sides of the Alta-Sayan and Great Xinganling mountains. Therefore, in addition to the baroclinicity, the orographic forcing is believed to be an important factor leading to cyclogenesis in these areas. Both studies also found that East China, centred on the Jianghuai valley, is a prominent cyclone source region, likely related to baroclinicity. This study detected significant winter cyclogenesis in northeastern Southwest China, whereas Chen et al. (Citation1991) did not. The reason for this discrepancy may be that in their work, cyclogenesis is defined as the initial point in which at least one 5-hPa isobar of SLP is closed. Chen et al. (Citation2007) found wintertime southwest vortices in China. However, these vortices occur less often in winter than the other seasons. In this study, a careful examination indicates that most cyclones detected in this region are only short-wave troughs. When these troughs move downstream to the Jianghuai valley, some diminish, whereas others develop and move further toward the West Pacific or even as far as the Northeast Pacific (Section 3). This result is directly related to choosing the 850-hPa vorticity to define cyclones. In wintertime, the Asian westerly jet splits into two branches when it meets the Tibetan Plateau. The southwest vortex lows are typically formed in the southern branch on the lee side of the Tibetan Plateau. Therefore, the Tibetan Plateau forcing might drive cyclogenesis in this region.
The previous section demonstrates that the polar-jet and anticyclone numbers have a correlation coefficient of 0.38 on interannual scales, exceeding the 99% confidence level. This result means that baroclinicity may still drive anticyclogenesis. However, baroclinicity alone cannot explain why anticyclogenesis tends to occur in some certain geographical areas. Other factors must contribute to anticyclogenesis. These factors require further examination.
Our study demonstrates that far from source regions, cyclones over East Asia move primarily eastward or northeastward across East Asia and/or the entire North Pacific. Moreover, anticyclones move predominantly eastward or southeastward, and their lysis is primarily limited to only East Asia and the West Pacific. The cyclone/anticyclone asymmetry in trajectories may be a result of the stationary East Asia trough in the mid-troposphere, which is forced by the land–sea thermal contrast. Typically, lower-layer cyclones/anticyclones and upper-layer baroclinic waves are closely coupled; a developing low-level cyclone (anticyclone) is located east (west) of the wave trough axis. Upper waves fully develop and become stationary when they move from upstream to the climatological location of the East Asia trough. Under the steering of the East Asia trough, the low-level anticyclones move along the northwesterlies of the East Asia trough and diminish at lower latitudes. In contrast, the low-level cyclones are steered along the southwesterlies of the East Asia trough. Therefore, the cyclones can travel long distances and occasionally reach the Northeast Pacific and beyond. Interestingly, Mesquita et al. (2009) confirmed this far-moving phenomenon by studying the severe October 1992 storm that reached Nome, Alaska and caused substantial damage, finding that the storm originated in Northeast China.
Our results also demonstrate that the increased cyclone/anticyclone activity over northern East Asia is a response to the increased strength of the polar-front jets since the mid-1980s. However, the cause of the increased strength of the polar-front jets remains unknown. Kumar et al. (Citation2010) recently found that the sea surface temperature in the tropical Indian Ocean and West Pacific (the warm pool region) rises significantly after 1980. They further demonstrated through observational data and numerical simulations that the rising warm pool temperature leads to substantial increases in the mid-latitude geopotential heights over the Eurasian continent and decreasing high-latitude geopotential heights, which causes a significant slope in geopotential heights over the mid- to high-latitude zone. Therefore, intensifying the polar-front jets. Similarly, Li et al. (Citation2010) also confirmed using numerical simulations that the recent warming over tropical oceans has played a major role in the weakening of Asian summer Monsoon since the late of 1970s.
7. Conclusions
This study investigated wintertime mobile cyclone/anticyclone activity over China based on the NCEP/NCAR reanalysis data. The main conclusions are as follows:
The cyclone and anticyclone features are quite different in their genesis, lysis and path.
A primary cyclone source region is located over northern East Asia, across Mongolia, and its northeast neighbouring areas, including Northeast China, and a secondary cyclone source region in eastern Southwest China, across the Jianghuai valley. The Xinjiang area and North China are also two main source regions. The primary anticyclone source regions are broadly distributed across Lake Baikal to eastern Mongolia and Inner Mongolia to the Jilin area. The secondary anticyclone source maximum is Gansu-Shanxi province and across Henan-Hubei province to the Jianghuai area. New Siberia is also a main source of anticyclones.
The cyclones tend to move eastward and northeastward across East Asia and the entire North Pacific. Moreover, the anticyclones move largely southeastward across East Asia and its neighbouring West Pacific region. The asymmetrical cyclone/anticyclone paths may result from the steering by the stationary East Asian trough.
An upward trend in the annual numbers and a downward trend in the intensity of cyclones and anticyclones are detected for the 1948–2007 period.
The leading mode of the CTC for the 1948–2007 period describes an increase in cyclone activity over northeastern East Asia that begins in the late 1970s and becomes significant in the mid-1980s. The leading EOF mode of the ACT is a monopole over northern East Asia, centred to the west of Lake Baikal, suggesting an increase in anticyclone activity over northern East Asia since 1970.
The upper tropospheric jets over East Asia experience significant changes during the 1948–2007 period. Before the mid-1960s, the sub-tropical jet shifts equatorward. Then, the jet shifts poleward until the mid-1970s, after which pronounced interannual variability and no apparent decadal variability are detected. The polar-front jet is weak before 1970 and is strengthened beginning in the mid-1980s. The increase in strength of the polar-front jet is likely partially responsible for the increase in cyclone and anticyclone activity, which implies an increase in the CTC and ATC or storm tracks over northern East Asia.
Acknowledgements
We thank Professor Jiayou Huang at Peking University and two anonymous reviewers for their insightful comments and constructive suggestions. This research is supported by the National Basic Research Program of China (Grant No. 2010CB428606), the Chinese Natural Science Foundation Key Project (Grant No. 41130962) and the Nansen Scientific Society.
Related Research Data
References
- Bengtsson L. , Hagemann S. , Hodges K. I . Can climate trend be calculated from re-analysis data?. J. Geophys. Res. Atmos. 2004; 109: D11111.
- Bengtsson L. , Hodges K. I. , Roeckner E . Storm tracks and climate change. J. Clim. 2006; 19: 3518–3543.
- Chang C.-P. , Wang Z. , Hendon H . Wang B . The Asian winter monsoon. The Asian Monsoon. 2006; Berlin: Praxis. 89–127.
- Chang E. K. M. , Fu Y . Interdecadal variations in northern hemisphere winter storm track intensity. J. Clim. 2002; 15: 642–658.
- Chang E. K. M. , Lee S. , Swanson K. L . Storm track dynamics. J. Clim. 2002; 15: 2163–2183.
- Charney J. G . The dynamics of long waves in a baroclinic westerly current. J. Meteorol. 1947; 4: 135–163.
- Chen L . Characteristics of Winter Cyclones and Anticyclones in China and Diagnosis Research of Their Interactions with Global Warming. 2013; China: Peking University. in Chinese Ph.D. dissertation.
- Chen L. , Tan B.-K. , Kvamstø N. G. , Johannessen O. M . Wintertime cyclone activity and its relation to precipitation over China. Atmos. Ocean. Sci. Lett. 2013; 6(5): 387–393.
- Chen Q. , Huang Y. , Wang Q. , Tan Z . A statistical study of the southwest vortices during 1990–2004. J. Nanjing University (Natural Sciences). 2007; 43: 633–642. in Chinese.
- Chen S. J. , Kuo Y. H. , Zhang P. Z. , Bai Q. F . Synoptic climatology of cyclogenesis over East Asia, 1958–1987. Mon. Weather Rev. 1991; 119: 1407–1418.
- Donohe A. , Battisti D. S . The amplitude asymmetry between synoptic cyclones and anticyclones: implications for filtering methods in feature tracking. Mon. Weather Rev. 2009; 137: 3874–3887.
- Eady E. T . Long waves and cyclone waves. Tellus. 1949; 1: 33–52.
- Flocas H. A. , Simmonds I. , Kouroutzoglou J. , Keay K . On cyclonic tracks over the eastern Mediterranean. J. Clim. 2010; 23: 5243–5257.
- Gao H . Comparison of East Asian winter monsoon indices. Adv. Geosci. 2007; 10: 31–37.
- Geng Q. , Sugi M . Variability of the North Atlantic cyclone activity in winter analysed from NCEP-NCAR reanalysis data. J. Clim. 2001; 14: 3863–3873.
- Hodges K. I . A general method for tracking analysis and its application to meteorological data. Mon. Weather Rev. 1994; 122: 2573–2586.
- Hodges K. I . Feature tracking on the unit sphere. Mon. Weather Rev. 1995; 123: 3458–3465.
- Hodges K. I . Spherical nonparametric estimators applied to the UGAMP model integration for AMIP. Mon. Weather Rev. 1996; 124: 2914–2932.
- Hodges K. I . Adaptive constrains for feature tracking. Mon. Weather Rev. 1999; 127: 1362–1373.
- Hodges K. I. , Hoskins B. J. , Boyle J. , Thorncroft C . A comparison of recent reanalysis datasets using objective feature tracking: storm tracks and tropical easterly waves. Mon. Weather Rev. 2003; 131: 2012–2037.
- Hodges K. I. , Lee R. W. , Bengtsson L . A comparison of extratropical cyclones in recent reanalyses ERA-interim, NASA MERRA, NCEP CFSR, and JRA-25. J. Clim. 2011; 24: 4888–4906.
- Hoskins B. J. , Hodges K. I . New perspectives on the Northern Hemisphere winter storm tracks. J. Atmos. Sci. 2002; 59: 1041–1061.
- Ioannidou L. , Yau M. K . A climatology of the Northern Hemisphere winter anticyclones. J. Geophys. Res. 2008; 113: D08119.
- Jones D. A. , Simmonds I . A climatology of Southern Hemisphere anticyclones. Clim. Dyn. 1994; 10: 333–348.
- Kalnay E. , Kanamitsu M. , Kistler R. , Collins W. , Deaven D. , co-authors . The NCEP/NCAR 40-year reanalysis project. Bull. Am. Meteorol. Soc. 1996; 77: 437–471.
- Konig W. , Sausen R. , Sielman F . Objective identification of cyclones in GCM simulations. J. Clim. 1993; 6: 2217–2231.
- Kumar A. , Jha B. , L'Heureux M . Are tropical SST trends changing the global teleconnection during La Nina?. Geophys. Res. Lett. 2010; 37: L12702.
- Kushnir Y. , Cardone V. J. , Greenwood J. G. , Cane M. A . The recent increase in North Atlantic wave heights. J. Clim. 1997; 10: 2107–2113.
- Lambert S. J . The effect of enhanced greenhouse warming on winter cyclone frequencies and strengths. J. Clim. 1995; 8: 1447–1452.
- Li H. , Dai A. , Zhou T. , Lu J . Responses of East Asian summer monsoon to historical SST and atmospheric forcing during 1950–2000. Clim. Dynam. 2010; 34: 501–514.
- Lim E.-P. , Simmonds I . Effect of tropospheric temperature change on the zonal mean circulation and SH winter extratropical cyclones. Clim. Dynam. 2009; 33: 19–32.
- Mailier P. J. , Stephenson D. B. , Ferro C. A. T. , Hodges K. I . Serial clustering of extratropical cyclones. Mon. Weather Rev. 2006; 134: 2224–2240.
- McCabe G. J. , Clark M. P. , Serreze M. C . Trends in Northern Hemisphere surface cyclone frequency and intensity. J. Clim. 2001; 14: 2763–2768.
- Meaquita M. D. S. , Atkinson D. E. , Simmonds I. , Keay K . New perspectives on the synoptic development of the severe October 1992 Nome storm. Geophys. Res. Lett. 2009; 36: L13808.
- Mesquita M. D. S. , Atkinson D. E. , Hodges K. I . Characteristics and variability of storm tracks in the North Pacific, Bering Sea, and Alaska. J. Clim. 2010; 23: 294–311.
- Murray R. J. , Simmonds I . A numerical scheme for tracking cyclone centres from digital data, Part I: development and operation of the scheme. Aust. Meteorol. Mag. 1991; 39: 155–166.
- Nakamura H. , Izumi T. , Sampe T . Interannual and decadal modulations recently observed in the Pacific storm track activity and East Asian winter monsoon. J. Clim. 2002; 15: 1855–1874.
- Neu U. , Akperov M. G. , Bellenbaum N. , Benestad R. , Blender R. , co-authors . IMILAST: a community effort to intercompare extratropical cyclone detection and tracking algorithms. Bull. Am. Meteorol. Soc. 2013; 94: 529–547.
- Nie J. , Wang P. , Yang W. , Tan B . Northern Hemisphere storm tracks in strong AO anomaly winters. Atmos. Sci. Lett. 2008; 9: 153–159.
- North G. R. , Bell T. L. , Cahalan R. F. , Moeng F. J . Sampling errors in the estimation of empirical orthogonal functions. Mon. Weather Rev. 1982; 110: 699–706.
- Pezza A. B. , Simmonds I. , Renwick J. A . Southern Hemisphere cyclones and anticyclones: recent trends and links with decadal variability in the Pacific Ocean. Int. J. Climatol. 2007; 27: 1403–1419.
- Pyper B. J. , Peterman R. M . Comparison of methods to account for autocorrelation in correlation analyses of fish data. Can. J. Fish. Aquat. Sci. 1998; 55: 2127–2140.
- Serreze M. C. , Carse F. , Barry R. G. , Rogers J. C . Icelandic low cyclone activity: climatological features, linkages with the NAO, and relationships with recent changes in the Northern Hemisphere circulation. J. Clim. 1997; 10: 453–464.
- Simmonds I. , Burke C. , Keay K . Arctic climate change as manifest in cyclone behavior. J. Clim. 2008; 21: 5777–5796.
- Simmonds I. , Keay K . Mean Southern Hemisphere extratropical cyclone behavior in the 40-year NCEP/NCAR reanalysis. J. Clim. 2000; 13: 873–885.
- Sinclair M. R . An objective cyclone climatology for the Southern Hemisphere. Mon. Weather Rev. 1994; 122: 2239–2256.
- Sinclair M. R . A climatology of anticyclones and blocking for the Southern Hemisphere. Mon. Weather Rev. 1996; 2: 245–263.
- Sinclair M. R . Objective identification of cyclones and their circulation intensity, and climatology. Weather Forecast. 1997; 12: 595–612.
- Sorteberg A. , Walsh J. E . Seasonal cyclone variability at 70°N and its impact on moisture transport into the Arctic. Tellus A. 2008; 60: 570–586.
- Walland D. , Simmonds I . Baroclinicity, meridional temperature gradients, and the southern semiannual oscillation. J. Clim. 1999; 12: 3376–3382.
- Wang L. , Chen W . How well do existing indices measure the strength of the East Asian winter monsoon?. Adv. Atmos. Sci. 2010; 27: 855–970.
- Wang L. , Huang R. H. , Gu L. , Chen W. , Kang L. H . Interdecadal variations of the East Asian winter monsoon and their association with quasi-stationary planetary wave activity. J. Clim. 2009a; 22: 4860–4872.
- Wang S. , Li D . Relationship between northern cyclones and climate change in northwest China (in Chinese). J. Glaciol. Geocryol. 2003; 25(5): 526–532.
- Wang X. , Jiang Z. , Zhai P. , Fan X. , Lu T . Study on climatic characteristics and variation of Mongolia cyclone (in Chinese). Meteorol. Environ. Sci. 2007a; 30(1): 35–38.
- Wang X. , Zhai P. , Wang C . Variations in extratropical cyclone activity in northern East Asia. Adv. Atmos. Sci. 2009b; 26(3): 471–479.
- Wang X. , Zou X. , Zhai P . Researches on extratropical cyclone variability in the Northern Hemisphere (in Chinese). Adv. Clim. Change Res. 2007b; 3(3): 154–157.
- Wang Y. , Guo P . Climatic characteristics of northern cyclone activity in spring and their relationship to rainfall and temperature in China (in Chinese). J. Nanjing Institute of Meteorol. 2005; 28(3): 391–397.
- Xu M. , Chang C. , Fu C. , Qi Y. , Robock A. , co-authors . Steady decline of East Asian monsoon winds, 1969–2000: evidence from direct ground measurements of wind speed. J. Geophys. Res. 2006; 111: D24111. 10.1029/2006JD007337.
- Yao S. , Zhang Y. , Zhou T . Climatic characteristics of extratropical cyclone frequency and its variations over East Asia during recent 50 years in spring (in Chinese). J. Nanjing Institute of Meteorol. 2003; 26(3): 317–323.
- Zhang Y. , Wang W.-C . Model-simulated northern winter cyclone and anticyclone activity under a greenhouse warming scenario. J. Clim. 1997; 10: 1616–1634.
- Zhang Y. X. , Ding Y. H. , Li Q. P . Interdecadal variations of extratropical cyclone activities and storm tracks in the Northern Hemisphere (in Chinese). Chinese J. Atmos. Sci. 2012; 36(5): 912–928.
- Zhao T. , Zhao D . Can artificial climate trends in global reanalysis be reduced by dynamical downscaling: a case study of China. Atmos. Ocean. Sci. Lett. 2011; 4(1): 30–35.
- Zhu Q. G. , Lin J. R. , Shou S. W. , Tang D. S . Principles of Synoptic Meteorology. 2000; 4th ed, Beijing: China Meteorological Press. 133–134. 647, (in Chinese).