
Abstract
Convectively coupled Kelvin waves (CCKW) are analysed using a cloud-resolving model to gain a better understanding of the mechanisms that initiate and drive these waves. We compare the modelled precipitation and vertical structure of a convectively coupled Kelvin wave to the mechanisms that control precipitation over warm tropical oceans: convective inhibition (CIN), saturation fraction, atmospheric stability and surface moist entropy fluxes. Our results show that the primary onset mechanism for precipitation associated with CCKW is CIN associated with a decrease in the threshold moist entropy. Saturation fraction and atmospheric instability exhibit a time lag in comparison with the rainfall evolution and are, therefore, not primary controls in the onset of these waves. The modelled CCKW evolve by starting with congestus convection, develop into deep convection and decay with the stratiform convection. The results from the presented model agree with observations and linearised models.
1. Introduction
Convectively coupled equatorial waves, in particular convectively coupled Kelvin waves (CCKW), control a substantial fraction of tropical rainfall variability (Kiladis et al., Citation2009). General circulation models do a fairly good job in producing CCKW, but due to their complexity, it is hard to understand why.
Cloud-resolving models (CRM) offer an alternate approach to simulating the CCKWs (e.g. Grabowski and Moncrieff, Citation2001; Kuang et al., Citation2005; Peters and Bretherton, Citation2006; Tulich et al., Citation2007; Tulich and Mapes, Citation2008). It is important to note that in the simpler context of a two-dimensional, non-rotating domain, convectively coupled gravity waves have longitudinal dynamics identical to CCKW, i.e. the gravity mode from two-dimensional models maps onto the equatorial Kelvin wave in the real rotating earth's atmosphere. Analysing the former provides considerable insight to understanding CCKWs with the computational efficiency of two-dimensional modelling (though for simplicity we refer to both as CCKWs). Two-dimensional CRM simulations have produced vertical structure resembling realistic CCKWs with near-surface cold pools below the regions of deepest convection (Tulich et al., Citation2007; Tulich and Mapes, Citation2008). These simulations also demonstrated gradual moistening of the lower troposphere by congestus convection ahead of the waves. While these show significant skill in producing signature CCKW structure, they do not tell us what mechanisms are responsible for that structure.
Simple linearised models present yet another way of looking into CCKWs (e.g. Mapes, Citation2000; Majda and Shefter, Citation2001a, Citation2001b; Majda et al., Citation2004; Khouider and Majda, Citation2006, Citation2007, Citation2008; Raymond and Fuchs, Citation2007 hereafter RF07; Kuang, Citation2008, Fuchs et al., Citation2012). Though there are significant differences in these models, they all generate CCKWs that propagate with the observed phase speed (Straub and Kiladis, Citation2002). The precipitation parametrisation in the models listed above can be described as either imposing a closure based on deep convective inhibition (DCIN; Mapes, Citation2000; RF07; Fuchs et al., Citation2012), or shallow Convective Available Potential Energy (CAPE)Footnote (Majda and Shefter, Citation2001a, Citation2001b; Majda et al., Citation2004; Khouider and Majda, Citation2006, Citation2007, Citation2008; Kuang, Citation2008). DCIN can be viewed as the negative of the lower tropospheric CAPE, thus the two essentially provide the same information, though the lower tropospheric CAPE may cover more vertical range, depending on its definition. However, it is important to note that the essential results of these models – the propagating phase speed, the growth rate and the vertical structure – can be obtained without prescribing the vertical heating profile with phase lag as a function of time (RF07). Fuchs et al. (Citation2012) showed that top-heavy vertical heating profiles favour CCKWs, but that they are not a necessary requirement. In light of the differences between these linear models, the goal of this work is to use a CRM to identify the mechanisms primarily responsible for initiating CCKWs.
Observations, though limited, can provide some insight to the mechanisms responsible for the Kelvin wave vertical structure. An example of a particularly clean CCKW (Straub and Kiladis, Citation2002) was observed during the TEPPS project (Tropical East Pacific Process Study; Yuter and Houze, Citation2000). During this project, the research vessel Ronald H. Brown was stationed near 125°W, 8°N for approximately 2 weeks in August 1997. The ship was equipped with a C-band scanning Doppler radar, made in situ weather observations and launched six radiosondes per day. RF07 analysed the radiosonde observations from this project to obtain the time series of DCIN and saturation fraction (precipitable water divided by saturated precipitable water). They showed that the deep convection and resulting precipitation were related to the moistening of the atmosphere, but the onset of precipitation was delayed approximately 1 d by the existence of a stable layer. In this case, DCIN played a significant role in the timing of the precipitation in this event.
Further evidence for DCIN control was demonstrated by Raymond et al. (Citation2003) based on in situ observations in the tropical east Pacific based on data collected from the East Pacific Investigation of Climate (2001) field project. They found that the existence of even a weak stable layer just above the planetary boundary layer is sufficient to inhibit the development of deep convection and associated precipitation. This confirms earlier results that Firestone and Albrecht (Citation1986) obtained from dropsonde measurements in the tropical Pacific. Large-scale dry adiabatic lifting by Kelvin waves can cause a change in DCIN. Large-scale lifting acts to force convection because dry adiabatic ascent cools the air near cloud base relative to the surface, which has the effect of reducing DCIN.
Relaxation of convective inhibition (CIN) is not the only process found to be important for the onset and strength of precipitation. Bretherton et al. (Citation2004) used passive microwave satellite observations and found that precipitation is highly correlated with the saturation fraction of the troposphere. Raymond et al. (Citation2007) developed a new conceptual theoretical relation between the precipitation and saturation fraction that nicely described the high correlation between the two from a cumulus ensemble model. Sobel et al. (Citation2004) reached similar conclusions using data taken near Kwajelein Island. Results from numerical cloud models also support this strong correlation between precipitation and saturation fraction (Lucas et al., Citation2000; Derbyshire et al., Citation2004; Raymond and Zeng, Citation2005; Hirons et al., Citation2013).
In addition to CIN and saturation fraction, Raymond et al. (Citation2003) found that precipitation is highly correlated with surface moist entropy fluxes in the tropical east Pacific. This is in agreement with similar observations from the equatorial western Pacific by Raymond (Citation1995) and over the entire tropical Pacific by Back and Bretherton (Citation2005).
The main objective of this paper is to sort out the mechanisms responsible for the onset of CCKW, i.e. the physics behind the coupling between the Kelvin wave and convection. To do this, we analyse a CCKW generated from a CRM and compare the simulated precipitation and vertical structure to the various factors that control precipitation over warm oceans. Based on the above observations, and on the linear theory of RF07, we will focus on four main mechanisms: DCIN, saturation fraction, atmospheric stability and surface moist entropy fluxes.
This paper is organised as follows: Section 2 introduces the physical parameters that are relevant for tropical convection and precipitation, and thus for CCKWs. Section 3 presents the numerical experiments using the CRM; the results are given in Section 4; and conclusions are drawn in Section 5.
2. Physical parameters
Before we start the analysis of our model results, we verify that the modelled mode's evolution of the vertical mass flux profiles exhibits the signature evolution associated with large-scale disturbances: Initiation of congestus convection with a bottom-heavy vertical mass flux profile, which develops into deep convection, and decays with stratiform convection characterised by a top-heavy vertical mass flux profile.
We then concentrate on several key variables, which distinguish characteristics of convection associated with CCKWs compared to that observed in other large-scale phenomena. In the analysis of our modelled CCKW, we focus on DCIN, saturation fraction, an instability index and surface moist entropy fluxes, which we define below.
In order to initiate congestus convection that will lead to a CCKW, the atmosphere over tropical oceans requires a conditionally unstable layer. That layer can form by large-scale lifting that cools the air relative to the surface through adiabatic ascent near cloud base. This was observed in TEPPS and suggested by RF07. Thus, we adopt a measure of DCIN initially introduced by Raymond et al. (Citation2003),1
where the boundary layer entropy, s
bl
, is defined as the average moist entropy in the lowest 1750 m, and the threshold moist entropy, , is taken as the average saturated moist entropy over the thinner threshold layer (2000–2500 m).Footnote
The specific values are somewhat arbitrary, but slightly different choices don't affect qualitative results. The average moist entropy in the boundary layer mostly depends on surface fluxes and downdrafts, while the threshold moist entropy that also represents the temperature profile depends on the tropospheric vertical motion. DCIN will be negative if there are higher values of s
bl
and slightly cooler than average temperatures above the threshold layer leading to lower values of
.
In addition to CIN, observations and models have shown a sensitivity of precipitation to ambient moisture. To investigate this, we compare the modelled precipitation with the saturation fraction, which is defined in terms of the precipitable water from our CRM. It is calculated as the precipitable water divided by saturated precipitable water, which is approximated here by2
where the integrals are taken from the surface to the tropopause height, h; s is the moist entropy, s* is the saturated moist entropy and s d is the dry entropy. Though there are several hypotheses for the relation between saturation fraction and precipitation (Bretherton et al., Citation2004; Raymond et al., Citation2007; Peters and Neelin, Citation2006), all of them exhibit a very sharp increase in precipitation with a modest increase in moisture.
Finally, a numerical study by Raymond and Sessions (Citation2007) found that both the precipitation rate and the level of maximum vertical mass flux were sensitive to the atmospheric stability. Their simulations showed that an increase in atmospheric stability produced convection with a bottom heavy mass flux profile (i.e. the altitude of the maximum in the mass flux profile decreased significantly). Bottom-heavy convection concentrates convergence to lower, moister levels which effectively increases the precipitation rates. To investigate the role of this effect, we define an instability index as in Raymond et al. (Citation2011):3
where is the saturated moist entropy averaged over the 1–3 km layer and
is the saturated moist entropy averaged over the 5–7 km layer. If the environment is saturated, smaller Δs* corresponds to greater stability, which promotes higher precipitation rates, according to Raymond and Sessions (Citation2007).
RF07 derived an analytical model for large-scale waves which isolated the contributions of several of the physical processes mentioned above. In their model, the total precipitation, P, is the sum of three contributions:4
Here, P
1 is the contribution of precipitation from the saturation fraction:5
where q is the scaled mixing ratio and α is a moisture adjustment rate. The contribution to precipitation from surface flux variations is:6
where E is the scaled surface evaporation rate anomaly, λ
s
a constant representing the sensitivity of CIN to surface evaporation rate and µ
CIN is a parameter that governs the sensitivity of precipitation rate to this inhibition. The third term, P
2t
, is related to variations in the buoyancy just above the boundary layer:7
Here, b is the buoyancy at height D (taken to be 2 km) and λ t is a constant representing the sensitivity of precipitation to variations in b at this level. For more details see RF07.
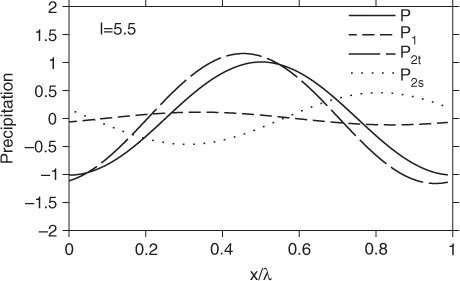
is a result from RF07, which shows the contribution to precipitation for each of the terms in equation 4 as a function of wave phase for a convectively coupled Kelvin mode with zonal wavenumber l=5.5. The total precipitation is given by a solid line, the saturation fraction contribution by a short dashed line, the CIN contribution by a long dashed line and the surface fluxes contribution by the dotted line. The CIN contribution to precipitation is by far the most significant, while the saturation fraction contribution is negligible. In contrast, RF07 presented a similar decomposition for the moisture mode – a mode in which precipitation increases with tropospheric humidity while the convection itself increases humidity (Sugiyama, Citation2009a, Citation2009b) – in which the CIN contribution was negligible (results not shown here). Their analytic model thus demonstrated that different large-scale waves – convectively coupled Kelvin modes and moisture modes – are primarily driven by distinct mechanisms (CIN and saturation fraction, respectively). One goal of this work is to determine whether a simulated CCKW exhibits this distinction.
Fig. 1 Decomposition of precipitation as a function of wave phase (x/λ, where x is position and λ is the horizontal wavelength) in a simple model of RF07 for the eastward-moving convectively coupled Kelvin mode with zonal wavenumber l=5.5. The solid line is the total precipitation (left hand side of equation 4); the short dashed line (P 1) is the contribution due to saturation fraction; the long dashed line (P 2t ) is the CIN contribution; and the dotted line (P 2s ) is the contribution due to surface fluxes.
In the next section, we describe a numerical experiment in which we simulate a CCKW and examine the relationship between precipitation, saturation fraction, instability index and DCIN. The purpose of the experiment is to determine which of these mechanisms is responsible for the onset of the CCKW (the three-dimensional equivalent of a two-dimensional convectively coupled gravity wave), and whether that agrees with the results of RF07.
3. Numerical experiments
In order to investigate the major contributions to the precipitation in CCKWs, we performed a simulation similar to Tulich et al. (Citation2007) using the CRM of Raymond and Zeng (Citation2005). The simulation is on a two-dimensional domain with no rotation, but as stated before the gravity waves from two-dimensional model map directly to CCKWs in three dimensions where rotation is included.
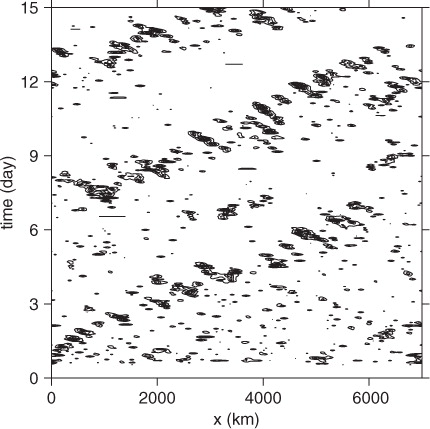
The two-dimensional domain extends to 20 km elevation with 250 m vertical resolution and has a horizontal dimension of 7000 km with 1 km resolution. We initiated the simulation with potential temperature and mixing ratio profiles obtained by averaging the last 35 d of a 58-d radiative convective equilibrium (RCE) simulation on a two dimensional domain with a horizontal dimension of 800 km, 1 km resolution, and with the same prescribed magnitude of surface fluxes as used in the experiment. In the CCKW experiment, we imposed a 5 ms−1 horizontal wind from the east over an ocean with a 303 K surface temperature. The model has source and sink terms to keep the average surface horizontal wind approximately constant throughout the run. shows a Hovmöller diagram of the precipitation in mm day−1 for the entire 7000 km domain. Similar to the results from Tulich et al. (Citation2007), our CRM produces a large-scale wave that travels at about 15 ms−1 to the east. Embedded in the wave packet are smaller mesoscale convective systems (MCSs) moving toward the west with a speed of about 6 ms−1. MCS structures embedded in a larger scale wave packet have been observed in similar numerical experiments (Numaguti and Hayashi Citation2000; Tulich et al. Citation2007). The westward propagation of these MCSs may be attributed to the imposed background 5 ms−1 wind from the east. Propagation at speeds faster than the basic easterly state is attributed to equatorial inertio gravity waves (Numaguti and Hayashi Citation2000; Tulich et al. Citation2007; Kiladis et al. Citation2009); this is not a likely mechanism in this work because there is no rotation and drift with the background state can account for their motion.
Fig. 2 The modelled evolution of rainfall over the 7000 km domain. The contour intervals are 20 mm day−1, with a maximum values ranging between 60 and 100 mm day−1. The wave speed is about 15 ms−1 toward the east (right).
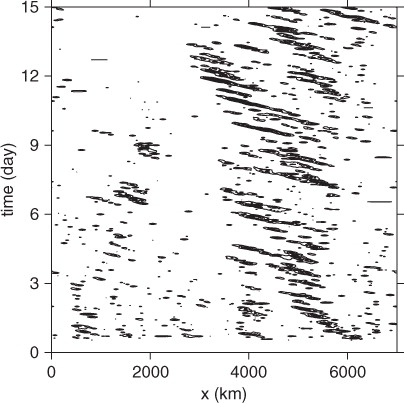
To analyse the vertical structure and properties of the environment as the wave passes, we perform a Galilean transformation of the stationary reference frame to one that moves at the phase speed of the wave. The corresponding rainfall contour is shown in . In this reference frame, we can take a time average over the wave to obtain the statistical properties of the environment as the wave passes. Note that in , the right side of the strip of precipitation corresponds to the onset of the wave; the evolution proceeds from right to left and decays at the left edge of the band of precipitation.
Fig. 3 Same as , but plotted in a reference frame moving at the phase speed of the wave (15 ms−1). In this reference frame, the wave is initiated on the right side of the strip of precipitation (approximately 6000 km), and the decay is on the left edge (3500 km).
4. Results
In this section, we analyse the model results to compare with the conclusions of RF07. We first check the modelled evolution of vertical mass flux with the observed structure in CCKWs, and then investigate the role of DCIN, saturation fraction, instability index and surface moist entropy fluxes in relation to the precipitation rate. We present the modelled results as a function of time, where the time evolution can easily be inferred by dividing the horizontal length of the spatial domain (7000 km) by the wave speed (15 ms−1). However, this gives a backward time evolution (the initiation of the wave is on the right, rather than left side of the wave) so we compensate by reversing direction. We do this for a more intuitive presentation of the data analysis.
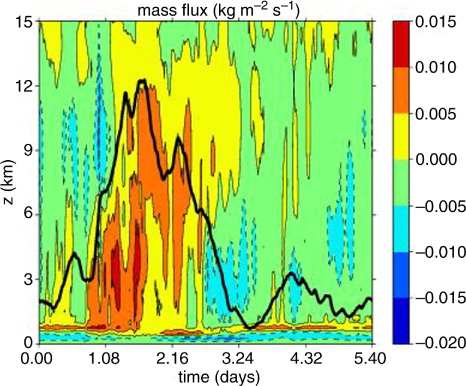
shows a contour plot of the vertical mass flux profile with the precipitation rate superposed for comparison. Note that prior to the rainfall peak, the maximum mass flux is confined to the layer below 7 km; the CCKW starts out with congestus convection and a bottom heavy vertical heating profile, which develops into deep convection with upward mass flux extending to 12 km, and decays with maximum mass flux in the layer between 7 and 12 km (i.e. top heavy vertical heating profile) representative of stratiform convection. This indeed demonstrates that the simulated CCKW exhibits the expected heating pattern associated with observed CCKW heating structure (Straub and Kiladis, Citation2003 and Kiladis et al., Citation2009).
Fig. 4 Contours show the modelled mass flux for CCKW as a function of height. For comparison, the rain rate is shown with a solid line.
Next, we investigate the time evolution of DCIN and surface entropy fluxes. shows the precipitation rate obtained for the modelled CCKW as a function of time as the wave passes a fixed location (top panel), DCIN (middle panel) and the contribution to DCIN by the threshold moist entropy and the boundary layer moist entropy s
bl
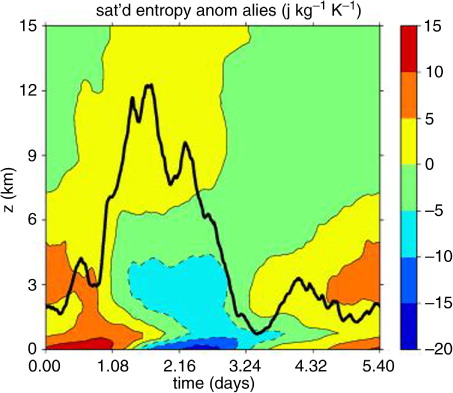
(bottom panel). The first thing to notice is that the negative excursions of DCIN either coincide with or lead with the development of rain. This is consistent with the RF07 result showing the CIN contribution to precipitation slightly leads the precipitation maximum (see ). Prior to the heavy rain peak in , DCIN is slightly positive due to the existence of a stable layer centred near 3 km (see ),
slightly increases while s
bl
is steady. This is followed by a sharp decrease in the threshold moist entropy
associated with a breakdown of the stable layer, as illustrated in , and consequently a negative value of DCIN. The decrease in the boundary layer moist entropy, s
bl
, probably due to the convective downdrafts, lags
by a couple of hours, which keeps the DCIN negative. After the passage of the wave axis, both
and the boundary layer moist entropy s
bl
increase. However, there is a delay in the increase of s
bl
compared to
because subsidence in the CCKW after the convective peak causes
to increase while rain evaporation keeps s
bl
low. This pattern is also evident in soundings taken in subsiding air following the passage of a MCS (called ‘onion soundings’ because they resemble the shape of an onion; Zipser, Citation1977). The earlier increase in
with a magnitude larger than the increase in s
bl
contributes to DCIN becoming positive, and it remains positive during the suppressed convective part of the CCKW.
Fig. 5 The top panel shows the modelled precipitation rate for CCKW as a function of time; the middle panel shows modelled DCIN is solid line (dashed line is precipitation rate); and the bottom panel shows modelled threshold moist entropy, , and the boundary layer moist entropy, s
bl
.
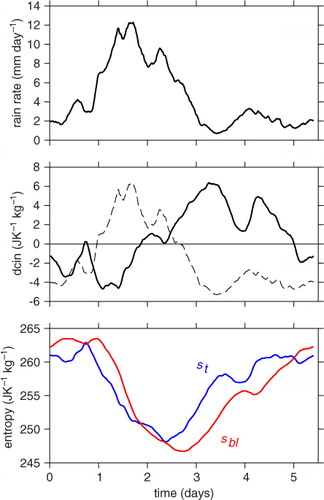
Fig. 6 Modelled saturated moist entropy anomalies are shown in contours; rain is shown with a solid line.
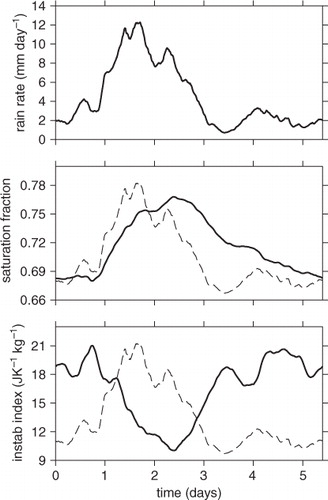
Finally, compares the precipitation rate of CCKW (top panel) to the saturation fraction (middle panel) and the instability index (bottom panel). These controlling factors are considered in the context of the numerical results reported in Raymond and Sessions (Citation2007). In particular, they found that more stable environments (characterised here by a smaller instability index) produce more bottom heavy convection. This concentrates the convergence to the lowest levels which are characteristically more moist, and consequently, produce higher precipitation rates. Based on these results, we might expect the timing of the minimum in instability index and maximum in saturation fraction to coincide with strong bottom heavy convection. Comparing the instability index and saturation fraction (middle and bottom panels of ) with the mass flux contours (), we see this is not the case at all. The strong bottom heavy convection occurs just after day 1 (mass flux maximum occurs near 3 km), while the instability index minimum and saturation fraction maximum occur near day 2.5. Also, the extrema in saturation fraction and instability index lags the precipitation peak by about a day, suggesting that these mechanisms are not primary controls in the onset of CCKWs. It is interesting to note that the saturation fraction continues to increase after the precipitation peak despite drying by the precipitation. This is a result of the deep convective heating that persists up to day 2.5 (see ). As the convection transitions from deep to stratiform, the saturation fraction decreases and the instability index begins to recover from its minimum. Similar to Raymond et al. (Citation2011), there is a correlation between saturation fraction and instability index throughout the passage of the wave.
Fig. 7 The top panel shows the modelled precipitation rate for a CCKW as a function of time; the middle panel shows the modelled saturation fraction; and the bottom panel shows the modelled instability index.
To summarise, negative excursions of DCIN due to the breakdown of the stable layer either coincide with or lead the development of rain. The break down of the stable layer can be associated with large-scale dry adiabatic lifting by the Kelvin wave itself: large-scale lifting acts to force convection because dry adiabatic ascent cools the air near cloud base relative to the surface. In contrast, the increase and saturation fraction and decrease in instability index do not occur until after the demise of the stable layer; their respective extrema lag the precipitation maximum. Therefore, we conclude that DCIN plays a significant role in the timing of precipitation and is consequently the most important mechanism controlling the onset of CCKWs. This result is in agreement with RF07.
5. Conclusions
Figures (Citation5–Citation7) obtained for CCKW in our CRM tell an interesting story. The CCKW forms similar to most large-scale disturbances in the tropics. It starts with congestus convection, develops into deep convection and decays into stratiform convection. This modelled structure agrees with the observations for CCKWs (Straub and Kiladis, Citation2003 and Kiladis et al., Citation2009), but it is not essential to the CCKW dynamics (Fuchs et al., Citation2012). Saturation fraction and instability index in our model lag the rainfall distribution, and the deep convection and resulting precipitation related to the moistening of the atmosphere are delayed approximately 1 d because of the existence of a stable layer. The demise of the stable layer causes the DCIN to decrease and its excursion to negative values leads the rainfall indicating that the onset of CCKW – or its coupling to convection – is triggered by DCIN.
Separating DCIN into components gives some insight as to whether DCIN in our model is dominated by surface entropy or saturated entropy aloft. shows that DCIN decreased as a result of the decrease in the threshold moist entropy, . The boundary layer moist entropy, s
bl
, at that moment kept steady, then slightly increased, contributing to negative DCIN, and only after approximately 6 h did it start to decrease. Due to that lag, DCIN remained negative as entropy aloft continued to decrease. After the passage of the wave, both
and s
bl
started increasing and DCIN became positive. From this we can conclude that DCIN decreased as a result of the disappearance of the stable layer aloft and that DCIN played a significant role in the timing of the precipitation resulting from CCKWs.
There are very few in situ observations of equatorial Kelvin waves in the literature – we know of only one: the study of a Kelvin wave in the east Pacific by Straub and Kiladis (Citation2002). RF07 performed some additional analysis on the radiosonde time series from this case. They showed that DCIN decreased prior to the passage of the wave and increased afterwards, in agreement with both the analytic and numerical models. However, more of the decrease in DCIN in the observed case was due to an increase in the boundary layer moist entropy than in our models. There was also a larger increase in the saturation fraction during the wave passage – a consequence of a greater precipitable water (the numerator in the saturation fraction) – than expected from a satellite study of Kelvin waves by Roundy and Frank (Citation2004). They commented that this case may be uncharacteristic of equatorial Kelvin waves in general.
While this observation points to a discrepancy in the factors controlling DCIN – which depend on whether the surface moist entropy leads or lags the saturated threshold entropy – there is no discrepancy in the role that DCIN itself plays in the onset of CCKWs. This is an important result which distinguishes CCKWs from other large-scale disturbances, i.e. from other convectively coupled equatorial waves as well as from the moisture mode. More in situ observational studies of equatorial Kelvin waves are needed to determine the factors that control DCIN itself.
6. Acknowledgments
We thank two anonymous reviewers whose comments helped improve this manuscript. This work was funded by the European Commission's 7th Framework Program, under Grant Agreement number 282672, EMBRACE project, by US National Science Foundation Grants ATM-0352639, ATM-1020149, and AGS-1056254.
Notes
Shallow CAPE integrates the buoyancy of undiluted parcels only up to the mid-troposphere (for example, refer to Kuang 2008).
Layer thickness and heights used in the definitions of DCIN and instability index represent typical observed values of characteristic regions over tropical oceans.
References
- Back L. E , Bretherton C. S . The relationship between wind speed and precipitation in the Pacific ITCZ. J. Clim. 2005; 18: 4317–4328.
- Bretherton C. S , Peters M. E , Back L. E . Relationships between water vapor path and precipitation over the tropical oceans. J. Clim. 2004; 17: 1517–1528.
- Derbyshire S. H , Beau I , Bechtold P , Grandpeix J.-Y , Piriou J.-M , co-authors . Sensitivity of moist convection to environmental humidity. Quart. J. Roy. Meteor. Soc. 2004; 130: 3055–3079.
- Firestone J , Albrecht B. A . The structure of the atmospheric boundary layer in the central equatorial Pacific during FGGE. Mon. Wea. Rev. 1986; 114: 2219–2231.
- Fuchs Ž , Gjorgjievska S , Raymond D. J . Effects of varying the shape of the convective heating profile on convectively coupled gravity waves and moisture modes. J. Atmos. Sci. 2012; 69: 2505–2519.
- Grabowski W. W , Moncrieff M. W . Large-scale organization of tropical convection in two-dimensional explicit numerical simulations. Quart. J. Roy. Met. Soc. 2001; 127: 445–468.
- Hirons L. C , Inness P , Vitart F , Bechtold P . Understanding advances in the simulation of intraseasonal variability in the ECMWF model. Part II: the application of process-based diagnostics. Q. J. Roy. Meteor. Soc. 2013; 139: 1427–1444.
- Kiladis G. N , Wheeler M. C , Haertel P. T , Straub K. H , Roundy P. E . Convectively coupled equatorial waves. Rev. Geophys. 2009; 47: 2003.
- Khouider B , Majda A. J . A simple multicloud parameterization for convectively coupled tropical waves. Part I: linear analysis. J. Atmos. Sci. 2006; 63: 1308–1323.
- Khouider B , Majda A. J . A simple multicloud parametrization for convectively coupled tropical waves. Part II: nonlinear simulations. J. Atmos. Sci. 2007; 64: 381–400.
- Khouider B , Majda A. J . Multi-cloud models for organized tropical convection: enhanced congestus heating. J. Atmos. Sci. 2008; 65: 895–914.
- Kuang Z . A moisture-stratiform instability for convectively coupled waves. J. Atmos. Sci. 2008; 65: 834–854.
- Kuang Z , Blossey P. N , Bretherton C. S . A new approach for 3D cloud resolving simulations of large scale atmospheric circulation. Geophys. Res. Letts. 2005; 32: 02809.
- Lucas C , Zipser E. J , Ferrier B. S . Sensitivity of tropical west Pacific oceanic squall lines to tropospheric wind and moisture profiles. J. Atmos. Sci. 2000; 57: 2351–2373.
- Majda A. J , Khouider B , Kiladis G. N , Straub K. H , Shefter M. G . A model for convectively coupled tropical waves: nonlinearity, rotation, and comparison with observations. J. Atmos. Sci. 2004; 61: 2188–2205.
- Majda A. J , Shefter M. G . Waves and instabilities for model tropical convective parameterizations. J. Atmos. Sci. 2001a; 58: 896–914.
- Majda A. J , Shefter M. G . Models for stratiform instability and convectively coupled waves. J. Atmos. Sci. 2001b; 58: 1567–1584.
- Mapes B. E . Convective inhibition, subgrid-scale triggering energy, and stratiform instability in a toy tropical wave model. J. Atmos. Sci. 2000; 57: 1515–1535.
- Numaguti A , Hayashi Y . Gravity-wave dynamics of the hierarchical structure of super cloud clusters. J. Meteor. Soc. Japan. 2000; 78: 301–331.
- Peters M. E , Bretherton C. S . Structure of tropical variability from a vertical mode perspective. Theor. Comp. Fluid. Dyn. 2006; 20: 501–524.
- Peters O , Neelin J. D . Critical phenomena in atmospheric precipitation. Nat. Phys. 2006; 2: 393–396.
- Raymond D. J . Regulation of moist convection over the west Pacific warm pool. J. Atmos. Sci. 1995; 52: 3945–3959.
- Raymond D. J , Fuchs Ž Convectively coupled gravity and moisture modes in a simple atmospheric model. Tellus A. 2007; 59: 627–640.
- Raymond D. J , Raga G. B , Bretherton C. S , Molinari J , López-Carrillo C , co-authors . Convective forcing in the intertropical convergence zone of the eastern Pacific. J. Atmos. Sci. 2003; 60: 2064–2082.
- Raymond D. J , Sessions S. L . Evolution of convection during tropical cyclogenesis. Geophys. Res. Lett. 2007; 34: 06811.
- Raymond D. J , Sessions S , Fuchs Ž A theory for the spinup of tropical depressions. Q. J. Roy. Meteorol. Soc. 2007; 133: 1743–1754.
- Raymond D. J , Sessions S. L , Lopez Carrillo C . Thermodynamics of tropical cyclogenesis in the northwest Pacific. J. Geophys. Res. 2011; 116: 18101.
- Raymond D. J , Zeng X . Modelling tropical atmospheric convection in the context of the weak temperature gradient approximation. Q. J. Roy. Meteorol. Soc. 2005; 131: 1301–1320.
- Roundy P. E , Frank W. M . A climatology of waves in the equatorial region. J. Atmos. Sci. 2004; 61: 2105–2132.
- Sobel A. H , Yuter S. E , Bretherton C. S , Kiladis G. N . Large-scale meteorology and deep convection during TRMM KWAJEX. Mon. Wea. Rev. 2004; 132: 422–444.
- Straub K. H , Kiladis G. N . Observations of a convectively coupled Kelvin wave in the eastern Pacific ITCZ. J. Atmos. Sci. 2002; 59: 30–53.
- Straub K. H , Kiladis G. N . The observed structure of convectively coupled Kelvin waves: comparison with simple models of coupled wave instability. J. Atmos. Sci. 2003; 60: 1655–1668.
- Sugiyama M . The moisture mode in the quasi-equilibrium tropical circulation model. Part I: analysis based on the weak temperature gradient approximation. J. Atmos. Sci. 2009a; 66: 1507–1523.
- Sugiyama M . The moisture mode in the quasi-equilibrium tropical circulation model. Part II: nonlinear behavior on an equatorial beta plane. J. Atmos. Sci. 2009b; 66: 1525–1542.
- Tulich S. N , Mapes B. E . Multiscale convective wave disturbances in the tropics: insights from a two-dimensional cloud-resolving model. J. Atmos. Sci. 2008; 65: 140–155.
- Tulich S. N , Randall D. A , Mapes B. E . Vertical-mode and cloud decomposition of large-scale convectively coupled gravity waves in a two-dimensional cloud-resolving model. J. Atmos. Sci. 2007; 64: 1210–1229.
- Yuter S. E , Houze Jr., R. A . The 1997 Pan American Climate Studies tropical eastern Pacific process study. Part I: ITCZ region. Bull. Am. Meteor. Soc. 2000; 81: 451–481.
- Zipser E. J . Mesoscale and convective – scale downdrafts as distinct components of squall-line structure. Mon. Wea. Rev. 1977; 105: 1568–1589.