
Abstract
Coastal low-level jets (CLLJ) are a low-tropospheric wind feature driven by the pressure gradient produced by a sharp contrast between high temperatures over land and lower temperatures over the sea. This contrast between the cold ocean and the warm land in the summer is intensified by the impact of the coastal parallel winds on the ocean generating upwelling currents, sharpening the temperature gradient close to the coast and giving rise to strong baroclinic structures at the coast. During summertime, the Iberian Peninsula is often under the effect of the Azores High and of a thermal low pressure system inland, leading to a seasonal wind, in the west coast, called the Nortada (northerly wind). This study presents a regional climatology of the CLLJ off the west coast of the Iberian Peninsula, based on a 9 km resolution downscaling dataset, produced using the Weather Research and Forecasting (WRF) mesoscale model, forced by 19 years of ERA-Interim reanalysis (1989–2007). The simulation results show that the jet hourly frequency of occurrence in the summer is above 30% and decreases to about 10% during spring and autumn. The monthly frequencies of occurrence can reach higher values, around 40% in summer months, and reveal large inter-annual variability in all three seasons. In the summer, at a daily base, the CLLJ is present in almost 70% of the days. The CLLJ wind direction is mostly from north-northeasterly and occurs more persistently in three areas where the interaction of the jet flow with local capes and headlands is more pronounced. The coastal jets in this area occur at heights between 300 and 400 m, and its speed has a mean around 15 m/s, reaching maximum speeds of 25 m/s.
1. Introduction
The term “low-level jet” is loosely used to describe a low-level wind speed maximum, in the vertical, typically centred between 100 and 1000 m above the surface. Low-level jets have been found in several places globally, over the land and the ocean, with a wide diversity of physical characteristics and forcing conditions. A coastal jet is a low-tropospheric mesoscale wind feature driven by a pressure gradient produced by a sharp contrast between high temperatures over land and lower temperatures over the sea (Chao, Citation1985). Coastal low-level jets (CLLJ), although being a regional phenomenon, have a characteristic large-scale synoptic forcing behind them: a high pressure system over the ocean and a thermal low inland. The resulting coast-parallel flow is the consequence of the geostrophic adjustment, with the Coriolis force deflecting the flow equatorward. Due to its synoptic forcing CLLJ occur, with one exception, in the eastern flank of the semi-permanent oceanic mid-latitude high pressure systems, along the cold equatorward eastern boundary currents (Ranjha et al., Citation2013). Winant et al. (Citation1988) mention the potential areas of occurrence of CLLJ, along the cold currents of California, Peru–Chile, Benguela, Portugal–Canary, and West Australia, all in eastern mid-latitude oceanic areas, and offshore the coasts of Somalia–Oman (the exception). In spite of its relatively low height, CLLJ have a large horizontal extent that can exceed hundreds of kilometres offshore (Chao, Citation1985; Bridger et al., Citation1992).
The ocean response to the CLLJ flow can be seen as a decrease in the sea surface temperature (SST) at the coast due to upwelling. The coast-parallel winds are responsible for an offshore Ekman transport, and the upwelling of deeper and cold waters (Vallis, Citation2012). Moreover, the colder SST are enhanced by Ekman pumping when the along-coast wind stress has a cross-coast gradient (curl), such as happens at capes or points (Haack et al., Citation2005). The lowering of the SST at the coast leads to a sharpening of the land–sea temperature gradient close to the coast, and to a positive feedback that further intensifies the wind speed. For this reason, in spite of being an atmospheric phenomenon, CLLJ are strongly linked to the regional ocean dynamics, and have impacts both in the atmosphere and the ocean through an intrinsic atmosphere–ocean coupling process (Beardsley et al., Citation1987).
CLLJ play an important role in the definition of the regional climates of the mid-latitude western continental regions. The decrease of the SST along the coast due to upwelling limits the ocean surface evaporation, and the strong coast-parallel flow prevents the advection of marine air inshore, which considerably limits the water vapour content of the air over land, contributing to the aridity and dryness of some of the mid-latitude western coastal regions (Warner, Citation2004). At the same time, the presence of CLLJ can significantly modify the vertical wind shear and the turbulence structure of the marine atmospheric boundary layer (MABL), playing an important role in the mixing and transport processes in the lower atmosphere, and therefore on local weather, influencing coastal fog and low-level clouds or coastally trapped disturbances (Nuss et al., Citation2000). Upwelling coastal regions, driven by the coast-parallel winds, are rich in nutrients, which are essential to the fish food chain. Not surprisingly some of the main oceanic fishing areas are located along upwelling-CLLJ areas (Pauly and Christensen, Citation1995).
Several studies have addressed the dynamics of CLLJ, mostly on the California jet (Winant et al., Citation1988; Burk and Thompson, Citation1996; Cui et al., Citation1998; Dorman et al., Citation1999; Tjernström and Grisogono, Citation2000; Edwards et al., Citation2001), showing that thermal wind processes, along with the land–sea temperature gradient define its structure. Due to the synoptic forcing, the large-scale flow in the MABL is equatorward and coast-parallel. The strong baroclinic structure between the warm land and the cold ocean leads to a pressure gradient maximum near the coast, decreasing both offshore and inshore (Holt, Citation1996; Parish, Citation2000). Through thermal wind considerations, as the equator-ward wind speed decreases towards the surface due to friction; a low-level wind maximum is generated. This wind maximum is the CLLJ core, located at a height of the order of hundreds of metres, at the MABL capping temperature inversion (Tjernström and Grisogono, Citation2000). CLLJ usually occur near coastal topography, and a good example is the California CLLJ, but that is not an exclusive ingredient, since coastal jets have also been found near coastal areas without steep topography (Dorman et al., Citation2000). Coastal topography, if higher than the MABL inversion, blocks cross-coast flow and contributes to the acceleration of the jet flow, which is channelled by several boundaries: the coastal topography to the coast, the ocean surface and the MABL inversion (Winant et al., Citation1988). The inversion of the temperature vertical profile is generated by a cooled surface air temperature due to the effect of cold SST, and by a warmer air aloft due to subsiding air in the west flank of the high pressure system (Winant et al., Citation1988). Another important feedback is the inversion strength dependency on the jet itself: the stronger the jet, the greater the mixing within the MABL, sharpening the inversion what gives rise to a stronger jet. The MABL height decreases (tilts) landward, and is relatively shallow at the coast (Beardsley et al., Citation1987; Burk and Thompson, Citation1996). The sloping inversion generates a maximum horizontal temperature gradient at the inversion, enhancing baroclinicity, and therefore the thermal wind is the largest right at the inversion (Beardsley et al., Citation1987; Gerber et al., Citation1989).
As shown, for example, by Winant et al. (Citation1988), Pomeroy and Parish (Citation2000) and Tjernström and Grisogono (Citation2000), the CLLJ flow is affected by points and capes, and by the coastal orientation, enhancing the local wind speed or modifying the flow direction. The interaction of the flow with headlands generates gravity waves that propagate on the MABL inversion and are responsible in this context for the adjustment of the flow (Ström et al., Citation2001). If these gravity waves have a phase speed lower than the wind speed, they cannot propagate upstream and the flow is said to be supercritical (Tjernström, Citation1999). When the coast opens away from the oncoming supercritical flow, an expansion fan develops to smoothly turn the flow around the bend, accompanied by a decrease of the MABL height and by an increase of the wind speed due to a Bernoulli effect. For this reason, the CLLJ wind speed is usually higher and the SST lower in the lee of headlands (Haak et al., Citation2000; Tjernström and Grisogono, Citation2000). If the coast bends inward, the flow is decelerated and transits from super- to sub-critical in a shock wave (a “hydraulic jump”), while the gravity waves farther downstream, which can propagate against the wind, accumulate and break at this point.
Most studies about CLLJ published in the literature are based on field campaigns during the summer (Beardsley et al., Citation1987; Zemba and Friehe, Citation1987; Winant et al., Citation1988, Sundararajan and Tjernström, Citation1999), and on modelling and theoretical efforts (Cui et al., Citation1998; Rogerson, Citation1999). These studies have focused mainly on the California and Chile–Peru coastal jets, with some exceptions on the Somali–Oman jet (Findlater, Citation1969; Ardanui, Citation1979) and more recently on the Benguela jet (Nicholson, Citation2010). Recently, Ranjha et al. (Citation2013) built a global climatology of CLLJ based on the European Centre for Medium-Range Weather Forecasts (ECMWF) ERA-Interim reanalysis (Dee et al., Citation2011). By using a filtering algorithm grounded on the analysis of the wind speed and temperature profiles, they have described the basic climatology features of the CLLJ in the areas mentioned above. A very good agreement with the potential areas of occurrence mentioned by Winant et al. (Citation1988) was found. They have shown that the northern hemisphere CLLJ have a stronger seasonality, compared to the southern hemisphere ones. The authors also suggested that the CLLJ along the Portugal–Canary eastern boundary current has two branches, separated by the Gulf of Cadiz: the Iberian Peninsula branch, and the West North Africa Branch. In spite of the coarse resolution of the reanalysis data used by CitationRanjha et al. (2013; 1°x1°), it was shown that ERA-Interim describes realistic jets at locations where one would expect, and allowed for a coherent global climatology of CLLJ. Nevertheless, dedicated regional higher resolution studies are needed, in order to better depict the details of the CLLJ in the different areas of occurrence. This study presents a regional climatology of the CLLJ off the coasts of the Iberian Peninsula, based on a 9 km resolution dynamically downscaled dataset (Soares et al., Citation2012; Cardoso et al., Citation2013), produced using the Weather Research and Forecasting (WRF) mesoscale model (Skamarock et al., Citation2008), forced by 19 years of ERA-Interim reanalysis (1989–2007). The climatological features of the Iberian CLLJ are shown in greater detail, compared with the global results of Ranjha et al. (Citation2013).
During late spring to early autumn, the Iberian Peninsula is frequently under the effect of the Azores High and of a thermal low pressure system inland in the heart of the Iberian Peninsula (Hoinka and Castro, Citation2003), giving rise to a seasonal wind called the Nortada (northerly wind; Lopes et al., Citation2009), which is a CLLJ. This wind regime gives rise to summertime upwelling currents, off the west coast of the Iberian Peninsula (Alvarez et al., Citation2008). In spite of several studies on the upwelling regime off the west coast of the Iberian Peninsula (see e.g. Fiuza et al., Citation1982; Peliz et al., Citation2002; Capet et al., Citation2004; Bode et al., Citation2009), there has been no detailed study concerning the wind regime that gives rise to this ocean response.
The present study is organised as follows: in section 2 the downscaling data is described, as well as the analysis methodology, the assessment of the quality of the downscaled surface wind speeds (10 m height) against remote sensing wind speed observations is presented in section 3, while section 4 describes the climatology of the Iberian Peninsula CLLJ and section 5 summarises the results and presents some conclusions.
2. Methodology and data
The methodology followed in this study can be divided into three parts. Firstly, an assessment of the quality of the model's surface marine winds from the regional climate simulation (see below) was carried out by comparing them with remote sensing surface observations over the ocean. Secondly, according to a set of criteria (see below), the 3-dimensional wind and temperature fields were scanned in order to identify the occurrences and locations of CLLJ, based on the vertical profiles of wind speed and temperature. Finally, different statistics were computed to characterize the Iberian Peninsula CLLJ climatology, namely frequencies of occurrence, mean intensities, jet heights, seasonal variability and spatial extension.
The present study follows the CLLJ detection method proposed by Ranjha et al. (Citation2013), who suggested a set of filtering criteria based on the analysis of the vertical wind speed and temperature profiles. According to them a CLLJ occurs when the following criteria are met:
The height of the jet maximum is within the lowest 1 km in the vertical;
The wind speed at the jet maximum is at least 20% higher than the wind speed at the surface;
The wind speed above the jet maximum decreases to below 80% of the wind speed at the surface (i.e. a 20% falloff) before reaching 5 km above its maximum;
The temperature at the jet maximum is lower than the temperature at two model levels above it (inversion detection); and
The maximum temperature does not occur at the base (rejection of surface based inversion).
2.1. Observational datasets
The surface wind speed observations used to validate the model's surface wind fields rely on the Cross-Calibrated Multi-Platform (CCMP) Ocean Surface Wind Vector Analyses (Atlas et al., Citation2011) developed and made available by NASA (National Aeronautics and Space Administration), and derived from a number of microwave satellite instruments. This dataset covers the period from July 1987 to June 2011 without gaps, combining cross-calibrated satellite winds using a variational analysis method. The result is a high-resolution (0.25°) daily gridded dataset of surface wind speeds, at a reference height of 10 m. Both radiometer and scatterometer data were validated against ocean moored buoys, which prove that the wind speed measurements are in very good agreement with in-situ observations (within 0.8 m/s), despite the different instrument measurement dynamics wind retrieval methodologies.
2.2. Regional climate simulation design
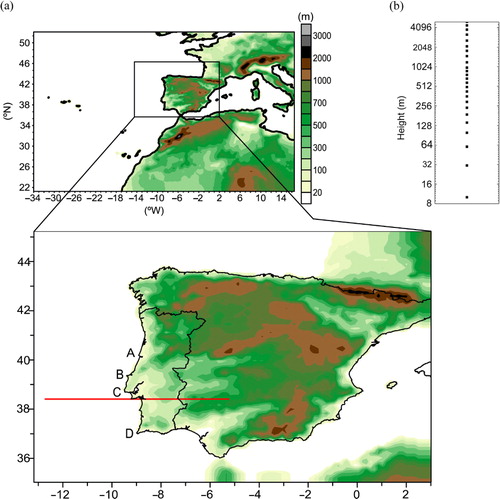
The present study uses results from a climate simulation performed with the WRF model in its version 3.1.1. The WRF model (Skamarock et al., Citation2008) is a non-hydrostatic model, suitable for simulating a wide range of scales, with a large number of available options in what concerns the model core and most physical parameterizations, making it appropriate for numerical weather prediction, mesoscale meteorological studies. More recently WRF has been extensively used for dynamical downscaling in regional climate studies. WRF was setup with two grids, a parent one at 27 km (WRF27 km) and a second nested at 9 km (WRF9 km) horizontal grid spacing, using one-way nesting. Both grids are centred in the Iberian Peninsula and have, respectively, 162×135 and 144×111 grid points, covering the regions shown in . In both domains 49 vertical levels are used, placing roughly 20 vertical levels in the boundary layer, with the lowest model sigma level at approximately 10 m of height and model top at 50 hPa. The outermost domain was designed to cover a relatively large ocean area, reducing spurious boundary effects in the inner region.
Fig. 1 (a) WRF model outermost (full, dx=27 km), and inner (solid black line, dx=9 km) domains. (b) Vertical model levels up to 5 km (log2 vertical scale). Solid red line marks the area of the two representative cross-sections. A – Cabo Mondego, B – Cabo Carvoeiro, C – Cabo Raso and D – Cabo São Vicente.
The WRF model run was set to start at 0000 UTC 1 January 1989 and end at 2300 UTC 31 December 2007. Initial and lateral conditions for the outer domain were derived from the ERA-Interim pressure-level reanalysis. The lateral boundary conditions and SST were both updated every 6 h, from ERA-Interim. In both domains, 11 grid points are used as lateral relaxation areas. A complete and more detailed description of the model set-up can be found in Soares et al. (Citation2012) and Cardoso et al. (Citation2013), where the simulation results were validated for inland maximum and minimum temperatures and precipitation, showing a good agreement with observations.
3. Evaluation of the model surface wind speeds
Although the resolution of the observational grid is coarser than the simulation grid, the 19-yr model results were linked to the observations via the nearest grid point. The observational dataset has, near the shore, a significant number of missing values, thus grid points with <95% of data were dismissed. Also, it is well known that near the shore scatterometer pixels are influenced by backscatter from land, which contaminates the wind speed measurements. Thus, the near shore pixels are very noisy and these errors should be viewed with caution and not assumed to be absolute (Tang et al., Citation2004).
For each grid box, the following standard error statistics are computed: bias, normalized bias, mean absolute error (MAE), mean absolute percentage error (MAPE), root mean square error (RMSE), correlation coefficient and standard deviation (see Cardoso et al., Citation2013 for further details). In , the spatial distribution of three such statistics is shown. Overall, the wind speed is well reproduced by the model with the lowest errors found offshore. The reduced agreement between the simulation and the observations near the shoreline has to be interpreted with caution due to the difficulty of the remote sensing instruments in obtaining accurate measurements near the coast.
Fig. 2 Spatial daily error statistics: (a) bias, (b) MAPE and (c) correlation, for surface wind speed. WRF 10 m wind is compared with SEAwind data.
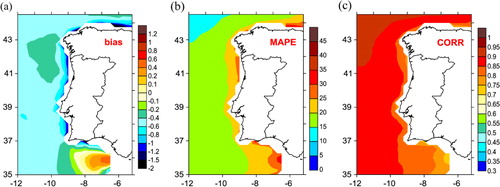
Compared to the observations, the model underestimates the surface wind speed close to the western and northern coast of the Iberia Peninsula by [0.6, 0.2] m/s (a), which is about 6% of the observed wind speeds in that area (not shown). In the vicinity of the Strait of Gibraltar, strong funnelling winds are simulated by the model, with no parallel in the observed data. Here, a maximum overestimation of 0.6 m/s (10%) is recorded. The MAPE is between 15 and 20% on the west coast with a maximum of 30–35% near the strait. High correlation (>0.8) is registered in the entire domain (c), with the exception of the strait where it drops to 0.7.
To synthesise the validation statistics, global error measures were computed for wind speed as well as for the individual wind components. Time and space were merged into one single matrix. The results described above are summarised in . Both wind speed components have similar absolute errors, but since the zonal component is less intense than the meridional one, the relative errors are larger. The high RMSE for both components and wind speed highlights the occurrence of large deviations from the observations. Both components are highly correlated to the observations. The agreement between the remote sensing and the modelled surface wind speeds shows that the WRF simulation produces realistic regional results, giving us confidence in the ability of the model in realistically reproducing the Iberian Peninsula marine winds.
Table 1. Global error statistics of surface wind. WRF model results against Sea Winds dataset
4. Coastal low-level jet climatology
4.1. Case-study of a strong CLLJ feature
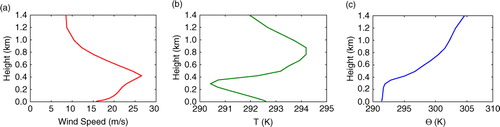
The detection algorithm was applied to the wind speed and temperature profiles at one grid point off the west coast of the Iberian Peninsula, in the vicinity of Cabo Raso (at 9.60 W; 38.36 N). A CLLJ event was detected on 19 August 2007, and we choose the output time at 21:00 as an example case-study. The typical coastal jets vertical profiles of wind speed and temperature, along with the vertical profile of potential temperature, at the corresponding grid point, are shown in . At this position, the wind speed increases with height from the surface up to around 400 m, reaching a magnitude of >25 m/s, and then decreasing above the maximum (a). The vertical temperature profile in b shows a decrease in the air temperature from the surface until about the height of the jet maximum, followed by a well-defined inversion layer, determining the height of the MABL. The potential temperature vertical profile (c) shows a well-mixed MABL from the surface to the height of the inversion, also characteristic on CLLJ (Beardsley et al., Citation1987).
Fig. 3 Vertical profiles of (a) wind speed, (b) temperature and (c) potential temperature for a case-study of CLLJ offshore the west coast of the Iberian Peninsula, at 38.36N; −9.60W for 19 August 2007 (21LT).
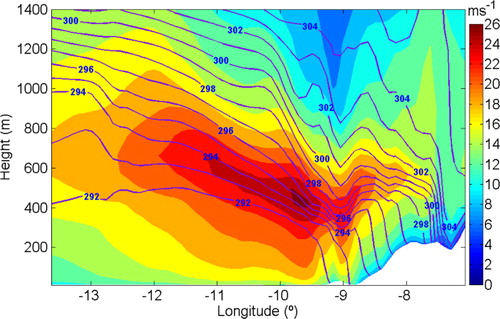
An east–west cross section of the CLLJ case-study with isotacs and isentropes, crossing the above-mentioned grid point (see b), is shown in . The coastal MABL thermodynamics structure, that gives rise to the CLLJ, is clear in this cross section. A well-defined jet-core, with wind speeds >25 m/s, can be identified over the ocean but close to the coast (~30–40 km offshore), at 400–450 m height. There is also a secondary wind speed maximum above the coast line near 9°W, developing inshore. This feature, considering the time of the year and the hour it took place (summer early evening), seems to represent enhanced winds associated with an advancing sea breeze front as in Burk and Thompson (Citation1996). The main jet core is located within the inversion, in agreement with other modelling and observational studies (Winant et al., Citation1988; Burk and Thompson, 1995; Tjernström, Citation1999; Pomeroy and Parish, Citation2000; Rahn and Parish, Citation2007), and is clearly at an altitude above the coastal mountains (~8°W). The MABL is shallow at the coast and deepens to the west as manifested by the sloping isentropes, where the vertical gradient of potential temperature is higher, constraining the wind speed maximum at the coast and then offshore. The CLLJ in this case-study extends offshore to more than 13°W, to a distance around 300 km from the coast.
Fig. 4 Vertical cross section (illustrated in ) of wind speed (m/s) and potential temperature (blue lines, K), for the CLLJ of 19 August 2007 (21LT).
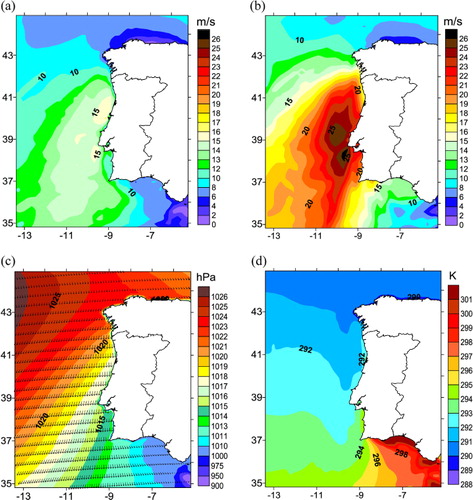
shows the horizontal slabs of several parameters for the referred case-study: wind speed at 10 m height and at the jet maximum height, sea surface pressure and wind vectors at the surface (10 m), and temperature at 2 m height. The surface wind speed pattern (a) shows a large area of high wind speeds (14 m/s and higher) along the western coast of Portugal, and southwest of Cabo de S. Vicente, with two areas of even higher wind speeds (~15 m/s) west of Cabo Mondego and South of Cabo Raso. The wind speed at the jet maximum level shown in b has a similar pattern but with considerably higher wind speeds (in excess of 20 m/s) along the coast, with two areas of very high wind speeds (higher than ~26 m/s) west–southwest of Cabo Carvoeiro and southwest of Cabo Raso. These areas of high and very high wind speeds are the result of the flow interaction with these headlands resulting in super-critical flow acceleration. The expansion fan effect is more noticeable south of Cabo Raso, since south of Cabo Carvoeiro the coast rapidly turns into the flow. Although the effect of this interaction on the wind speed is rather striking, the effect of the interaction of the flow with Cabo Raso in the wind direction is minimal (c), even with the coast turning significantly away from the flow, into the mouth of the Tagus River. In spite of the need for further investigation on this matter, most probably with a higher model resolution, which falls out of the scope of the present study, a hypothetical explanation can be advanced. The mountain feature at the coast in the vicinity of Cabo da Roca and Cabo Raso (the Serra de Sintra) is aligned approximately normal to the coast line and is not very high (~300–400 m), lying below the jet core. The flow overruns this mountain feature, and the longitudinal wind component is most probably responsible for the disruption of the expansion fan effect on the wind direction due to the flow interaction with Cabo Raso. This effect in the wind direction is nevertheless, in the present case-study, noticeable south of Cabo de S. Vicente. The same kind of flow over-running over low terrain during CLLJ events, near Cape Mendocino in California, was also described by Söderberg and Tjernström (Citation2001).
Fig. 5 Horizontal slabs of (a) wind speed at the surface (10 m), (b) wind speed at the jet level, (c) surface pressure (hPa) and surface wind vectors, and (d) surface temperature (K) at 2 m, for the CLLJ of 19 August 2007 (21LT).
The analysis of this case-study showed that the algorithm developed by Ranjha et al. (Citation2013), applied to the downscaled data set seems to be appropriate to filter CLLJ occurrences off the coasts of the Iberian Peninsula. It also showed that the model simulation resolves and captures coastal wind features, like CLLJ.
4.2. Seasonal climatology
The hourly gridded values of wind speed and temperature were organized in seasons as December–February (DJF), March–May (MAM), June–August (JJA), and September–November (SON), for boreal winter, spring, summer, and autumn, respectively. The downscaled data was subject to the detection algorithm, allowing the identification of CLLJ events at each grid point and at each output time. shows maps of seasonal CLLJ occurrences (in percentage), that is, the number of hours CLLJ was identified out of the total seasonal simulation hours for each grid point, where inter-seasonal prevalence of CLLJ in the area can be assessed. Positive identifications of CLLJ events off the Strait of Gibraltar are noticeable in all seasons. This is a gap wind feature (the Levante; Dorman et al., Citation2009) that will not be studied here and will not be considered in the statistical analysis below; the area where it occurs is masked and its occurrence is filtered out. Coastal jets occur along the Iberian Peninsula during the four seasons, although with different prevalence. The occurrence of CLLJ during DJF (a) is discarded, since this low-level jet (LLJ) feature along the west coast of Portugal is associated, with very few exceptions and much localized, with easterly winds from land, and has different dynamics (cold land and warm ocean), falling more into the katabatic flow category. It seems that these winds are strong enough that through boundary-layer mixing generate a near-neutral PBL, thick enough that they pass the surface inversion criterion in the algorithm (see a discussion on such flows in Ranjha et al., Citation2013). Despite of being interesting, we will not consider these wind features further in this study, and DJF will be considered as a season without CLLJ occurrences in the Iberian Peninsula coasts.
Fig. 6 Maps of seasonal hourly CLLJ frequency of occurrence (%), (a) DJF, (b) MAM, (c) JJA and (d) SON.
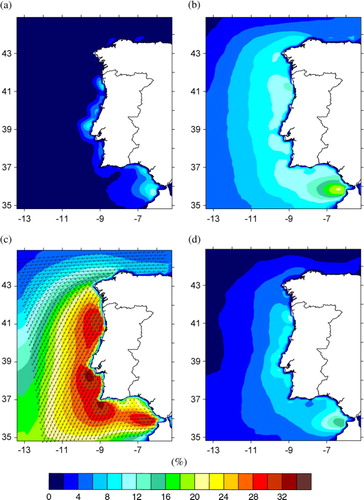
During the MAM, JJA, and SON seasons the CLLJ events lie mostly off the western coast of the Iberian Peninsula, with some consistent events along the north coast, in the Bay of Biscay, particularly in the north coast of Galicia, in Spain. In MAM (b), the occurrences of CLLJ are still relatively low: a band of around 10–12% of CLLJ occurrences can be seen along the west coast of Portugal, with a considerable offshore extension to the west. Some CLLJ occurrences (4–5%) can also be found in the north shores of the Iberian Peninsula during spring. The frequency of occurrence of CLLJ increases drastically in JJA (c), and decreases again in SON (d), with a lower spatial extend to the west, compared to MAM, and a slightly lower prevalence (8–10%). In the autumn, the occurrence of CLLJ in the north coast of Iberia can also be seen, although limited to 4% or less.
The JJA season, when CLLJ events are considerably more frequent and cover a larger area, in agreement with the findings of Ranjha et al. (Citation2013), is analysed in greater detail. During the summer season, CLLJ are generally present along the west coast of Portugal 30% or more of the time: at least one in 3 d (10 d per month) reveals a CLLJ event. This value is lower along the west and north coasts of Galicia. Besides being considerably more frequent than in any other season, the summer CLLJ along the Iberian Peninsula has a much larger horizontal extent spanning further west of the domain. Closer to the coast three areas of higher frequency of occurrence of CLLJ (>34–35%) can be identified: along the north sector of the western coast of Portugal, south of Cabo Raso, and South of Cabo de S. Vicente. The frequencies of occurrence shown here for JJA are slightly higher than the ones shown by Ranjha et al. (Citation2013). They found values of the order of 27–28%, mostly concentrated in the southern part of the west coast of Portugal. These differences may be connected to the higher resolution allowing an improved representation of smaller scale features in this area, like the thermal circulations and the interaction of the flow with local orographic properties and the slope of the MABL inversion. The mean wind direction at the jet maximum, when CLLJ occur, can also be seen in c. A well-defined and consistent northerly wind is the main feature along the west coast of the Iberian Peninsula. Nevertheless, the occurrence of CLLJ in the North coast of the Peninsula drives an easterly wind there, contouring the Peninsula along the coast of Galicia towards the western coast.
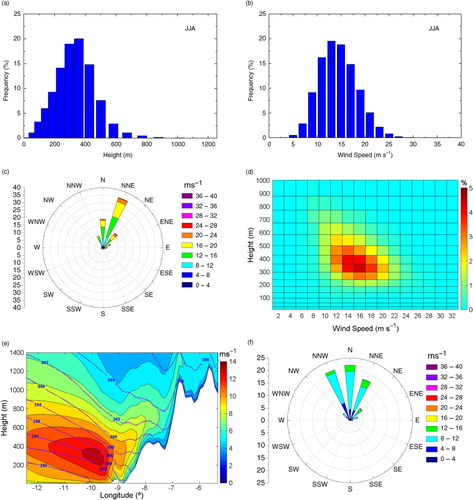
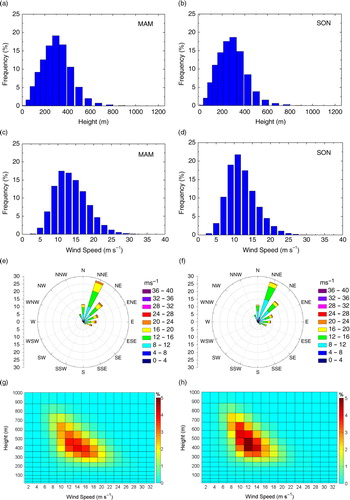
The statistics for the JJA Iberian Peninsula CLLJ are shown in , and comprise height, wind speed, and wind rose histograms, and an east–west cross section for the mean wind speed, when CLLJ occurs (see b). The height of the Iberian CLLJ lies (a) within the first 500 m above sea level for >95% of the occurrences. The jet can be considered relatively shallow, since most of the occurrences (close to 75%) have a jet maximum height below 350 m. The wind speed occurrences, at the jet core, are mostly (>80%) within the 10–20 m/s interval, with some very high wind speed occurrences, with 20-m/s values being found above 10% of the time. The 2D histogram in d shows that the strongest and more prevailing jets have a wind speed maximum between 300 and 400 m and a wind speed in the interval of 12–18 m/s. The wind direction at the jet maximum (c, direction rose plot) clearly shows the predominance of the northerly winds when CLLJ occur: north–northeast and north (>35 and 20%, respectively) with few occurrences from the northeast (<15%). The (few) easterly CLLJ occurrences are related to the jets in the north coast of the Iberian Peninsula. The directional CLLJ distribution pattern of the surface wind when jet occurs (f) is slightly different, with the flow blowing from north–northeast (around 17%), to north and north–northwest (>20%), also with some easterly winds occurrences. In e, the cross-section where CLLJ has a maximum summer prevalence (>34%; line in red in a) shows the mean wind speed and mean isentropes when CLLJ occurs. It shows a mean wind speed at the jet core of the order of 14 m/s, at heights below 400 m. This mean jet core is located at an offshore distance of the order 80–90 km. A mean sea breeze front, with a considerable inland penetration, reaching Spain across Portugal, until the Sierra de Aracena mountains, shows that, in this area, the predominant northerly winds are not sufficiently strong enough to prevent a zonal component of the flow due to the diurnal sea breeze that penetrates inland. This inland intrusion of the sea breeze is possible due to the low topography height. The wind speed features of the mean jet shown in the cross section in e are similar to the ones shown above in ; although in the case-study (an extreme event) the wind speed at the jet core is clearly higher. The link between these two figures shows the ability of the WRF model to properly forecast CLLJ where they are climatologically more prevalent in the west coast of the Iberian Peninsula.
Fig. 7 CLLJ statistics for Summer (JJA): (a) jet height histogram (%), (b) jet wind speed histogram (%), (c) jet wind rose, (d) jet height-wind histogram (%), (e) east-west cross section (illustrated in ) at 38.35°N, colours for mean wind speed (m/s) and isentropes (K), and (f) surface wind speed when jet occurs.
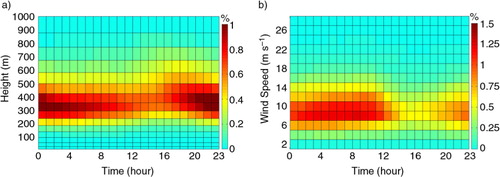
The diurnal cycles of the frequency of occurrence by jet height and intensity (in wind speed) are shown in the 2D histograms of . Regardless of the time of the day, the jets are mostly constrained to a height interval between 300 and 400 m (a), with some (less) occurrences of jet wind maxima around 500–700 m during the early evening period. The time of the day when coastal jets are most prevalent is often at early evening extending to dawn (from 18:00 to 05:00 UTC). This is also the period when CLLJ tend to be more intense, revealing wind speeds of the order of 14–18 m/s (b). The more frequent and more intense coastal jets around Iberia are bounded by a MABL height that should be around 300–400 m, have wind speed maxima between 14 and 18 m/s, and occur from early evening to early dawn. The highest frequencies of occurrence at this time of the day are not in full agreement with the conceptual model for the CLLJ diurnal cycle proposed by Beardsley et al. (Citation1987; their Fig. 17), where wind speeds should, in principle, decrease during the night. The CLLJ prevalence during the night shown in seem to suggest some delay between the highest thermal gradient between land and ocean at the surface, which occurs in the afternoon, and the period of highest frequency of occurrence. Considering that CLLJ wind speed maxima are lodged at or right below the temperature inversion that caps the MABL, the height of the wind speed maxima is a good proxy for the height of the MABL. Therefore, during the Boreal summer the height of the marine boundary layer, along the coasts of the Iberian Peninsula, is mostly constrained to an interval of the order of 300–400 m (70% of the times lower than 350 m as seen in a), and that height has a small diurnal cycle (a).
Fig. 8 (a) Diurnal cycle of hourly jet frequency of occurrence (%) function of height, and (b) function of mean wind speed (m/s), both when jet occurs.
The statistics for the CLLJ during the intermediate seasons MAM and SON are shown in comprising: height, wind speed, and wind rose histograms. Compared to JJA, the jet maximum is slightly shallower in MAM, being below 350 m around 80% of the time (a). A very similar jet height distribution applies for SON, as seen in b. The distribution of the wind speed at the jet maximum shows a slightly stronger jet, with higher wind speeds, in SON than in MAM (c, d), and also than in JJA. The frequencies of occurrence of the wind direction at the jet maximum, in both seasons (e, f), shows a prevalence of north–northeasterly and northeasterly winds (close to 30% and around 17%, respectively, in both seasons). The occurrence of northerly winds is also similar in both seasons. As can be seen in the 2D histogram for MAM (e), the more prevailing jets in this season have a jet height at 400 m, and a wind speed maximum of 14 m/s. The distributional pattern for SON (f) is similar, although with the occurrence high wind speed jets at higher (close to 500 m) also.
Fig. 9 CLLJ statistics for the intermediate seasons: (a, b) jet height histogram (%), (c, d) jet wind speed histogram (%), (e, f) jet wind rose (%) and (g, h) jet height wind histogram (%). Seasons are: SON – September, October and November; and MAM – March, April and May.
4.3. Inter-annual variability
With the goal of studying the inter-annual variability of the Iberian Peninsula coastal jet, the monthly mean of the frequency of occurrence of CLLJ and the corresponding standard deviation, at each grid point for the 19 yr, were computed. The maps of the monthly mean frequency of occurrence and its standard deviation, from March to November, are shown in and , respectively. It is clear and evident that the monthly mean percentage of occurrences of CLLJ, and the correspondent spatial extend, are in general lowest in March, increase until July, and decrease from then on until November. This pattern of increasing of the mean frequency of occurrence and of the area of occurrence of CLLJ is consistent in March, April and May, as is the increase of the west spatial extension of CLLJ occurrences. The occurrence of CLLJ in the north coast of the Iberian Peninsula starts in March, and its mean percentage of occurrences increases during April and May. June, July and August, the summer months as defined above, are when the mean occurrence of CLLJ in the Iberian Peninsula coasts is highest.
Fig. 10 Maps of monthly mean frequency of CLLJ occurrence (%) for (a) March, (b) April, (c) May, (d) June, (e) July, (f) August, (g) September, (h) October and (i) November.
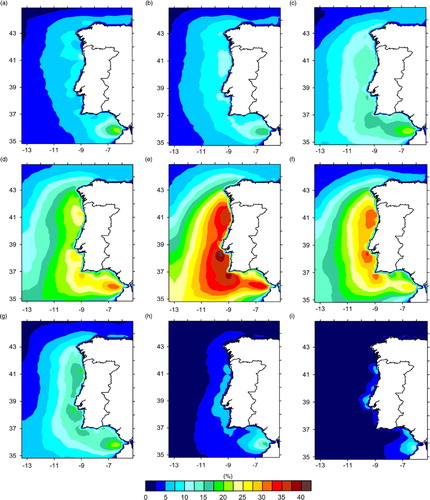
Fig. 11 Maps of frequency standard deviation of CLLJ occurrence (%) for (a) March, (b) April, (c) May, (d) June, (e) July, (f) August, (g) September, (h) October and (i) November.
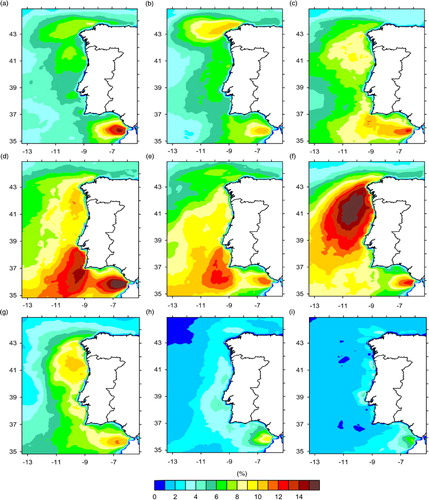
The three areas of highest frequency of occurrence of CLLJ in the west coast of Portugal, along the north coast, south of Cabo Raso, and South of Cabo de S. Vicente (see c), start to build in June, reaching its maximum in July, and decreasing in August. In June, CLLJ occur around 22–23% along the west coast of Iberia, with mean values of occurrence higher in Portugal (close to 30%). In July, these values reach 35% or more, and can be >40% southwest of Cabo da Roca, where CLLJ can occur. In August the pattern is similar to June, although with slightly higher mean values of occurrence. In September the mean values of occurrence decrease, compared to the previous summer months, and this decreasing tendency lasts until November.
The maps of the monthly standard deviation of the frequency of occurrence are show in . These standard deviations have to be seen in relative terms, since they refer to the monthly means of frequency of occurrence shown in . Generally, the intermediate months in the intermediate seasons show relative large standard deviations when compared to the mean values, revealing a higher inter-annual variability in these two seasons.
The standard deviation is high in March (a), with the departures from the mean (~7%) mostly taking place the north and west coasts of Galicia, and in the north coast of Portugal, when taking in account the mean frequency of occurrence (~10%). A similar pattern occurs in April and May (b, c), although with increasing dispersion values (>10% in May). Summer also presents an important inter-annual variability. In June (d), the area of highest departure from the mean (13–14%) is now along the south part of the west coast of Portugal, extending to an area southwest of Cabo de S. Vicente. The dispersion pattern in July (e) is similar, but shows lower relative standard deviation values, indicating that during this month although the CLLJ are more frequent, as seen by the mean values of occurrence in the previous figure, relatively low variations from 1 yr to the other are observed. The pattern of the dispersion of the frequency of occurrence in August (f) is substantially different from any other month, with very high standard deviation values concentrated in the central to north area of the west coast of the Iberian Peninsula, starting in Cabo Finsterra and extending to Cabo da Roca, with values higher than 16% in the north part of this area. This high standard deviation values point to substantial differences in the occurrence of CLLJ in August from 1 yr to the other. In September (g), the dispersion is still relatively high in this area, but lower than in the previous month, and decreases even more until November (h).
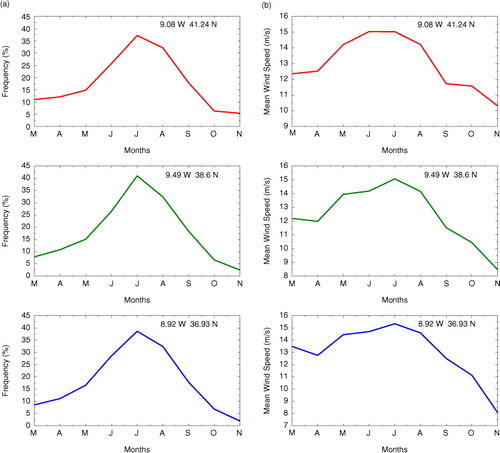
To assess the combined monthly evolution of the frequency of occurrence and mean wind speed, we chose three positions offshore in the areas of highest frequencies of occurrence of CLLJ in July (see c). The time series of the monthly mean frequencies of occurrence and wind speed, from March to November, can be seen in . The increase in the mean frequency of occurrence of CLLJ in the three positions (a), from March to July, reaching a maximum of the order of 35–40%, and a decrease from then on until November, is clear for the three locations. This increase is similar for the three sites, although the mean monthly peak of occurrence is highest (>40%) in the position 9.49 W–38.6 N, in the vicinity of Cabo Raso, in line with c. This increase in percentage of occurrences of CLLJ has a correspondent increase in the mean wind speed at the jet maximum at the same positions (b), with mean wind speed maxima in July slightly >15 m/s.
Fig. 12 (a) Mean monthly frequency of occurrence (%) and (b) mean monthly wind speed (m/s), from March to November, both for three different geographical locations, for the 19 yr.
5. Summary and conclusions
A climatology of CLLJ off the coasts of the Iberian Peninsula, based on a high-resolution regional atmospheric dataset produced using the WRF mesoscale model, forced by 19 yr of ERA-Interim reanalysis, has been presented. The CLLJ occurrences were obtained by scanning the downscaled data with an identification algorithm, described in section 2, following the one proposed by Ranjha et al. (Citation2013). A comparison of the results of the simulated surface wind speeds against SEAwind remote sensing observations provided the necessary confidence in WRF model's ability to realistically reproduce the Iberian Peninsula marine winds. The case-study analysis of a strong CLLJ event along the west coast of Portugal showed that the algorithm developed by Ranjha et al. (Citation2013), here adapted to a higher resolution dataset, correctly filters CLLJ occurrences off the coast of the Iberian Peninsula, and that WRF model simulation resolves and captures coastal wind features, like CLLJ.
The seasonal occurrences of CLLJ (for MAM, JJA and SON) showed that, although coastal jets are mainly a summer event in the Iberian Peninsula, with a predominance along its west coast higher than 30%, these coastal wind features also occur in the intermediate seasons, with seasonal frequencies of occurrence that can reach 10%. It has been shown that CLLJ can also occur along the north coast of Spain, where some recent studies have proved that upwelling is a relatively common event, with particularly higher occurrence in the summer months (Alvarez et al., Citation2009, Citation2010; Alves and Miranda, Citation2013). Nevertheless, and in spite of the evidence of the existence of upwelling currents and offshore Ekman transport in the Iberian coast, to the authors’ knowledge no detailed study of the wind regime in that coastal area has been pursuit. The statistics of the Iberian summer CLLJ () revealed that the most frequent height of the jet, here defined as the height of the wind speed maxima, lies between 300 and 400 m, and that the most prevalent wind speed at the jet core has a relatively broad distribution: about 80% of the wind speeds at the jet maxima are within the interval of 10–20 m/s, although higher wind speeds (>20 m/s) can occur. The predominant north to north-easterly wind direction along the west coast during JJA does not prevent a zonal component of the flow, well noticed by a mean sea breeze front. This sea breeze front that reaches as far as Spain, happens most probably due to the low coastal topography height that allows inland flow intrusion, which does not necessarily occur in other parts of the globe where CLLJ also take place, namely along the Californian coast.
The diurnal cycle of the summer CLLJ () shows that the time of the day when coastal jets are more often present are at early evening extending to dawn (from 18:00 to 05:00 UTC). This latter higher frequency of occurrence of CLLJ, with a peak during the night (20:00–03:00 UTC) is not in line with the diurnal cycle investigations of the California CLLJ (Beardsley et al., Citation1987; Tjernström and Grisogono, Citation2000; Dorman and Koracin, Citation2008), which point to a maximum wind speed during afternoon. The diurnal cycle, and the maximum wind speed of the CLLJ, is related to the diurnal variations of the land–sea temperature contrast. Some lagging between the time of the maximum thermal difference and the maximum wind speed or maximum jet occurrence is expected due to the dynamical adjustment of the MABL and to the semi-geostrophic response of the wind. The characteristics of the diurnal cycle of Iberian CLLJ and its connection with the thermal low dynamics should be addressed in future research.
Seasonally, three well-defined areas of higher CLLJ occurrences (>33–35%) were identified. These areas show higher monthly mean frequencies of occurrence in July (>38–40%) and in August (>30–32%). These higher frequencies of occurrence in the three mentioned areas occur most probably due to flow interaction with coastal topography and irregularities. A dedicated and more detailed study of the CLLJ in these areas is needed, with a higher resolution model simulation, particularly in the central west coast of Portugal. In this area, offshore Cabo da Roca and Cabo Raso (see a) the area of highest wind speeds, the jet seems to occur sometimes separately from the one upwind, most probably due to the coastal bending into the flow, and to the generation of an hydraulic jump, which makes it as a critical area worth studying in greater detail.
The synoptic forcing behind the occurrence of CLLJ along the coast of the Iberian Peninsula is clearly identified, and is associated with the presence of the Azores High around 40°N and a thermal low inland in the heart of the Iberian Peninsula. The shape of the Iberian Peninsula, with a well-defined north–south west coast, and an equally well-defined west–east north coast, indicate that the synoptic pattern, mainly the position of the Azores high, is linked to the occurrence of CLLJ in these coasts.
When comparing the results of the present study with the findings of Ranjha et al. (Citation2013), for the same period, a clear gain in detail and description of the Iberian jet, due to the higher resolution of the WRF model simulation, can be seen. Nevertheless, the frequency of occurrence of the JJA CLLJ and the detailed statistics, mainly the jet height and wind speed frequency distributions, are in agreement with their findings. The occurrence of a CLLJ in the north coast of Spain, nevertheless, was not captured by ERA-Interim in Ranjha et al. (Citation2013). The northwest coast of Galicia area should also be looked at in further research since the frequency of occurrence of CLLJ is not very high, but presents a high inter-annual variability, particularly in August, pointing out to non-periodic episodes of intense CLLJ. This area in Galicia is known to have frequent episodes of upwelling (Alvarez et al., Citation2008), which is also an indication of the presence of CLLJ.
6. Acknowledgements
The authors thank the two anonymous reviewers of this manuscript for their comments and suggestions, and Michael Tjernström, MISU Sweden, for helpful scientific discussions. They also thank NOAA for providing the SeaWind data. This work was done in the framework of the PEST-OE/CTE/LA0019/2013-2014 program, financed by FCT. Raza Ranjha gratefully acknowledges support from the Higher Education Commission of Pakistan.
Related Research Data
References
- Alvarez I , Gomez-Gesteira M , deCastro M , Dias J. M . Spatio-temporal evolution of upwelling regime along the western coast of the Iberian Peninsula. J. Geophys. Res. 113 10.1029/2008JC004744 C07020.
- Alvarez I , Gomez-Gesteira M , de Castro M , Gomez-Gesteira J. L , Dias J. M . Summer upwelling frequency along the western Cantabrian coast from 1967 to 2008. J. Mar. Syst. 2010; 79: 218–226.
- Alvarez I , Ospina-Alvarez N , Pazos Y , deCastro M , Bernardez P , co-authors . A winter upwelling event in the Northern Galician Rias: frequency and oceanographic implications. Estuar. Coast. Shelf Sci. 2009; 82: 573–582. 10.1016/j.ecss.2009.02.02.
- Alves J. M. R, Miranda P. M. A. Variability of Iberian upwelling implied by ERA-40 and ERA-Interim reanalyses. Tellus A. 2013; 65: 19245. DOI: http://dx.doi.org/10.3402/tellusa.v65i0.19245.
- Ardanui P . On the observed diurnal oscillation of the Somali jet. Mon. Weather. Rev. 1979; 107: 1694–1700.
- Atlas R , Hoffman R. N , Ardizzone J , Leidner S. M , Jusem J. C , co-authors . A cross-calibrated, multiplatform ocean surface wind velocity product for meteorological and oceanographic applications. Bull. Am. Meteorol. Soc. 2011; 92: 157–174.
- Beardsley R. C , Rosenfeld L. K , Dorman C. E , Friehe C. A , Winant C. D . Local atmospheric forcing during the coastal ocean dynamics experiment 1. A description of the marine boundary layer and atmospheric conditions over a northern California upwelling region. J. Geophys. Res. 1987; 92: 1467–1488. 10.1029/0JGREA0000920000C2001467000001.
- Bode A , Alvarez-Ossorio M. T , Cabanas J. M , Miranda A. M , Varela A . Recent trends in plankton and upwelling intensity off Galicia (NW Spain). Progr. Oceanogr. 2009; 83: 342–350.
- Bridger A. F. C , Brick W. C , Lester P. F . The structure of the marine inversion layer off the central California coast: mesoscale conditions. Mon. Weather. Rev. 1992; 121: 335–351.
- Burk S. D , Thompson W. T . The summertime low-level jet and marine boundary layer 667 structure along the California coast. Mon. Weather. Rev. 1996; 124: 668–686.
- Capet X. J , Marchesiello P , McWilliams J. C . Upwelling response to coastal wind profiles. Geophys. Res. Lett. 2004; 31 10.1029/2004GL020123 L13311.
- Cardoso R. M , Soares P. M. M , Miranda P. M. A , Belo-Pereira M . WRF high resolution simulation of Iberian mean and extreme precipitation climate. Int J. Climatol. 33: 2591–2608. 10.1002/joc.3616.
- Chao S . Coastal jets in the lower atmosphere. J. Phys. Oceanogr. 1985; 15: 361–371.
- Cui Z , Tjernström M , Grisogono B . Idealized simulations of atmospheric coastal flow along the central coast of California. J. Appl. Meteorol. 1998; 37: 1332–1336.
- Dee D. P , Uppala S. M , Simmons A. J , Berrisford P , Poli P , co-authors . The ERA-Interim reanalysis: configuration and performance of the data assimilation system. Q. J. Roy. Meteorol. Soc. 2011; 137: 553–597.
- Dorman C. E , Beardsley R. C , Limeburner R . Winds in the Strait of Gibraltar. Q. J. Roy. Meteorol. Soc. 2009; 121: 1903–1921. 1995.
- Dorman C. E , Holt T , Edwards K. A . Large-scale structure of the summertime marine boundary layer along Oregon and California. Mon. Weather. Rev. 2000; 128: 1632–1652.
- Dorman C. E , Koracin D . Response of the summer marine layer flow to an extreme California coastal bend. Mon. Weather. Rev. 2008; 136: 2894–2922.
- Dorman C. E , Rogers D. P , Nuss W , Thompson W. T . Adjustment of the summer marine boundary layer around Point Sur, California. Mon. Weather. Rev. 1999; 101: 2143–2159.
- Edwards K. A , Rogerson A. M , Winant C. D , Rogers D. P . Adjustment of the marine atmospheric boundary layer to a coastal cape. J. Atmos. Sci. 2001; 58: 1511–1528.
- Findlater J . A major low-level air current near the Indian Ocean during the northern summer. Q. J. Roy. Meteorol. Soc. 1969; 95: 362–380.
- Fiuza A , Macedo A. M , Guerreiro M . Climatological space and time variation of the Portuguese coastal upwelling. Oceanol. Acta. 1982; 5: 31–40.
- Gerber H , Chang S , Holt T . Evolution of a boundary-layer jet. J. Atmos. Sci. 1989; 46: 1312–1326.
- Haak T. S , Burk D , Dorman C , Rogers D . Supercritical flow interaction within the Cape Blanco-Cape-Mendocino orographic complex. Mon. Weather. Rev. 2000; 129: 688–708.
- Haack T, Burk S. D, Hodur R. M. U.S. West Coast surface heat fluxes, wind stress, and wind stress curl from a mesoscale model. Mon. Weather. Rev. 2005; 133: 3202–3216. DOI: http://dx.doi.org/10.1175/MWR3025.1.
- Hoinka K. P , Castro M . The Iberian Peninsula thermal low. Q. J. Roy. Meteorol. Soc. 2003; 129: 1491–1511.
- Holt T. R . Mesoscale forcing of a boundary layer jet along the California coast. J. Geophys. Res. 1996; 101: 4235–4254.
- Lopes A , Oliveira S , Fragoso M , Andrade J. A , Pedro P . Wind risk assessment in urban environments: the case of falling trees during windstorm events in Lisbon. Bioclimatology and Natural Hazards. International Scientific Conference. 2009; Slovakia: Pol'ana nad Detvou. ISBN 978-80-228-17-60-8.
- Nicholson S. E . A low-level jet along the Benguela coast, an integral part of the Benguela current ecosystem. Climatic. Change. 2010; 99: 613–624.
- Nuss W. A , Bane J , Thompson W , Dorman C , Ralph M , co-authors . Coastally trapped wind reversals: a new level of understanding from the experiment on coastally trapped disturbances. Bull. Am. Meteorol. Soc. 2000; 81: 719–743.
- Parish T . Forcing of the summertime low-level jet along the California coast. J. Appl. Meteorol. 2000; 39: 2421–2433.
- Pauly D , Christensen V . Primary production required to sustain global fisheries. Nature. 1995; 374: 255–257.
- Peliz A , Rosa T , Santos A. M. P , Pissarra J . Fronts, jets, and counter flows in the Western Iberian upwelling system. J. Mar. Syst. 2002; 35(1–2): 61–77.
- Pomeroy K. R , Parish T. R . A case study of the interaction of the summertime coastal jet with the California topography. Mon. Weather. Rev. 2000; 129: 530–539.
- Rahn D. A , Parish T. R . Diagnosis of the forcing and structure of the coastal jet near Cape Mendocino using in situ observations and numerical simulations. J. Appl. Meteorol. Climatol. 2007; 46: 1455–1468.
- Ranjha R, Svensson G, Tjernström M, Semedo A. Global distribution and seasonal variability of coastal low-level jets derived from ERA-Interim reanalysis. Tellus A. 2013; 65: 20412. DOI: http://dx.doi.org/10.3402/tellusa.v65i0.20412.
- Rogerson A. M . Transcritical flows in the coastal marine atmospheric boundary layer. J. Atmos. Sci. 1999; 56: 2761–2779.
- Skamarock W. C , Klemp J. B , Dudhia J , Gill D. O , Barker D. M , co-authors . A Description of the Advanced Research WRF Version 3. 10.1007/s00382-012-1315-2.
- Skamarock W. C , Klemp J. B , Dudhia J , Gill D. O , Barker D. M , co-authors . A Description of the Advanced Research WRF Version 3. 10.1007/s00382-012-1315-2.
- Söderberg S , Tjernström M . Supercritical channel flow in the coastal atmospheric boundary layer: idealized numerical simulations. J. Geophys. Res. 2001; 106: 17811–17829. 10.1029/2001JD900195.
- Ström L , Tjertnström M , Rogers D. P . Observed dynamics of coastal flow at Cape Mendocino during coastal waves 1996. J. Atmos. Sci. 2001; 58: 953–977.
- Sundararajan R , Tjernström M . Observations and simulations of a non-stationary coastal atmospheric boundary layer. Q. J. Roy. Meteorol. Soc. 1999; 126: 445–476.
- Tang W. Q , Liu W. T , Stiles B. W . Evaluations of high resolution ocean surface vector winds measured by QuikSCAT scatterometer in coastal regions, IEEE Trans. Geosci. Rem. Sens. 2004; 42: 1762–1769.
- Tjernström M . The sensitivity of supercritical atmospheric boundary-layer flow along a coastal mountain barrier. Tellus A. 1999; 51: 880–901.
- Tjernström M , Grisogono B . Simulations of super-critical flow around points and capes in a coastal atmosphere. J. Atmos. Sci. 2000; 57: 108–135.
- Vallis G. K . Climate and the Oceans. 2012; Princeton, NJ: Princeton University Press. 244.
- Warner T. T . Desert Meteorology. 2004; Boston, MA: Cambridge University Press. 595.
- Winant C. D , Dorman C. E , Friehe C. A , Beardsley R. C . The marine layer off northern California: an example of supercritical channel flow. J. Atmos. Sci. 1988; 45: 3588–3605.
- Zemba J , Friehe C. A . The marine boundary layer jet in the coastal ocean dynamics 753 experiment. J. Geophys. Res. 1987; 92: 1489–1496.